Abstract
The phase transformation of the oxide scale that forms on hot-rolled steel strips during cooling is one of the most important phenomena, which determines the surface quality of the strips, because the properties of the oxide scale, such as spallation resistance, crack initiation, and propagation, and pickling behavior, are strongly dependent on the oxide scale microstructure. To obtain steel strips with high surface quality, it is crucial to understand the microstructural development of the oxide scale. In this paper, a thermogravimetric analyzer was used to study the isothermal structure transformation behavior of FeO formed at high temperature in an inert gas (Ar) at 300–550°C for 1000–15000 s. Meanwhile, the isothermal dynamic model of FeO eutectoid transformation was established based on the JMAK equation combined with experimental data. The experimental results show that the oxide scale structure of the sample after pre-oxidation is composed of Fe2O3, Fe3O4, and FeO. At 300°C and 550°C, only the pro-eutectoid structure is formed in the oxide scale, but no eutectoid structure is formed. When the isothermal temperature is in the range of 350–500°C, both pro-eutectoid structure and eutectoid structure are formed in the oxide scale. With the extension of isothermal time, the eutectoid reaction continues until the complete decomposition of FeO. In addition, the FeO eutectoid transformation isothermal dynamics model was used to predict the eutectoid structure content of FeO eutectoid decomposition under different isothermal conditions, and the experimental data were compared with the predicted results, which verified the high prediction accuracy of the model.
1. Introduction
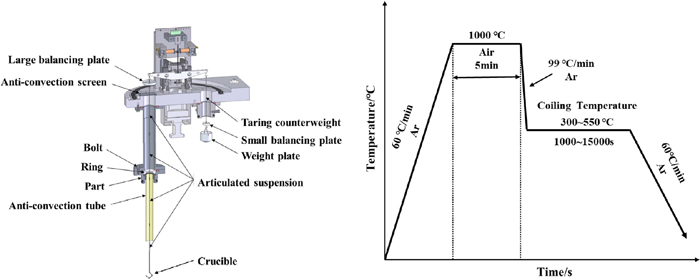
Almost all steel products have to be subjected to hot rolling, during which the steel thickness is reduced through rolling in the range of temperatures from above 1100°C through to 700°C or even lower.1) As the hot rolling process of steel is usually carried out in an oxidizing atmosphere, a thick oxide scale is inevitably oxidized on its surface, which will not only cause material loss but also affect the surface state of steel in the hot rolling process.2) According to the different stages of hot rolled strip oxide scale formation, it can be divided into four types, namely primary oxide, secondary oxide, tertiary oxide, and quaternary oxide.3,4) Both primary and secondary oxide scale can be removed by high-pressure water descaling, tertiary oxide scale are formed during finishing rolling, and quaternary oxide scale are retained after coiling and cooling to room temperature. According to the Fe–O phase diagram shown in Fig. 1,5) the oxide scale on the surface of hot rolled strip is usually composed of three layers, including about 1 pct Fe2O3 atop, and 5 pct Fe3O4 in the middle, and 95 pct FeO underneath. In addition, Fe2O3, Fe3O4 and FeO are thermodynamically stable phases in the temperature range above 570°C. When the temperature is lower than 570°C, FeO is a thermodynamically unstable phase and will undergo eutectoid decomposition to generate lamellar eutectoid structure α-Fe+Fe3O4, which determines the structural composition of the quartic oxide scale after coiling. Finally, the oxide scale with different structure proportions retained affects the pickling efficiency of hot rolled strip steel and the surface state of subsequent processing and forming process.6,7)

Therefore, the mechanism of FeO phase transformation has been extensively studied by researchers. Hayashi8,9) discussed in detail the phase transformation mechanism of oxide scale on the pure iron surface under different partial oxygen pressures. The phase transformation process of FeO in air consists of four parts: the growth of the outer layer of Fe3O4; precipitation of Fe3O4; formation of Fe3O4-seam layer; eutectoid decomposition of FeO. Fe3O4 precipitation did not occur during the FeO phase transformation at low oxygen partial pressure. At higher temperatures during cooling, the growth of outer Fe3O4 was initially dominant, but at lower temperatures before the eutectoid reaction, the precipitation of Fe3O4 controlled the initial transformation. With the decrease of oxygen partial pressure, the nucleation rate of Fe3O4 precipitation decreases, and the incubation period of FeO eutectoid reaction is prolonged, but its phase transformation rate is faster. In these reactions, the growth of the outer layer of Fe3O4 and the precipitation of Fe3O4 promote the saturation of Fe2+ in FeO and then realize the eutectoid decomposition of FeO. The Fe3O4-seam layer acts as a diffusion barrier for Fe to prevent the inward diffusion of Fe through the FeO/Fe matrix and promote the oversaturation of Fe2+ in FeO. The coiling process also has a decisive effect on the eutectoid transformation of FeO. Paidassi10) believed that it was difficult to prevent the precipitation of pro-eutectoid Fe3O4 in FeO no matter how high the cooling rate was in the cooling process, and the oxygen concentration in oxygen-rich FeO was the main factor causing its instability. Zhou11) found that the growth of eutectoid structure α-Fe+Fe3O4 could be promoted by the promotion of diffusion by increasing the cooling rate and the increased of chemical potential of the system caused by compressive stress. Gleeson12) found that the phase transformation behavior of FeO largely depends on the degree of undercooling below the eutectoid temperature. With the decrease in temperature, the degree of undercooling keeps increasing and the phase transformation behavior also keeps changing. Based on the previous studies, it is worth noting that the chemical composition of steel also affects the phase transformation of FeO, besides start cooling temperature, iso-thermal time, and cooling rate. Shizukawa and Yoneda13,14) proposed the effect of Mn, Au addition to steel on the eutectoid transformation of FeO in oxide scale. Mn addition decreases the driving force for the FeO decomposition via eutectoid reaction and extends the FeO phase region to a lower temperature. Au addition suppresses the precipitation of magnetite seam and accelerates the eutectoid reaction. Li et al.15) found in their study that Cr in steel would form a Cr-rich layer at the oxide scale/matrix interface and replace the Fe3O4-seam layer, shortening the incubation period of eutectoid formation and significantly improving the transformation rate of FeO eutectoid reaction. In addition, the initial oxide scale structure retained after coiling also has a great influence on the FeO phase transformation behavior. H.Tanei16) found that the oxide scale structure of single-layer FeO preferentially generates Fe3O4 precipitation (Fe3O4-seam layer) at the oxide scale/matrix interface. Compared with the double-layer oxide scale of Fe3O4 and FeO, Monolayer FeO requires a longer transformation time, so the phase transformation behavior of FeO can be controlled by controlling the initial oxide structure. So far, a large number of studies have focused on the effect of the processing system, alloying elements, and initial scale structure on the FeO eutectoid transformation mechanism. These research results provide good theoretical guidance for the structure control of the oxide scale.
The study of the FeO eutectoid transformation process and its dynamic behavior is the basis for precise control of the structure of the oxide scale. However, the current research on the structural transformation of oxide scale mainly focuses on the mechanism analysis of FeO eutectoid transformation, while FeO eutectoid transformation kinetics and model are rarely reported. The eutectoid transformation of FeO is a typical diffusion phase transformation. At present, domestic and foreign researchers focus on the diffusion phase transformation,17,18) dynamic and static recrystallization19,20) and other aspects.21,22) Johnson – Mehl – Avrami - Kolmogorov (JMAK) equation23,24,25) is in good agreement with most of the experimental data on the diffusion phase transformation. Several phenomenological transformation models have been proposed. Due to the simplicity and numerical convenience, the JMAK equation approach is most commonly employed in industrial process models. Therefore, in this paper, the isothermal transformation process of iron oxide scale of low carbon steel is simulated, and the isothermal kinetic model of FeO eutectoid transformation is established based on JMAK empirical equation combined with experimental data. The prediction accuracy of the model is verified by experimental results and literature data, which lays a model foundation for the accurate control of iron oxide scale structure, to accurately obtain the iron oxide scale structure with special functions, such as reducing pickling and avoiding pickling.2)
2. Experimental
The chemical composition of experimental samples was shown in Table 1. Firstly, the experimental materials were cut into several rectangular specimens with a size of 2×6×10 mm and ground to a 1500-grit finish using SiC abrasive papers. All samples were then ultrasonically degreased in acetone before oxidation.
Table 1. Chemical composition of steel (wt.%).
| C | Si | Mn | P | S | B | Alt |
|---|
| 0.04 | 0.075 | 0.17 | ≤0.02 | ≤0.01 | 0.0015 | 0.0015 |
Firstly, the prepared sample was suspended in the graphite resistance furnace chamber of the Setsys Evolution synchronous thermal analyzer with nickel-chromium alloy wire. After closing the furnace chamber and vacuuming, the furnace chamber was gradually filled with Ar. Then the pre-oxidation temperature was increased to 1000°C at a heating rate of 60°C·min−1, and then the air was filled at a flow rate of 100 mL·min−1 for 5 min. After pre-oxidation, re-enter Ar and quickly cool to isothermal transformation temperature (300–550°C), and at this temperature, heat preserve 1000–15000 s, after heat preservation cooling to room temperature, experimental equipment and process route as shown in Fig. 2.
The cross-sectional morphologies of initial and final oxide scales were characterized by electron probe microanalyzer (EPMA). X-ray diffraction (XRD) with a Cu-Kα target was used to analyze the phase composition of the oxide scale. Image Pro Plus 6.0 was used for the subsequent eutectoid structure volume fraction statistics.
3. Experiment Results
Figure 3 shows the cross-sectional morphology and XRD pattern of the oxide scale formed by pre-oxidation of the experimental steel at 1000°C for 5 min. The pre-oxidized oxide scale exhibits a typical layered structure, including Fe3O4 in the outer layer, FeO in the inner layer near the steel substrate, and Fe2O3 in the outermost layer. The latter was not observed due to its extremely thin thickness, but the existence of Fe2O3 was verified by XRD. The total thickness of the oxide scale was measured to be about 38 μm, including the Fe3O4 layer with about 4 μm thickness atop the FeO layer with the thickness of about 34 μm.
Figure 4 shows the cross-sectional morphologies of the oxide scale of the experimental steel at different isothermal transformation times at 300°C and 550°C. Under the influence of temperature and undercooling, no eutectoid structure was found during isothermal transformation at both temperatures.

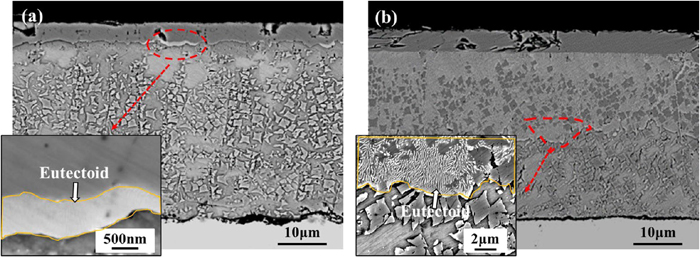
Figure 5 shows the morphologies of scale formed by isothermal transformation of 1000 s, 5000 s, 10000 s and 15000 s at different temperatures. When the isothermal transformation was conducted for 1000 s, the structure at different temperatures was similar. Firstly, a large number of block-like pro-eutectoid Fe3O4 was precipitated on the FeO layer, and the Fe3O4-Seam layer appeared at the interface near the oxide scale and the matrix. In addition, a small amount of eutectoid structure precipitated at the interface between the outer Fe3O4 layer and the FeO layer. The microstructure of the oxide scale after isothermal transformation for 5000 s shows that the eutectoid microstructure continues to increase, the proportion of it gradually increases, and it grows from the interface of Fe3O4 layer and FeO layer to the substrate. At the same time, after the eutectoid FeO around the eutectoid Fe3O4 takes place in the eutectoid organization, the eutectoid Fe3O4 is granular, which is essentially consistent with the composition of the eutectoid Fe3O4 without eutectoid transformation in the outer region. After isothermal treatment for 10000 s, the proportion of eutectoid microstructure increased significantly. When the reaction time was extended to 15000 s, the FeO at 350°C was also completely transformed into the eutectoid structure. For other transformation temperatures, even if the isothermal time continued to extend, the structure of the oxide scale did not change.

When the isothermal transformation time was the same, with the increase of transformation temperature, the undercooling gradually decreased, and the content and size of pro-eutectoid Fe3O4 did not change significantly, but the content of eutectoid microstructure at different transformation temperatures was significantly different. When the transformation temperature increased from 350°C to 450°C, the content of eutectoid microstructure inside the FeO layer gradually increased, but when the transformation temperature increased to 500°C, the fraction of eutectoid gradually decreased. When the transformation temperature was at 450°C, the fraction of eutectoid was the most, and the process of eutectoid reaction was the fastest. When the isothermal time attaches to 5000 s, FeO is almost completely transformed into eutectoid. The interface of Fe3O4/FeO is the starting point for the nucleation and growth of the eutectoid structure. The energy fluctuation of the phase interface provides favorable conditions for the formation of new phases. Therefore, at different transformation temperatures and times, the eutectoid structure is precipitated first at the Fe3O4/FeO two-phase interface and gradually grows towards the matrix until FeO is completely transformed into eutectoid structure.
The decomposition kinetics curves of FeO in the range of 300°C to 550°C for different holding times are shown in Fig. 6. It can be seen from the figure that the FeO eutectoid transformation in the oxide scale can be divided into three stages, namely, the incubation stage, acceleration stage, and decaying stage. At the incubation stage, the eutectoid microstructure was found at the interface between the outer Fe3O4 layer and the FeO layer after isothermal treatment at 350–500°C for 1000 s, indicating the eutectoid microstructure began to nucleate at this interface due to the energy fluctuation, and no eutectoid reaction occurred at 300°C and 550°C. In the acceleration stage, when the isothermal temperature was 350–500°C and preserved for 3000–10000 s, the nucleation number of eutectoid microstructure was significantly increased and grew continuously. Therefore, the oxide scale underwent a rapid eutectoid transformation at this stage. It can be seen from Fig. 6 that the process of eutectoid transformation was the fastest when the isothermal temperature was 450°C. In the decaying stage, the isothermal time range is from 5000 s to 15000 s. Since most FeO has been decomposed in the acceleration stage, the proportion of eutectoid microstructure changes little in this stage.

4. Discussion
After isothermally treating in an inert gas (Ar) at 300–550°C for different times, it can be found that the primary precipitation of Fe3O4 always starts in the oxygen-rich zone outside the FeO layer. According to the Fe-O phase diagram,5) when the FeO component at the Fe3O4/FeO interface cools to the pro-eutectoid FeO+Fe3O4 region at the oxidation temperature, the oxygen content in FeO gradually reaches the supersaturation state, which leads to the precipitation of pro-eutectoid Fe3O4 in the iron-rich FeO layer. The reaction is shown in Eq. (1):
|
Fe
1-x
O→
x-y
1-4y
Fe
3
O
4
+
1-4x
1-4y
Fe
1-y
O(iron rich)
x≥y
| (1) |
Gleeson et al.12) suggested that the thermodynamic driving force of any phase transformation is closely related to the change of free energy ΔG, and the reaction can only occur when ΔG is negative. However, ΔG cannot determine the nucleation rate of each phase. For the new phase nucleation, the united volume Gibbs free energy ΔGv changes, and the interface energy γ is more important. The thermodynamic model24) is shown in Eq. (2):
|
N
v
=K exp[
-1
kT
{
A
γ
3
(
Δ
G
v
+ϵ
)
2
+Q
}
]
| (2) |
Where K and A are constants, Q is the activation energy for diffusion in the untransformed solid (i.e., iron in FeO), Nv is nucleation rate; ε is the elastic strain energy per unit volume of a new phase, and take the value of 0 in this paper, γ is interfacial energy; k is the Boltzmann constant, and T is the absolute temperature.
It can be seen from Eq. (2) that the nucleation rate Nv will greatly increase with the decrease of γ3/(ΔGv+ε)2. It can be seen from Fig. 7 that ΔGv (Fe3O4) is much larger than ΔGv (α-Fe) due to the relative position of the minimum volume free energy curve of α-Fe and Fe3O4 precipitated from the parent FeO, and the Fe3O4 and FeO precipitated from the parent FeO will form a coherent interface, which will inevitably lead to a low interface energy γ(FeO/Fe3O4) between FeO and Fe3O4, as shown in Eq. (3). It can be seen from the Eq. (3) that the nucleation rate of pro-eutectoid Fe3O4 is greater than that of α-Fe, so the pro-eutectoid Fe3O4 is bound to be preferred to the precipitation of eutectoid α-Fe+Fe3O4 during the cooling process.
|
γ
3
(
Δ
G
v
+ϵ
)
2
|
Fe
3
O
4
<<
γ
3
(
Δ
G
v
+ϵ
)
2
|
α-Fe
| (3) |
According to the Fe–O phase diagram, during the cooling process, when the temperature is reduced to 570°C, the three phases of FeO, Fe3O4, and α-Fe are balanced. As the temperature continues to decrease, the eutectoid reaction of FeO occurs, as shown in Eq. (4):
|
4
Fe
1-y
O(iron rich)→
Fe
3
O
4
+(1-4y)Fe
| (4) |
The precipitation of pro-eutectoid Fe3O4 leads to the transformation of FeO into an iron-rich phase. When the eutectoid reaction occurs, the iron-rich FeO is decomposed to form the eutectoid structure α-Fe+Fe3O4. The nucleation sites of α-Fe as the leading phase are mostly at the Fe3O4/FeO phase interface, FeO grain boundary, and pro-eutectoid Fe3O4/FeO phase interface. The interface is conducive to the generation of structural fluctuation, composition fluctuation, and energy fluctuation, which are easy to meet the nucleation conditions. The formation of the lamellar morphology is due to the precipitation of α-Fe, which not only develops to the depth of FeO grains but also grows laterally. When α-Fe grows up, the iron-rich phase FeO on both sides of α-Fe gradually transforms into oxygen-rich phase FeO, thus creating conditions for the nucleation of Fe3O4 on both sides of α-Fe. After the formation of Fe3O4 on both sides of α-Fe, both of them grow together. The lateral growth of Fe3O4 must form an iron-rich zone at the interface with FeO, which in turn promotes the formation of new α-Fe phases on both sides of Fe3O4. Therefore, α-Fe and Fe3O4 complement each other, coordinate and cooperate, alternately nucleate and grow, and finally obtain lamellar eutectoid structure, as shown in Fig. 8.
The eutectoid transformation of FeO is a diffusion-type phase transformation, which is a typical nucleation and growth process. The transformation rate depends on the nucleation rate and growth rate affected by undercooling. Therefore, the kinetics of isothermal transformation of FeO conforms to the general law of nucleation and growth. The kinetics of isothermal transformation of FeO can be described by Johnson-Mehl-Avrami-Kolmogorov (JMAK) equation.23,24,25) The JMAK equation is a semi-empirical and semi-theoretical model describing the kinetics of isothermal transformation. The relationship between the volume fraction of eutectoid microstructure in the FeO layer and time can be expressed as follows:
|
X
eutectoid
=1-exp(-K
t
n
)
| (5) |
Where Xeutectoid is eutectoid structure volume fraction, t is time, s, K is Coefficient, depending on the phase transformation temperature, n is Coefficient, depending on the type of phase transformation. The Eq. (5) can be further transformed to obtain Eq. (6):
|
lnln(
1/(
1-
X
eutectoid
)
)
=lnK+nlnt
| (6) |
The above equation shows that lnln(1/(1−Xeutectoid)) has a linear relationship with ln t, the slope is n, and the intercept is ln K. Substituting the volume fraction of eutectoid structure in the FeO layer under different isothermal conditions into Eq. (6), the fitting curve shown in Fig. 9 can be obtained. The values of lnK and n at different temperatures are shown in Table 2.
Table 2. lnK and n at different temperature.
| Temperature/°C | 350 | 400 | 450 | 500 |
|---|
| n | 1.81 | 1.82 | 1.75 | 1.82 |
| lnK | −16.70 | −15.02 | −14.44 | −16.00 |
The Avrami exponent n in the JMAK equation depends on the type of phase transformation and is independent of temperature. Since FeO eutectoid transformation is a phase transition controlled by diffusion process, the growth mode of eutectoid structure is lamellar growth of finite length with n value ranging from 1 to 2. Figure 8(b) shows the morphology of eutectoid structure formed at 450°C isothermal 3000 s. It can be seen that the laminar morphology of eutectoid structure is completely consistent with the growth mode of n=1.8 reaction. So the n value at different temperatures is constant. Therefore, to improve the prediction accuracy, the n values at different temperatures need to be averaged. Since K depends on the supercooling of the phase transformation process, the relationship between ln K and ΔT in Table 2 can be fitted by a quadratic polynomial. The fitting results are shown in Fig. 10. It can be seen that the relationship between ln K and ΔT can be well described by a quadratic curve equation, as shown in Eq. (7):
|
lnK=-3.44322×
10
-4
Δ
T
2
+0.09289ΔT-20.64337
| (7) |
Where ΔT is Undercooling degree (570−T), °C.
Substituting the fitting results of each parameter into the JMAK equation, the relationship between the volume fraction of eutectoid microstructure in FeO layer and time under isothermal transformation conditions can be obtained, namely.
|
X
Eutectoid
=(
1-exp(
-
e
(-3.44322×
10
-4
Δ
T
2
+0.09289ΔT-20.64337)
t
1.8
)
)
| (8) |
In addition, due to the inevitable precipitation of eutectoid Fe3O4 in the cooling process of FeO, FeO cannot be completely transformed into eutectoid structure, which also means the volume fraction of FeO eutectoid structure can not reach 100%. By substituting different isothermal transformation temperatures into Eq. (8), the prediction curves of isothermal kinetic curves at different isothermal transformation temperatures can be obtained. Then supplementary experiments were carried out to verify the prediction accuracy of the model, and the volume fraction was calculated after being isothermal treated at 350°C–500°C for 7000 s. Figure 11 shows the comparison between the measured value of eutectoid structure volume fraction of FeO layer after isothermal 7000 s at different temperatures and the prediction results of FeO eutectoid transformation kinetic equation derived from Eq. (8). It can be seen from Fig. 11 that the FeO isothermal transformation kinetic model accurately reflects the changing trend of eutectoid structure volume fraction during transformation, and there is a high degree of agreement between the predicted value and the measured value. To further verify the model accuracy of the FeO isothermal transformation kinetic model, the experimental data of B. Gleeson8) and S. Hayashi10) isothermal transformation are used to compare. It can be seen that the error between the predicted value and the measured value of the FeO isothermal transformation kinetic model is relatively small, and the trend of eutectoid transformation tends to be consistent, so the FeO isothermal transformation kinetic model based on JMAK equation has higher prediction accuracy.

When the volume fraction of eutectoid tissue in the FeO layer reaches 5%, the eutectoid transformation can be considered to have started, and when the volume fraction of eutectoid tissue in the FeO layer reaches 95%, the eutectoid transformation can be considered to have ended. In this paper, Eq. (8) was used to predict the transformation time and temperature when the volume fraction of eutectoid tissue was 5%, 30%, 50%, 70% and 95%. Combined with the isothermal experimental results, the isothermal transformation curve of FeO was drawn, as shown in Fig. 12. The curves in the figure represent the TTT curves of 5%, 30%, 50%, 70% and 95% predicted eutectoid tissue volume fraction based on the model. The isothermal transformation TTT curve of FeO is in “C” shape. Through the relation curve between ln K and ΔT, it can be calculated that the temperature when lnK reaches the maximum is 435°C. By bringing the maximum ln K into the isothermal transformation kinetic model of FeO, the nose tip temperature of “C” curve can be calculated, indicating that K value affects the eutectoid transformation behavior of FeO. The higher the value of ln K, the faster the eutectoid transformation rate of FeO. In addition, as can be seen from Fig. 12, the temperature at the tip of the nose, the eutectoid transformation has the shortest incubation period and the fastest transformation speed, and the eutectoid transformation is completed first. Above the nasal tip temperature, the incubation period of the eutectoid transformation increased with the increase of temperature, and below the nasal tip temperature, the incubation period of the eutectoid transformation also increased with the decrease of temperature. Figure 13 shows the effect of temperature and time on the eutectoid transformation rate. It can be seen that the eutectoid transformation rate increases at first and decreases with the increase of isothermal temperature and time.

5. Conclusions
(1) When the phase transformation temperatures were 300°C and 550°C, only the pro-eutectoid Fe3O4 was precipitated in the FeO layer. When the phase transformation temperature was in the range of 350–500°C, the pro-eutectoid Fe3O4 firstly precipitated in the FeO layer, and then the Fe3O4-Seam layer was formed at the FeO/substrate interface. Finally, the eutectoid α-Fe+ Fe3O4 gradually precipitated at the Fe3O4/FeO interface until the reaction was complete.
(2) The FeO eutectoid transformation process can be divided into three stages, namely, the incubation stage, acceleration stage and decaying stage. It takes the shortest time to complete all eutectoid transformations at 450°C.
(3) Based on JMAK equation and experimental data, the isothermal kinetic model of FeO eutectoid transformation is established, and the nose tip temperature of “C” curve is 435°C. In addition, the volume fraction of eutectoid structure during FeO isothermal transformation at a certain temperature can be calculated by using this model, which provides a theoretical basis for the structure control of the oxide scale.
Acknowledgment
The authors would like to acknowledge the financial support from the National Key Research and Development Program of China (No. 2021YFB3702404), the Postdoctoral Science Foundation of China (2021M701167).
References
- 1) C. Y. Cui, H. Wang, X. Y. Gao, G. M. Cao and Z. Y. Liu: Metall. Mater. Trans. A, 52 (2021), 4112. https://doi.org/10.1007/s11661-021-06368-5
- 2) Z. Y. Liu and G. M. Cao: Studies on Oxidation Behavior of Steels During Hot Rolling and Development and Application of the Scale Control Technologies, Metallurgical Industry Press, Beijing, (2021), 226 (in Chinese).
- 3) R. Y. Chen and W. Y. D. Yuen: Oxid. Met., 59 (2003), 433. https://doi.org/10.1023/A:1023685905159
- 4) X. L. Yu, Z. Y. Jiang, J. W. Zhao, D. B. Wei, J. Zhou, C. L. Zhou and Q. X. Huang: Metall. Mater. Trans. B, 46 (2015), 2503. https://doi.org/10.1007/s11663-015-0443-6
- 5) N. Birks, G. H. Meier and F. S. Pettit: Introduction to the High Temperature Oxidation of Metals, Cambrige University Press, Cambrige, UK, (2006), 83. https://doi.org/10.1017/CBO9781139163903
- 6) D. Genève, D. Rouxel, P. Pigeat and M. Confente: Corros. Sci., 52 (2010), 1155. https://doi.org/10.1016/j.corsci.2009.12.028
- 7) A. Chattopadhyay, P. Kumar and D. Roy: Surf. Coat. Technol., 203 (2009), 2912. https://doi.org/10.1016/j.surfcoat.2009.03.006
- 8) S. Hayashi, K. Mizumoto, S. Yoneda, Y. Kondo, H. Tanei and S. Ukai: Oxid. Met., 81 (2014), 357. https://doi.org/10.1007/s11085-013-9442-7
- 9) S. Hayashi, S. Yoneda, Y. Kondo and H. Tanei: Oxid. Met., 94 (2020), 81. https://doi.org/10.1007/s11085-020-09979-2
- 10) J. Paidassi: Acta Metall., 3 (1955), 447. https://doi.org/10.1016/0001-6160(55)90133-4
- 11) C. H. Zhou, H. T. Ma, Y. Li and L. Wang: Oxid. Met., 78 (2012), 145. https://doi.org/10.1007/s11085-012-9296-4
- 12) B. Gleeson, S. M. M. Hadavi and D. Young: Mater. High Temp., 17 (2000), 311. https://doi.org/10.1179/mht.2000.17.2.020
- 13) Y. Shizukawa, S. Hayashi, S. Yoneda, Y. Kondo, H. Tanei and S. Ukai: Oxid. Met., 86 (2016), 315. https://doi.org/10.1007/s11085-016-9638-8
- 14) S. Yoneda, S. Hayashi, Y. Kondo, H. Tanei and S. Ukai: Oxid. Met., 87 (2017), 125. https://doi.org/10.1007/s11085-016-9661-9
- 15) Z. F. Li, G. M. Cao, F. Lin, C. Y. Cui, H. Wang and Z. Y. Liu: ISIJ Int., 58 (2018), 2338. https://doi.org/10.2355/isijinternational.ISIJINT-2018-365
- 16) H. Tanei and Y. Kondo: ISIJ Int., 52 (2012), 105. https://doi.org/10.2355/isijinternational.52.105
- 17) D. An, S. Pan, L. Huang, T. Dai, B. Krakauer and M. Zhu: ISIJ Int., 54 (2014), 422. https://doi.org/10.2355/isijinternational.54.422
- 18) T. A. Kop, Y. van Leeuwen, J. Sietsma and S. van der Zwaag: ISIJ Int., 40 (2000), 713. https://doi.org/10.1007/10.2355/isijinternational.40.713
- 19) D. Liu, F. Fazeli and M. Militzer: ISIJ Int., 47 (2007), 1789. https://doi.org/10.2355/isijinternational.47.1789
- 20) Y. Mazaheri, A. Kermanpur, A. Najafizadeh and A. Ghatei Kalashami: Metall. Mater. Trans. A, 47 (2016), 1040. https://doi.org/10.1007/s11661-015-3288-3
- 21) F. G. Caballero, C. Capdevila and C. García De Andrés: ISIJ Int., 41 (2001), 1093. https://doi.org/10.2355/isijinternational.41.1093
- 22) T. Jia and M. Militzer: ISIJ Int., 52 (2012), 644. https://doi.org/10.2355/isijinternational.52.644
- 23) W. A. Johnson and R. F. Mehl: Trans. Am. Inst. Min. Metall. Eng., 135 (1939), 416.
- 24) M. Avrami: J. Chem. Phys., 7 (1939), No. 12, 1103.
- 25) A. N. Kolmogorov: Bull. Acad. Sci. USSR, 1 (1937), 355.


