Abstract
A three-dimensional (3D) model has been developed based on the Eulerian multiphase flow approach to investigate the fluid flow behavior and mixing efficiency in the multi-tuyere AOD process. The interphase forces, including drag force, lift force, virtual force, turbulent dispersion force, and wall lubrication force, were incorporated into this model. The model was used to simulate six-tuyere and seven-tuyere AOD processes. The phenomena of multi-jet penetration, bubble plume merging, 3D turbulent flow and mixing characteristics were considered. The results indicate that the bubble plume merging occurs in the upper part of the liquid bath, forming a typical plume cluster. The predicted penetration length for a single tuyere jet agrees well with the previous work. For the multi-jet system, the side jets penetrate deeper than the inside ones. The six-tuyere AOD has a good flow condition in the center of the liquid bath, while the seven-tuyere AOD has a better flow pattern in the sidewall region and the lower bath. Overall, the seven-tuyere AOD performs better in mixing efficiency than the six-tuyere AOD under the same gas flow rate. These findings increase the understanding of the AOD process, allowing further optimization of process parameters. This model can be further extended to incorporate the thermochemical reactions into the modeling of the AOD reactor.
1. Introduction
The argon-oxygen decarburization (AOD) process is a crucial refining method in modern stainless steel production. It has been widely used to remove C and reduce Cr loss with high effectiveness in the past few decades.1,2) The AOD converter can provide excellent mixing conditions due to the turbulent stirring through the submerged side tuyere blowing or the combined side and top tuyere blowing. The flow characteristics in the AOD bath significantly affect the mass, momentum, and heat transfer, which is closely linked with the gas-metal reaction kinetics. In-depth studies on jet behavior, bubble flow characteristics, and mixing efficiency support optimization and design of decarburization and desulfurization processes, thereby facilitating the productivity of AOD processes and reducing their energy and material consumption as well as manufacturing costs.1)
The investigation of the AOD process modeling includes physical modeling and numerical simulations according to the research approach. Traditionally, the modified Froude number for the similarity criterion is employed to design the AOD water modeling system, and various model scales are adopted.3) The physical modeling mainly focuses on the flow phenomena, such as velocity field,4,5) turbulence behavior,5) penetration length,6) mixing efficiency,1,2) liquid surface vibration7,8) and slag behavior.9) Meanwhile, the AOD process has also been investigated numerically, and a series of mathematical models have been developed. Zhu et al.10) developed a mathematical model incorporating a plume model to predict the 3D turbulent flow and mixing behavior. Gittler et al.11) applied a more specified inlet boundary by considering the velocity distribution and bubble size to simulate the fluid flow of an industrial process. Ersson and Tilliander12) pointed out that these early models did not consider the realistic inlet boundary condition or the slag phase, which could cause the simulation to deviate from the realistic flow.
The Computational Fluid Dynamics (CFD) technique has been proven effective in solving the complex flow field in AOD converters, and a series of CFD-based models have been developed. Tilliander et al.13) developed a 3D single tuyere AOD model, in which a separate AOD tuyere model verified by Laser Doppler Anemometer (LDA) measurements14,15) was used to describe the pressure inlet boundary conditions. In their later work,16) this model was extended to simulate a six tuyeres AOD converter, and the fluid slag phase was also included. The model successfully predicted the fluid flow, turbulence, bubble behavior and liquid steel-slag dispersion. Wei et al.17,18) carried out a sequence of studies on the combined side and top-blowing AOD process through numerical simulations. The influence of the tuyere angle, side-tuyere number and gas flow rate on the fluid characteristics and mixing efficiency were reported. The tuyere number and the tuyere angle had little effect on the overall mixing characteristics but certainly caused local variations in the mixing efficiency.1,2) Their work also showed that the top lance did not change the essential features of mixing created by the side blowing but significantly increased the turbulent kinetic energy and changed the local flow pattern.
The penetration length was usually considered one of the essential parameters to describe the gas jet.19) Bjurström et al.6) conducted the water modeling to investigate the fluid flow and gas penetration in a side-blowing AOD converter. According to their results, the penetration length was more affected by the gas flow rate than the bath height. Tilliander et al.13,15) conducted physical and numerical simulations of an AOD converter and found that the jet penetration length did not exceed the bath center, even though the penetration length (i.e., 21 cm) was larger than that (i.e., 14 cm) proposed by Hoefele and Brimacombe.20) Odental et al.3) also observed the limited penetration in their numerical and physical simulations for a seven-tuyere AOD converter. The penetration length was usually less than 0.4 m, and the bubble plumes rose to the nozzle wall. Chanouian et al.21) investigated the influence of the converter inclination on mixing time and jet-penetration based on a side-blown physical model, and found that the inclination angle did not affect the penetration length, but increased the mixing time.
Although previous studies have given significant insights into the multiphase flow phenomena in the AOD process, many phenomena such as multi-jets penetration, multi-bubble columns merging, and mixing characteristics still need to be investigated due to the process complexity. This study aims to elucidate the fluid flow behavior and the mixing characteristics in multi-tuyere AOD processes. A 3D multiphase flow model was developed based on the Eulerian-Eulerian multiphase flow approach. The drag force and non-drag forces, including lift, virtual, turbulent dispersion and wall lubrication forces, are incorporated into the model. The influence of inlet pressure and tuyere configuration (i.e., six tuyere scheme and seven tuyere scheme) on the bath behavior were discussed.
2. Theoretical Model
The kinetic efficiency of Cr recovery is flow-related, and the present study focuses on the gas-liquid steel flow in the AOD process. The initial temperature of liquid steel is set at 1873 K. The liquid steel is incompressible, and its physical parameters are assumed constant. The enthalpy equations are solved to calculate the temperature distribution and gas properties.
2.1. General Equations
The gas-liquid steel two-phase flow simulation is conducted based on an Eulerian approach, where the Eulerian treatment is used to describe each phase. With this method, the gas and liquid steel phases interact, allowing a significant exchange of momentum and energy between these phases. The continuity and momentum equations of these two phases are given as follows.
Mass conservation:
|
∂(
ρ
i
α
i
)
∂t
+∇⋅(
α
i
ρ
i
u
→
i
)
=0
| (1) |
Momentum conservation:
|
∂(
ρ
i
α
i
u
→
i
)
∂t
+∇⋅(
α
i
ρ
i
u
→
i
u
→
i
)
=-
α
i
∇P+
α
i
ρ
i
g
→
-∇⋅(
α
i
τ
i
)
+
F
i
| (2) |
where
α,
ρ,
τ,
t,
P,
u
→
, and
g
→
are the volume fraction, density, shear stress, time, pressure, velocity and gravity acceleration, respectively. The subscript
i (=
g or
l) represents the gas or liquid phases. The term of
Fi is the interfacial momentum exchange between the gas phase and the liquid phase.
The shear stress term of phase i can be expressed as
|
τ
i
=-
μ
eff, i
(
∇
u
→
i
+
(
∇
u
→
i
)
T
-
2
3
(
∇⋅
u
→
i
)
I
)
| (3) |
where
I is the unity tensor, and
μeff,i is the effective viscosity. For the liquid steel phase, the effective viscosity is calculated by
|
μ
eff, l
=
μ
l
+
μ
t
+
μ
b
| (4) |
where,
μl represents the molecular viscosity,
μt is the turbulent viscosity, and
μb is the viscosity caused by bubble-induced turbulence. When the
k-
ε turbulent model is employed, the turbulent eddy visco-sity can be calculated according to the
Eq. (5):
|
μ
t
=
ρ
l
C
μ, t
k
2
ε
| (5) |
where
k and
ε represent the turbulent energy and turbulent energy dissipation rate, respectively, and their governing equations
22) are:
|
∂(
α
l
ρ
l
k
)
∂t
+∇⋅(
α
l
ρ
l
u
→
l
k
)
=∇⋅(
α
l
μ
t
σ
k
∇⋅k
)
+
α
l
(
G
k
-
ρ
l
ε
)
+
α
l
ρ
l
k
| (6) |
|
∂(
α
l
ρ
l
ε
)
∂t
+∇⋅(
α
l
ρ
l
u
→
l
ε
)
=∇⋅(
α
l
μ
t
σ
ε
∇⋅ε
)
+
α
l
ε
k
(
C
1
G
k
-
C
2
ρ
l
ε
)
+
α
l
ρ
l
ε
| (7) |
where
Gk is the generation rate of turbulent kinetic energy.
The turbulence induced by the rising bubbles can be described by the model proposed by Sato and Sekiguchi23) using the Eq. (8):
|
μ
b
=
α
g
ρ
l
C
μ,b
d
b
|
u
→
g
-
u
→
l
|
| (8) |
where
db represents the bubble diameter, and
Cμ,b is a model constant.
For the gas phase, Jakobsen et al.24) proposed the Eq. (9) to calculate the effective viscosity:
|
μ
eff, g
=
ρ
g
ρ
l
μ
eff, l
| (9) |
Other constants involved in the k-ε turbulent model are listed in Table 1.
Table 1. Parameters used in k-
ε turbulent model.
| Cμ,t | C1 | C2 | Cμ,b | σk | σε |
|---|
| 0.09 | 1.44 | 1.92 | 0.6 | 1.0 | 1.3 |
The interfacial momentum exchange between gas and liquid in Eq. (2) was modeled by the interphase force, which is given as follows:
|
F
lg
=-
F
gl
=
F
D
+
F
L
+
F
VM
+
F
TD
+
F
WL
| (10) |
where
Flg (
Fgl) denotes the momentum transfer from the liquid (gas) phase to the gas (liquid) phase, and the terms of
FD,
FL,
FVM,
FTD and
FWL on the right-hand side represent the drag force, lift force, virtual mass force, turbulent dispersion force and wall lubrication force, respectively.
2.2.1 Drag Force
The drag force between the gas and liquid phases dominates the interfacial momentum exchange and is commonly expressed by:
|
F
D
=-
3
4
α
g
ρ
l
C
D
d
|
u
→
g
-
u
→
l
|(
u
→
g
-
u
→
l
)
| (11) |
where
CD is the drag force coefficient, which is a function of the bubble Reynolds number
Reb. In the Schiller-Naumann model,
25) CD has the following expression:
|
C
D
={
24
R
e
b
(
1+0.15R
e
b
0.678
)
R
e
b
≤1 000
0.44
R
e
b
>1 000
| (12) |
The bubble Reynolds number can be solved by:
|
R
e
b
=
ρ
l
d
b
|
u
→
g
-
u
→
l
|
μ
l
| (13) |
The bubble diameter can be calculated based on the Oeters model,26) namely:
|
d
b
=
[
2
(
6
C
D
)
1/3
σ
l
0.52g
(
ρ
g
ρ
l
2
)
1/3
]
1/2
| (14) |
where
σl is the surface tension of the liquid phase.
2.2.2. Lift Force
The velocity gradient in the liquid steel flow generates the lift force perpendicular to the motion direction. The lift force is more significant for large bubbles. Based on Drew’s model,27) the lift force can be calculated as:
|
F
L
=
α
g
ρ
l
C
L
(
u
→
g
-
u
→
l
)×∇×
u
→
l
| (15) |
where
CL is the lift force coefficient. The previous work reported that the lift force is usually in the range of 0.1 to 0.5.
28) Some literatures also adopt negative values (
e.g., −0.5 for potential flow).
29,30) For the current bubbly flow regime, Drew and Lahey’s model
31) was employed to describe the lift force coefficient.
2.2.3. Virtual Mass Force
When the bubbles are accelerated relative to the liquid steel phase, the inertia of the liquid phase encountered presents as a virtual mass force on the bubbles, which can be expressed by:
|
F
VM
=
α
g
C
VM
ρ
l
(
D
u
→
g
Dt
-
D
u
→
l
Dt
)
| (16) |
where
CVM is the virtual mass coefficient with a typical value of 0.5.
32)
2.2.4. Turbulent Dispersion Force
Turbulence fluctuations cause additional dispersion of the gas and liquid phases from high volume fraction regions to low volume regions. This effect can be described by the turbulent dispersion force, which accounts for the interphase turbulent momentum transfer. Based on the Tchen theory,19,33) the turbulent dispersion force is given by:
|
F
TD
=
C
TD
C
D
D
t, g
σ
t, g
(
1
α
l
∇
α
l
-
1
α
g
∇
α
g
)
| (17) |
where
CTD is the turbulent dispersion coefficient which is set to 1 by default,
Dt,g is the turbulent kinetic viscosity for the gas phase, and
σt,g is a dispersion Prandtl number with the default value of 0.75.
34)
2.2.5. Wall Lubrication Force
The effect of the wall lubrication force was also included in the present simulation. This force tends to push bubbles away from the wall, concentrating in a region close to but not immediately adjacent to the wall. It has the general form:35)
|
F
WL
=-
α
g
C
WL
ρ
l
|
(
u
→
g
-
u
→
l
)
-(
(
u
→
g
-
u
→
l
)
⋅
n
→
w
)
⋅
n
→
w
|
2
n
→
w
| (18) |
where
CWL is the wall lubrication coefficient,
35) and
n
→
w
is the unit normal pointing away from the wall.
2.3. Ideal Gas Law
The ideal gas law was used to calculate the density of the injected gas for every time step and in each cell. Energy equations were enabled to calculate gas parameters, including gas temperature and density. For the ideal gas flow, the gas law is:
|
ρ
g
=
P
op
+P
R
M
w
T
| (19) |
where
Pop represents the operating pressure,
P is the local relative pressure,
R is the universal gas constant,
Mw is the molecular weight of the gas, and
T is the static temperature in K.
The Sutherland viscosity law,36) which resulted from a kinetic theory based on an idealized intermolecular-force potential, was employed to calculate the temperature-dependent viscosity. The final formula is:
|
μ
g
μ
g0
=
(
T
T
0
)
3/2
T
0
+S
T+S
| (20) |
where
T0 = 273 K and
μg0 = 1.716 × 10
−5 N∙s/m
2 for air.
S is the Sutherland constant and
S = 111 K for the air. Sutherland’s law is typically used for air and gives accurate results with an error of less than a few percent over a wide range of temperatures (170–1900 K).
36)
2.4. Model Geometry and Computational Mesh
A full 3D model was developed based on a company’s 120 t AOD reactor in the present paper. The schematic diagram of the AOD converter is shown in Fig. 1. The dimensions of the computational domain and the tuyere arrangement are given in Table 2. In detail, the reactor has a bottom diameter of D1 = 2532 mm, an upper diameter of D2 = 3586 mm, a total height of H1 = 4151 mm, and a vertical wall length of H2 = 2900 mm. The height of the injection tuyeres H3 is 486 mm. For the six-tuyere AOD, the angle between the axis of the two closest tuyeres is 20 degrees, while the angle is 16.67 degrees for the seven-tuyere AOD. The six tuyere and seven tuyere models cover the same total tuyere angle of 100 degrees, as shown in Figs. 1(b) and 1(c). The inner diameter of each tuyere is 20 mm. The computational domain was filled up to 1568 mm with liquid steel corresponding to 120 t AOD converter. Three domains of 271462, 507006 and 740250 grid respectively were used for mesh independence validation, and the mesh numbers are. The results indicate that when the mesh number exceeds 507006, only a small difference in the average vertical and horizontal steel velocity in the various horizontal planes (≤ 5%) can be found with the other meshes. Therefore, the mesh with the cell number 507006 is sufficient for the current 3D simulation. No-slip wall boundary condition is applied to the surrounding and bottom wall. The tuyere injection was set as the pressure inlet, and the top surface used an open boundary. Physical properties for the present simulation are given in Table 3.

Table 2. Dimensions of the computational domain and tuyere arrangement.
| Reactor | Tuyere |
|---|
| Bottom diameter D1 (mm) | 2532 | Tuyere diameter (mm) | 20 |
| Upper diameter D2 (mm) | 3586 | Submerged depth (mm) | 30 |
| Reactor height H1 (mm) | 4151 | Tuyere height H3 (mm) | 486 |
| Vertical height H2 (mm) | 2900 | Tuyere number | 6, 7 |
| Bath depth (mm) | 1568 | Tuyere angle (degree) | 20, 16.67 |
Table 3. Physical properties for the simulation conditions.
4,16,38)| Parameters | Value |
|---|
| Molten steel density (kg·m−3) | 7020 |
| Molten steel viscosity (kg·m−1·s−1) | 0.0051 |
| Surface tension Liquid steel-gas (N·m−1) | 1.54 |
| Injection pressure (×105 Pa) | 3, 4, 5, 6, 7, 8 |
The phase-coupled SIMPLE scheme was used to solve the governing equations. The time step size starts from 1 × 10⁻⁵ s. Such a case runs until the solution is reasonably converged, and then the time step is appropriately scaled. After obtaining a stable flow field, the mixing time was calculated by injecting the tracer based on the species transfer model.
3. Results and Discussion
3.1. Steel Volume Fraction Distribution
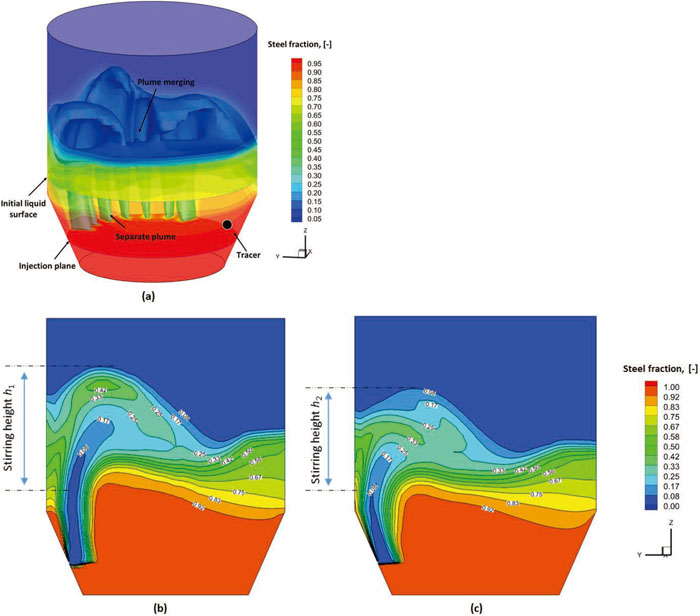
Figure 2(a) shows the typical 3D distribution of liquid volume fraction for the seven-tuyere AOD with the inlet pressure of 0.5 MPa. The gas jet generated in each tuyere forms a separate bubble plume in the lower part of the AOD, while with the bubble plume rising, the adjacent bubble plumes merge in the upper part. The simulation indicates that the mean mass flow rate of the six-tuyere AOD with an inlet pressure of 0.5 MPa (i.e., about 3.0 kg/s) is approximately equal to that of the seven-tuyere AOD with an inlet pressure of 0.6 MPa. The bubble plume patterns of the six-tuyere AOD and the seven-tuyere AOD under the mean mass flow rate of 3.0 kg/s are compared, as shown in Figs. 2(b) and 2(c). Since the single tuyere flow rate of the six-tuyere AOD is higher than that of the seven-tuyere AOD at the mean mass flow rate 3.0 kg, the single bubble column of the six-tuyere AOD is more powerful than that of the seven tuyere AOD, while the gas distributes more homogeneously on the jet plane in the seven-tuyere AOD than that in the six-tuyere AOD. Therefore, the six-tuyere AOD produces a robust and straight bubble plume that drives the molten steel to a higher level, while the seven-tuyere AOD produces a near-wall bubble plume. The stirring height of the seven-tuyere AOD (i.e., h2 = 1.51 m) is lower than that of the six-tuyere AOD (i.e., h1 = 1.87 m).
Hoefele and Brimacombe20) proposed a semi-empirical model to predict the penetration length, which has been widely used to validate simulation results. In this paper, we also use this model to validate our simulations. One tuyere was retained to build up the comparability between our simulation and Hoefele and Brimacombe’s model, and the other tuyeres were set as wall boundaries. Such a case could eliminate the adjacent gas jets effect on the concerned one. The jet penetration length was defined as the distance from the tuyere tip to the position of the gas volume fraction of 0.8, which is consistent with the criterion used by other researchers.37,38,39) The comparison of the simulated penetration length of a single jet with Hoefele and Brimacombe’s model20) was shown in Fig. 3, and the corresponding quantitative comparison was shown in Table 4. The results indicate that the relative error of the simulations is less than 7.7% for various injection conditions, which confirms the validity of the present model.

Table 4. Quantitative comparison of the simulated penetration length with Hoefele and Brimacombe’s model.
20)| Injection pressure | 0.3 MPa | 0.5 MPa | 0.7 MPa |
|---|
| Semi-empirical correlation (m) | 0.168 | 0.224 | 0.284 |
| Present simulation (m) | 0.181 | 0.235 | 0.265 |
| Relative error (%) | 7.7% | 4.9% | 6.7% |
Figure 4 shows the multi-jets distribution along the axial direction of the tuyere from the tuyere tip to the jet-plane center for the six-tuyere AOD and seven-tuyere AOD. The gas jets of different tuyeres have a pronounced influence on each other. Taking the six-tuyere AOD as an example, the side jets (labeled jets 1 and 6) penetrate more profound than the inner jets (labeled jets 2 to 5), leading to a larger gas fraction of the side jets at the same axial distance. That is because all gas jets are directed to the center of the jet plane; therefore, the side jets are squeezed less than the inner jets, generating a deeper penetration. Similar phenomena were observed in the seven-tuyere AOD, where the inside jet formed in the Tuyere 4 has the smallest penetration length as shown in Fig. 4(b) due to the flow squeezing from the adjacent jets. Moreover, the seven-tuyere AOD penetrates shorter than the six-tuyere AOD (see Figs. 4(a) and 4(b)). This is more pronounced for the outer tuyeres (i.e., Tuyeres 1 and 6 for the six-tuyere AOD, and Tuyeres 1 and 7 for the seven-tuyere AOD). That is because the single tuyere flow of the seven-tuyere AOD is lower than that of the six-tuyere AOD, resulting in a shorter penetration depth in the seven-tuyere AOD.
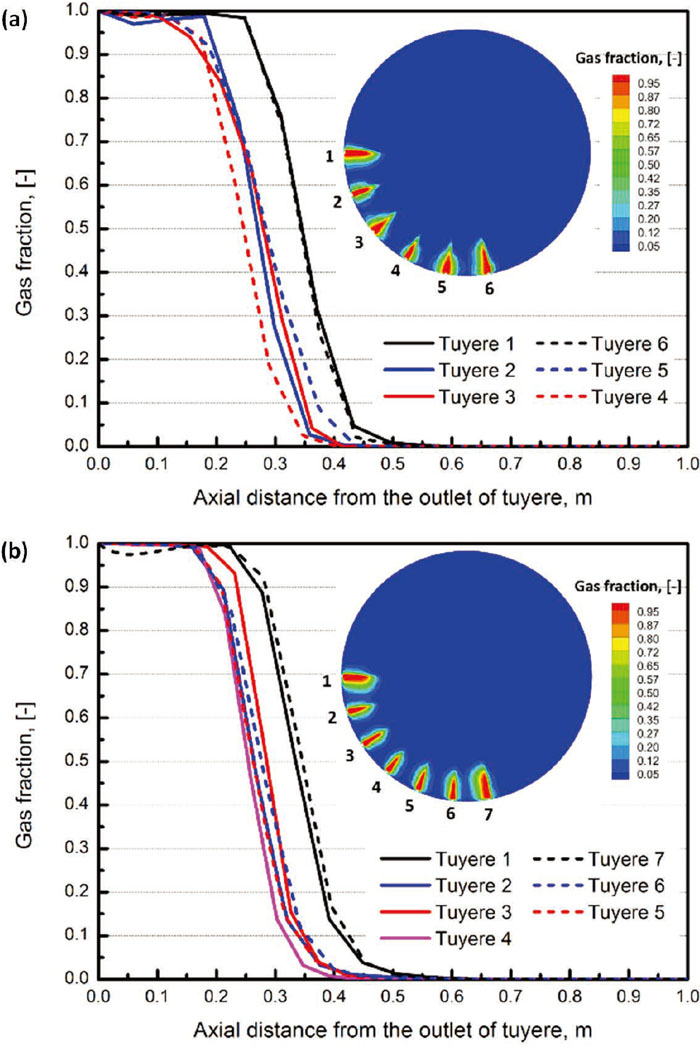
Figure 5 shows the velocity vector distribution of the liquid phase in the vertical plane of the fourth tuyere and the horizontal planes A-A (z = 1.686 m) and B-B (z = 1.236 m) for the seven-tuyere AOD at 120 s. Figure 5(a) shows a typical clockwise circulation in the vertical plane. In detail, the bubble plume drives the liquid steel forming a primary rising flow marked as Stream a, which further evolves into three sub-rising flows, namely Stream c from the center rising flow, and Streams b and d from the outer rising flow. Stream d impinges on the inner wall, forming a narrow anticlockwise vortex at the nozzle side, and Stream b traverses towards the opposite wall, forming a significant clockwise vortex. The core of Stream a is elevated to a relative height. Then it flows down to the liquid bath due to gravity, splitting into recirculation streams, namely, main recirculation flow (Stream f) and sub-top surface flow (Stream e). The velocity of the former is mainly downward, generating the crucial stirring of the liquid zone, and the latter directly flows to the opposite wall, forming a corner swirling. Stream b and c originate from the same Stream a. The difference is that Stream c has a higher bubbly floating energy, forming a stronger clockwise swirling flow. Streams b and f finally converge to the plume region in the lower part of the converter, completing a typical circulation loop.
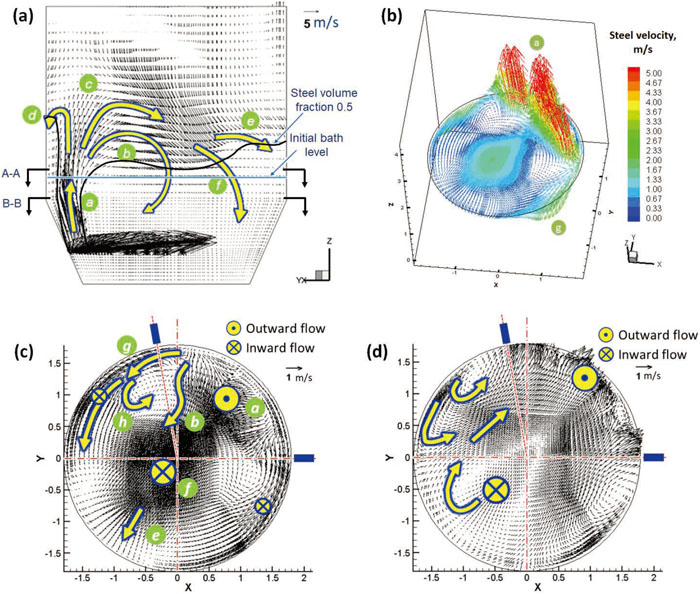
Figures 5(c) and 5(d) respectively show the velocity vector distribution in Planes A-A and B-B. Meanwhile, the 3D velocity vector distribution in Plane A-A (see Fig. 5(b)) was used to understand the flow behavior better. In A-A, the horizontal streams dominantly flow to the opposite wall. Streams a, b, f and e are the same as those streams shown in Fig. 5(a). These streams are induced by the rising flow, traversing the horizontal plane and forming the vertical swirling flow. Note that a sidewall flow (Stream g) presents on each side of the tuyeres. The two streams have a pronounced downward velocity (as shown in Fig. 5(b)), generating typical sidewall vortexes close to the plume zone. The vector distribution in the lower plane B-B indicates that the horizontal streams mainly flow towards the plume zone, eventually merging with the main rising flow. The two sidewall vortexes emerge on the lower horizontal plane and move close to the sidewall, which means the vortex penetrates the whole molten bath from top to bottom with a certain vertical angle.
3.4. Liquid Steel Velocity Distribution
Figure 6 shows the distribution of the time-average liquid steel velocity with the inlet gas flow rate of 3.0 kg/s for the six-tuyere AOD and seven-tuyere AOD. A first high liquid steel velocity zone is formed in the gas jet and bubble plume zones due to the momentum transfer from the gas phase to the liquid phase. Another high-velocity zone is then generated in the upper part of the reactor due to the impact of the falling liquid steel on the molten bath (Fig. 3(a)), which could cause the loss of stirring energy. Circulations are present on each side of the bubble plume: the corner vortex close to the nozzle wall and the main vortex in the bulk bath. The six-tuyere AOD generates a vaster bubble column with a higher rising height than the seven-tuyere AOD, indicating a stronger ability of six-tuyere AOD to lift the molten steel. The center of the six-tuyere AOD (i.e., z = 1.754 m) is higher than that of the seven-tuyere AOD (i.e., z = 1.448 m).

Figure 7 shows the profiles of liquid steel velocity for different horizontal planes (i.e., z-value from 0.486 m to 2.486 m). In the upper part of the reactor (i.e., z = 1.686 and 1.986 m), the horizontal velocity in the seven-tuyere AOD is higher than that in the six-tuyere AOD, leading to more stirring energy loss due to the impingement of traversing liquid steel with the reactor wall. Therefore, in the lower part of the reactor (i.e., z = 0.486, 0.936 and 1.236 m), the horizontal velocity in the seven-tuyere AOD directed to the bubble plume zone is lower than that in the six-tuyere AOD (see Fig. 7(a)). Figure 7(b) indicates that in the six-tuyere AOD, the bubble plume zone is vaster, and the high-velocity zone is closer to the opposite wall. In the seven-tuyere AOD, the velocity of downward flow near the wall (i.e., the flow with negative vertical velocity) is more significant.
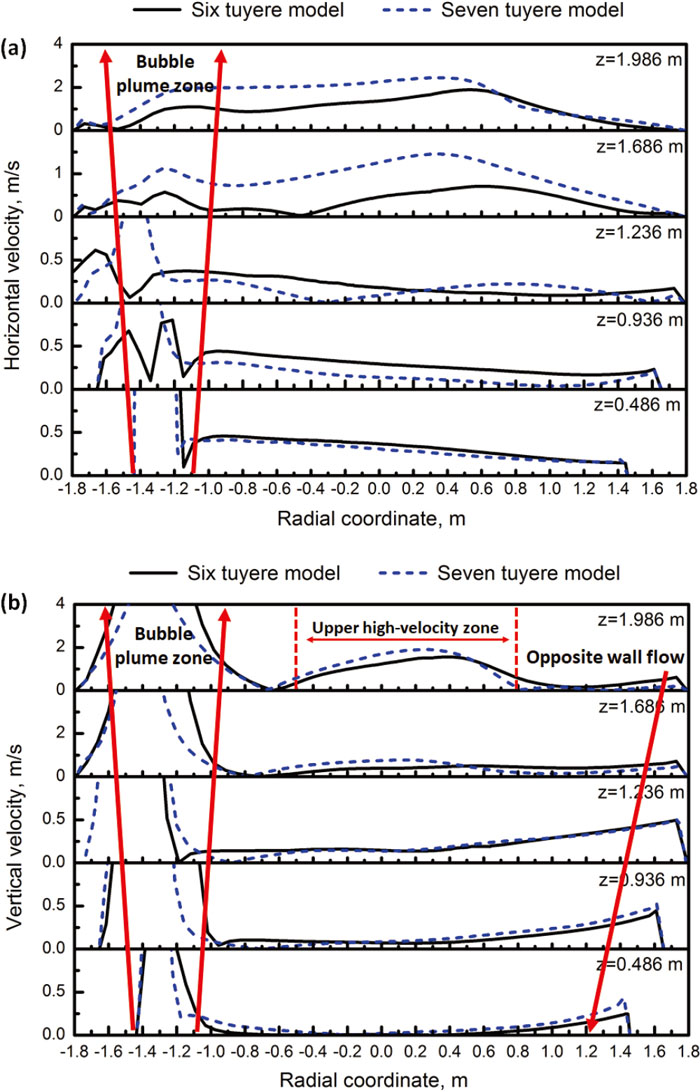
Figure 8 shows the liquid velocity distribution in various horizontal planes (i.e., z-value from 0.486 m to 1.686 m) to characterize the 3D flow in the six-tuyere AOD and seven-tuyere AOD. The liquid steel in the upper part dominantly flows to the wall opposite the tuyeres and then flows downward. The fluid flows back to the bubble plume zone, forming the main circulation described in Fig. 6. In the upper planes (z = 1.686 m for the 6-tuyere model, and z = 1.236 m for the 7-tuyere model), four typical circulations are appearing, namely the two side circulations and the two upper circulations as shown in Figs. 8(a) and 8(d). The former is generated by the strong sidewall streams and appears in all of the horizontal planes. This means that such side circulations penetrate from the top to the bottom of the bath. Comparing Figs. 8(a), 8(c), 8(e) and 8(d), it can be observed that the sidewall flow gradually weakens from top to bottom, causing the side circulations to move to the sidewall. In the lower part, the side circulation even connects with the sidewall, forming a narrow circulation, of which the center velocity is pretty low (Figs. 8(c) and 8(d)). The latter was caused by the backward stream which was produced by the impingement of the side stream and forward stream. However, such circulations only exist in the upper part of the liquid bath. At lower heights, the upper circulations eventually disappear (Figs. 8(e)–8(h)).
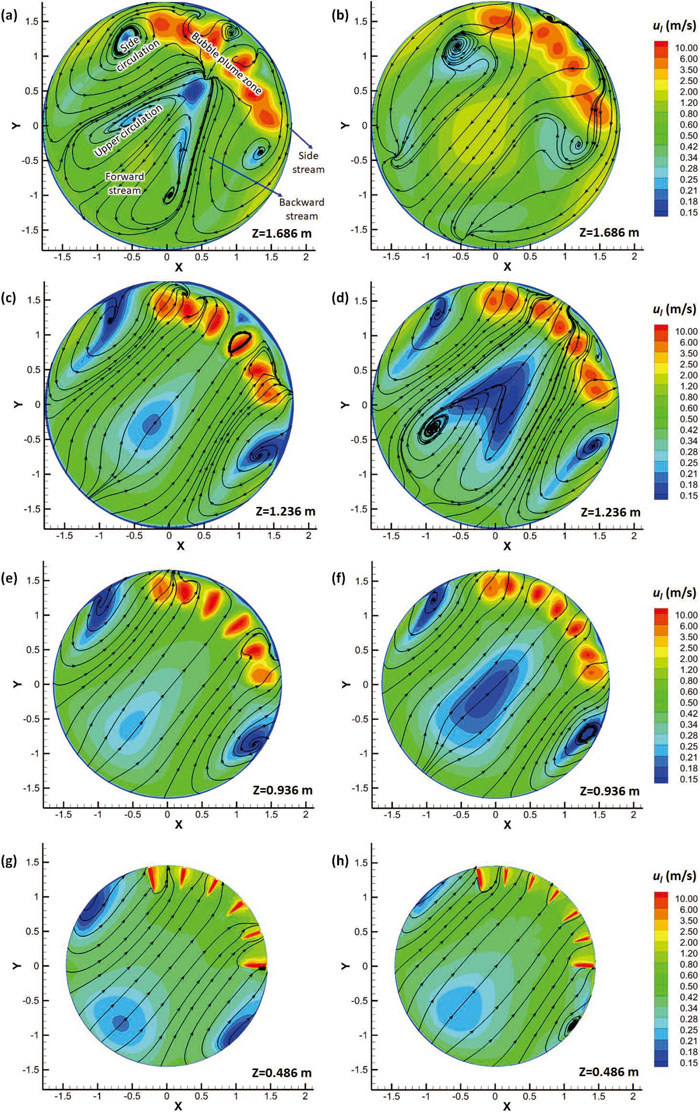
Note that the upper circulations of the six-tuyere AOD are higher than that of the seven-tuyere AOD (see Figs. 8(a) and 8(d)). That is because the six-tuyere AOD generates a higher stirring height than the seven-tuyere AOD at the gas flow rate of 3.0 kg/s (see Fig. 2). Overall, the six-tuyere AOD has a stronger flow in the center of the bath, where the velocity is larger than that in the seven-tuyere AOD. On the other hand, the seven-tuyere AOD has a better flow pattern in the side wall zones, where the area of the low-velocity zone becomes smaller in the height direction. This would be favorable for the bath mixing. When the height z is below 0.936 m, the side circulation in the seven-tuyere AOD becomes small and even disappears (see Fig. 8(h)), which means that the mixing efficiency in the lower part of the seven-tuyere AOD is better than that of the six-tuyere AOD.
3.5. Turbulence Energy Distribution
Figure 9 shows the turbulence kinetic energy distribution (TKE) distribution in the six-tuyere AOD and seven-tuyere AOD with a mean gas flow rate of 3.0 kg/s. It can be observed from the figure that the TKE maximizes in the jet and bubble plume zones in the reactor. The turbulence is more robust in the upper bath than in the lower bath, and the TKE is below 0.2 m2/s2 at the bottom of the reactor. The seven-tuyere AOD generates stronger turbulence in the lower bath than the six-tuyere AOD. Since turbulence is favorable for bath mixing, the higher TKE in the lower bath of the seven-tuyere AOD could indicate a higher mixing efficiency.
3.6. Mixing Phenomena
Since the bath mixing degree determines the efficiency of the metallurgical reactions in the AOD converter, the mixing characteristics are considered in this section. The calculation process consists of two steps: the first step is to calculate the steady flow, and the second step is to simulate the variation of tracer concentration in the steady flow field. The simulation result at 80 s was set as the initial flow field, and the time was zeroed to compute the mixing time. In the simulation, the tracer with the same property as the liquid steel was placed on the injection plane close to the sidewall as shown in Fig. 2. Detectors 1–6 were placed on the bottom plane near the converter wall, where the liquid velocity is relatively low. Detector 7 was placed in the center of the jet plane to monitor the mixing of the main circulation. The specific positions of these detectors are shown in Fig. 10. These operations were expected to find the dead zone, where the mixing time is the longest.
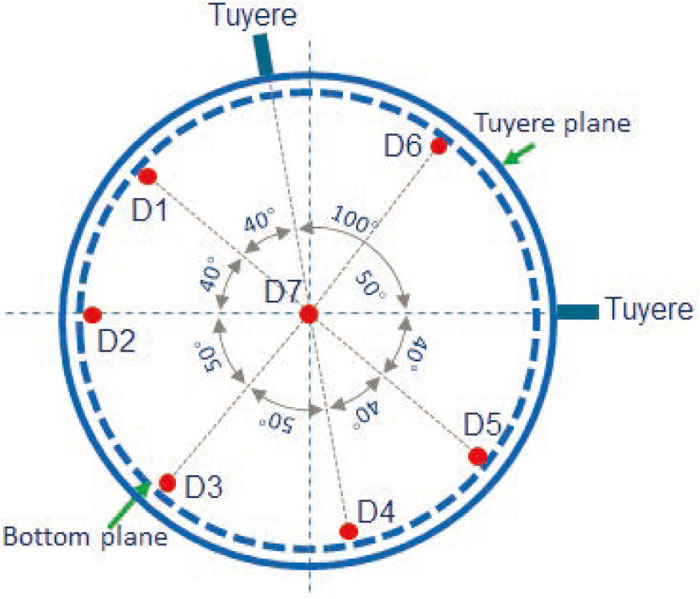
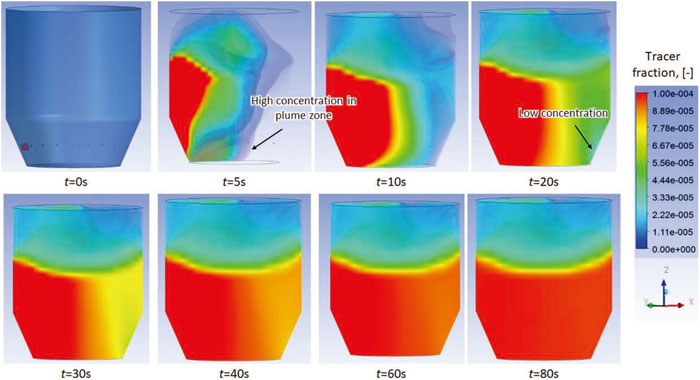
Figure 11 shows the evolution of tracer concentration from 0 to 80 seconds in the bath. The simulation was performed based on the seven-tuyere AOD with the mean gas flow rate of 3.0 kg/s. In the initial stage (e.g., t = 5 s), the tracer dominantly flows along the converter wall towards the upper part. A high concentration zone of the tracer appears at the bottom of the bubble plume. A low concentration zone of the tracer appears near the wall opposite the position where the tracer was added. The mixing process is consistent with the flow pattern discussed in Figs. 5(a) and 5(d), Figs. 6(b) and 8(h). That is, the vertically downward flow drives the tracer to the bottom, while the horizontal backward flow brings the tracer to the plume zone, where the tracer is driven upward by the rising flow, further participating in the entire bath circulation. From t = 10 s, the tracer rapidly flows to the right side due to the significant stirring of the plume cluster, but a slow mixing zone still appears in the right bottom corner of the sidewall, where the tracer concentration is low until t = 60 s.
The mixing time is typically defined as the time at which all the local concentrations of the tracer reach a level within 5% deviation of the equilibrium value; namely, the ratio of the local concentration to the equilibrium value ranges between 0.95 and 1.05.40) Figure 12 shows the normalized tracer concentration over time for the seven detectors. Obviously, the position of the detectors has a crucial influence on the mixing time. The presence of the main circulation in the bulk liquid bath (see Fig. 6) does not extend the mixing time as shown in Detector 7, which suggests that the main circulation facilitates the bath mixing. Detectors 1 and 5 take the longest time to reach homogeneous mixing, meaning they are the most crucial mixing points under the present blowing condition. Another significant phenomenon observed is that although the tracer was just placed above Detector 5, the mixing time was not reduced by such an operation. It even takes a longer time than Detector 1 to reach mixing equilibrium, suggesting that the poor mixing zone (dead zone) is somewhat unaffected by the position of the tracer addition.
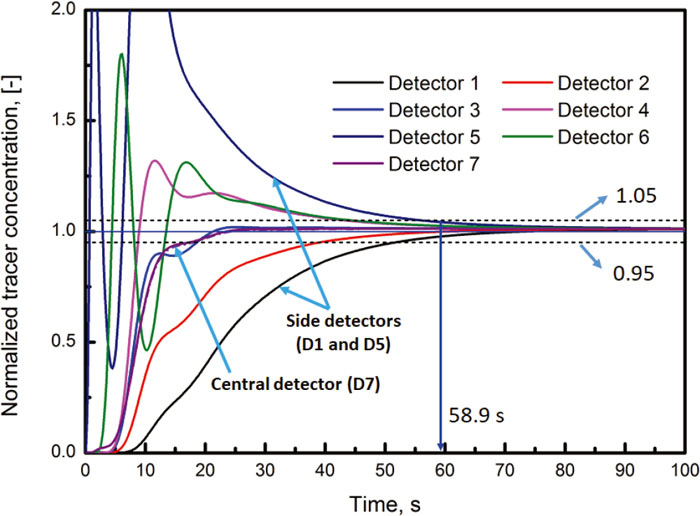
Figure 13 shows the influence of tuyere configuration and mean gas flow rate on the mixing time in the AOD reactor. Overall, with increasing gas flow rate, the mixing time first decreases and then increases. A higher gas flow rate could decelerate the mixing process of the reactors. The mixing time of the six-tuyere AOD minimizes at mean gas flow rate of 2.59 kg/s, and that of the seven-tuyere AOD minimizes at 3.0 kg/s, respectively. For a low gas flow rate, the mixing time of the six-tuyere AOD is shorter than that of the seven-tuyere AOD, indicating that the six-tuyere AOD has a higher mixing efficiency at a low gas flow rate. For a high gas flow rate (above 2.59 kg/s), the seven-tuyere AOD has a higher mixing rate. Although the model did not directly consider the metallurgical reactions, the present study provides an in-depth analysis of the flow characteristics and mixing efficiency, bringing insights to optimize the AOD process. These findings can be further extended to investigate the gas-metal thermochemical reactions in an AOD converter.

In industrial practice, high-chromium steel melts in AOD converters are decarburized by injecting oxygen and inert gas through side tuyeres to target the content of all required components and homogenize the molten bath. The main research interest is to optimize the process variables to improve productivity and decrease energy consumption and operating costs, which requires a deep understanding of the multiphase flow phenomena in the AOD converter process. The present study elucidated the multiphase flow behavior and mixing characteristics in the AOD converter process, and the process variables under various tuyere configurations were optimized. The generated knowledge can be used to optimize the AOD operational practice in terms of bath mixing efficiency, e.g., for high gas flow rates, the seven-tuyere AOD has a higher mixing efficiency than the six-tuyere AOD. This model can be extended in the future to directly simulate the evolution of chemical reactions in the AOD converter by coupling the multiphase flow model with high-temperature thermodynamic databases.
4. Conclusion
A computational fluid dynamics model for the multi-tuyere injection AOD process was developed based on the 3D Eulerian multiphase flow approach. The influence of the tuyere configuration and the gas flow rate on the flow characteristics and mixing behavior was investigated, and the optimized process parameters have been proposed for maximizing the bath mixing efficiency. The main conclusions can be drawn as follows:
(1) For the multi-tuyere injection AOD system, the merging of the bubble plume occurs in the upper part of the molten bath, forming the typical plume cluster. For a given l gas flow rate, the six-tuyere AOD has a larger stirring height than the seven-tuyere AOD.
(2) The predicted penetration length of the single tuyere jet agrees well with that of Hoefele and Brimacombe’s model.20) The gas jets of the multi-tuyere system significantly influence each other. The side jets penetrate deeper than the inside jets.
(3) A clockwise main circulation and an anticlockwise corner circulation in the vertical planes were predicted for the six-tuyere AOD and the seven-tuyere AOD. Meanwhile, two typical side vortices appear in the horizontal sections and penetrate through the molten bath. The six-tuyere AOD has a good flow condition in the center of the liquid bath, and the seven-tuyere AOD has a better flow pattern in the side wall zone and the lower part of the steel bath.
(4) The worst mixing zone (dead zone) is located in the bottom corner close to the sidewall opposite the tuyere rather than in the center of the bulk liquid. Overall, for a high gas flow rate (above 2.59 kg/s), the seven-tuyere AOD has a better mixing performance than the six-tuyere scheme. The optimized gas supply rates for the six-tuyere AOD and the seven-tuyere AOD are 2.59 kg/s and 3.0 kg/s, respectively. Further work is needed to apply the present model for the gas-metal reactions in the AOD converter.
Acknowledgments
The authors gratefully acknowledge support for this research by Aperam S.A.
References
- 1) J. H. Wei, H. L. Zhu, H. B. Chi and H. J. Wang: ISIJ Int., 50 (2010), 17. https://doi.org/10.2355/isijinternational.50.17
- 2) J. H. Wei, H. L. Zhu, H. B. Chi and H. J. Wang: ISIJ Int., 50 (2010), 26. https://doi.org/10.2355/isijinternational.50.26
- 3) H. J. Odenthal, U. Thiedemann, U. Falkenreck and J. Schlueter: Metall. Mater. Trans. B, 41 (2010), 396. https://doi.org/10.1007/s11663-009-9335-y
- 4) P. Ternstedt, P. Ni, N. Lundqvist, A. Tilliander and P. G. Jönsson: Ironmaking Steelmaking, 45 (2018), 944. https://doi.org/10.1080/03019233.2017.1415012
- 5) R. M. Figueira and J. Szekely: Metall. Trans. B, 16 (1985), 67. https://doi.org/10.1007/BF02657490
- 6) M. Bjurström, A. Tilliander, M. Iguchi and P. G. Jönsson: ISIJ Int., 46 (2006), 523. https://doi.org/10.2355/isijinternational.46.523
- 7) T. M. J. Fabritius, P. T. Kurkinen, P. T. Mure and J. J. Härkki: Ironmaking Steelmaking, 32 (2005), 113. https://doi.org/10.1179/174328105X28775
- 8) T. M. J. Fabritius, P. T. Mure and J. J. Härkki: ISIJ Int., 43 (2003), 1177. https://doi.org/10.2355/isijinternational.43.1177
- 9) N. Lundkvist, P. Ni, M. Iguchi, A. Tilliander and P. G. Jönsson: Steel Res. Int., 89 (2018), 1700536. https://doi.org/10.1002/srin.201700536
- 10) M. Y. Zhu, I. Sawada and M. Iguchi: ISIJ Int., 38 (1998), 411. https://doi.org/10.2355/isijinternational.38.411
- 11) P. Gittler, R. Kickinger, S. Pirker, E. Fuhrmann, J. Lehner and J. Steins: Scand. J. Metall., 29 (2000), 166. https://doi.org/10.1034/j.1600-0692.2000.d01-20.x
- 12) M. Ersson and A. Tilliander: Steel Res. Int., 89 (2018), 1700108. https://doi.org/10.1002/srin.201700108
- 13) A. Tilliander, T. L. I. Jonsson and P. G. Jönsson: ISIJ Int., 44 (2004), 326. https://doi.org/10.2355/isijinternational.44.326
- 14) A. Tilliander, T. L. I. Jonsson and P. G. Jönsson: ISIJ Int., 41 (2001), 1156. https://doi.org/10.2355/isijinternational.41.1156
- 15) A. Tilliander, P. G. Jönsson, T. L. I. Jonsson and S. Lille: Iron Steelmaker, 29 (2002), 51.
- 16) A. Tilliander, T. L. I. Jonsson and P. G. Jönsson: Steel Res. Int., 85 (2014), 376. https://doi.org/10.1002/srin.201300065
- 17) J. H. Wei, Y. He and G. M. Shi: Steel Res. Int., 82 (2011), 693. https://doi.org/10.1002/srin.201000279
- 18) J. H. Wei, Y. He and G. M. Shi: Steel Res. Int., 82 (2011), 703. https://doi.org/10.1002/srin.201000278
- 19) N. Huda, J. Naser, G. Brooks, M. A. Reuter and R. Matusewicz: Metall. Mater. Trans. B, 43 (2012), 39. https://doi.org/10.1007/s11663-011-9558-6
- 20) E. O. Hoefele and J. K. Brimacombe: Metall. Trans. B, 10 (1979), 631. https://doi.org/10.1007/BF02662566
- 21) S. Chanouian, B. Ahlin, A. Tilliander and M. Ersson: Steel Res. Int., 92 (2021), 2100044. https://doi.org/10.1002/srin.202100044
- 22) S. E. Elghobashi and M. A. Rizk: Int. J. Multiph. Flow, 15 (1989), 119. https://doi.org/10.1016/0301-9322(89)90089-X
- 23) Y. Sato, M. Sadatomi and K. Sekoguchi: Int. J. Multiph. Flow, 7 (1981), 167. https://doi.org/10.1016/0301-9322(81)90003-3
- 24) H. A. Jakobsen, B. H. Sannæs, S. Grevskott and H. F. Svendsen: Ind. Eng. Chem. Res., 36 (1997), 4052. https://doi.org/10.1021/ie970276o
- 25) L. Schiller and A. Naumann: Z. Ver. Deutsch. Ing., 77 (1933), 318 (in Japanese).
- 26) F. Oeters: Metallurgy of Steelmaking, Verlag Stahleisen GmbH, Düsseldorf, (1994), 238.
- 27) D. A. Drew and R. T. Lahey: Particulate Two-Phase Flow, Butterworth-Heinemann, Boston, (1993), 509.
- 28) M. L. de Bertodano, R. T. Lahey, Jr. and O. C. Jones: Int. J. Multiph. Flow, 20 (1994), 805. https://doi.org/10.1016/0301-9322(94)90095-7
- 29) J. T. Kuo and G. B. Wallis: Int. J. Multiph. Flow, 14 (1988), 547. https://doi.org/10.1016/0301-9322(88)90057-2
- 30) H. F. Svendsen, H. A. Jakobsen and R. Torvik: Chem. Eng. Sci., 47 (1992), 3297. https://doi.org/10.1016/0009-2509(92)85038-D
- 31) D. A. Drew and R. T. Lahey, Jr.: Int. J. Multiph. Flow, 13 (1987), 113. https://doi.org/10.1016/0301-9322(87)90011-5
- 32) Z. Liu, L. Li, F. Qi, B. Li, M. Jiang and F. Tsukihashi: Metall. Mater. Trans. B, 46 (2015), 406. https://doi.org/10.1007/s11663-014-0192-y
- 33) N. Huda, J. Naser, G. Brooks, M. A. Reuter and R. Matusewicz: Metall. Mater. Trans. B, 41 (2010), 35. https://doi.org/10.1007/s11663-009-9316-1
- 34) F. Fluent: FLUENT 19.0 User’s Guide, Fluent Inc., Lebanon, NH, (2018), 615.
- 35) E. Krepper, D. Lucas and H. Prasser: Nucl. Eng. Des., 235 (2005), 597. https://doi.org/10.1016/j.nucengdes.2004.09.006
- 36) F. M. White: Viscous Fluid Flow (3rd ed.), McGraw-Hill, New York, (2005), 28.
- 37) N. Huda, J. Naser, G. A. Brooks, M. A. Reuter and R. W. Matusewicz: Metall. Mater. Trans. B, 43 (2012), 1054. https://doi.org/10.1007/s11663-012-9686-7
- 38) R. Hong, H. Li, H. Li and Y. Wang: Powder Technol., 92 (1997), 205. https://doi.org/10.1016/S0032-5910(97)03238-5
- 39) T. Li, K. Pougatch, M. Salcudean and D. Grecov: Powder Technol., 184 (2008), 89. https://doi.org/10.1016/j.powtec.2007.08.007
- 40) K. Y. Chu, H. H. Chen, P. H. Lai, H. C. Wu, Y. C. Liu, C. C. Lin and M. J. Lu: Metall. Mater. Trans. B, 47 (2016), 948. https://doi.org/10.1007/s11663-016-0593-1

