Abstract
Estimation of changes in the composition and physical properties of mold flux during continuous casting was investigated for control of slab surface quality. In this study, 0.7 mass% Al steel and normal Al-killed steel were cast with three kinds of mold flux having Al2O3 contents of 1.3 to 6.0 mass% and different basicities. The results can be summarized as follows:
(1) The Al2O3 content of these mold fluxes increased to 30 mass% during continuous casting. The composition change of the mold flux can be reproduced by the Equilibrium Effective Reaction Zone Model (EERZM) by fitting parameters, referring to the casting results.
(2) The analysis by EERZM revealed that the viscosity of the mold flux and the throughput of the molten steel affect the rate of increase of the Al2O3 content in the mold flux.
(3) The change of the physical properties of the mold flux was estimated based on the changes in the flux composition. The change of the crystallization temperature and main crystal can be estimated by FactSage.
(4) Mold flux viscosity can be estimated by revising the modified Iida’s equation, which considers the effect of Al2O3 as an amphoteric oxide.
1. Introduction
Mold flux plays several important roles in the continuous casting of steel, including (1) heat insulation of the molten steel, (2) prevention of reoxidation of the molten steel, (3) adsorption of inclusions, (4) slow cooling of the solidified shell, Fand (5) ensuring the lubricity of the mold and solidified shell.1,2,3) In order to produce high-quality slabs and realize stable production, it is extremely important to design and use the optimum mold flux that can fulfill these roles based on the molten steel composition and casting conditions. Although a mold flux with appropriate properties based on the molten steel composition and casting conditions is generally designed and used, even mold fluxes with appropriate properties may cause operational problems. For example, the composition change3,4,5,6,7,8,9,10,11,12,13) that occurs in the mold flux during casting of high alloy steels such as high Al, high Mn, and Ti steel is an example of this problem.
Composition change of mold flux during casting of high alloy steel is reportedly caused by the redox reaction between molten steel and mold flux.3,4,5,6,7,8,9) Mold flux generally contains a certain amount of SiO2, but elements such as Al, Mn and Ti in high alloy steels reduce the SiO2 in the mold flux, causing remarkable changes in the composition of the mold flux. As a result, the properties of the mold flux change greatly as continuous casting proceeds, and casting becomes unstable, causing various types of trouble and defects.3,4,5,6,9) Therefore, it is important to grasp the composition change of mold flux during casting in order to improve the quality and casting stability of high alloy steels (high Al, high Mn and high Ti steel).
Here, the mechanism of casting instability during casting of the above-mentioned high alloy steels will be explained by referring to the case of high Al steel. During casting of high Al steel, the redox reaction of Si and Al between the molten steel and the mold flux proceeds as shown by formula (1).
|
4A
l
in molten steel
+3Si
O
2 in mold flux
→3S
i
in molten steel
+2A
l
2
O
3 in mold flux
| (1) |
The concentration of SiO
2 in the mold flux is greatly decreased by this reaction, while the concentration of Al
2O
3 is greatly increased, and the composition and basicity of the mold flux change significantly. It has been reported that the Al
2O
3 concentration in the mold flux increases from less than 5 mass% to a maximum of about 35 mass%, while the SiO
2 concentration decreases from more than 40 mass% to about 20 mass% during the casting of high Al steel.
3,4,5,6) Since SiO
2 is the main component of mold flux and is also a critical factor in the network of the molten oxide, which has a large influence on the properties of the mold flux, this change in the SiO
2 content causes significant changes in the crystallization temperature and viscosity, which are important properties for casting stability. In this case, the inflow of mold flux between the solidified shell and mold becomes nonuniform, a large depression is generated, and as a result, cracks and breakout (BO), which is a particularly serious problem, may occur.
3,4,5,6,9)
In this report, test casting and measurement of the mold flux properties were carried out, and the validity of the following items was verified in order to prevent instability when casting high alloy steels.
• Model for estimating the composition change of mold flux during casting
• Model for estimating the change in the crystallization temperature due to composition change
• Model for estimating the change in viscosity due to composition change
The object of this study was the mold flux used in continuous casting of high Al steel, in which the changes in the composition and properties of the mold flux are particularly large.
2. Experimental Method and Calculation Method
2.1. Composition Change Prediction Model
A model for predicting the compositional change of mold fluxes due to the Si–Al redox reaction between the molten steel and mold fluxes was investigated. Various models for predicting the compositional change of mold flux during casting of high Al steel have been proposed.14,15,16) In this study, the Equilibrium Effective Reaction Zone Model (EERZM),17) which combines thermodynamic calculation (FactSage) and a mixing model (ERZM: Effective Reaction Zone Model) was adopted. The EERZM model is a combined thermodynamic calculation (FactSage) and mixing model (ERZM) that was proposed by Van Ende et al.17) in order to reproduce the compositional change of mold fluxes during casting of high alloy steels.
FactSage is a software that calculates the thermodynamic equilibrium state of multicomponent systems and has functions such as calculation of the equilibrium phase diagram and alloy phase diagram of oxide systems, preparation of potential-pH diagrams, prediction of the viscosity of molten slag glass and preparation of a thermodynamic database.
The mixing model (ERZM) is a simple model that simulates the reaction rate and mass transfer by mixing between zones.18,19,20) In this model, the reaction region near the interface of two phases is divided into multiple zones, where the equilibrium reaction between each zone is calculated, and then the reaction rate and mass transfer are simulated by mixing. At this time, the reaction rate of the interfacial reaction and the degree of mass transfer in each phase are simulated by changing the thickness (volume) of each zone. Although the model considers only the equilibrium reaction, it is possible to reproduce compositional changes considering the reaction rate and mass transfer.
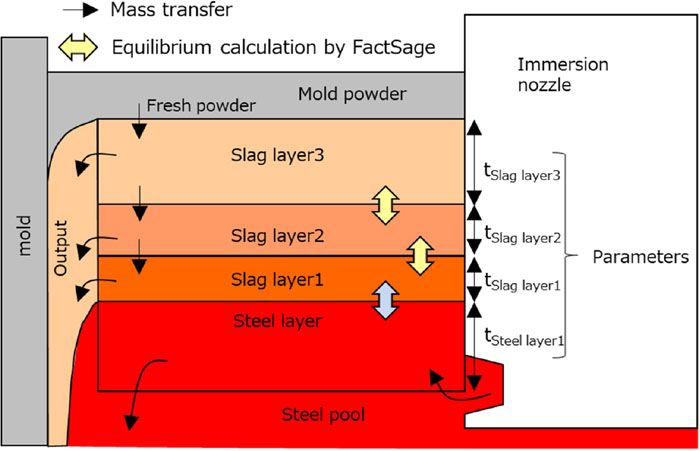
Figure 1 shows a schematic diagram17) of the mold flux composition change prediction model used in this study. In this model, the molten mold flux is divided into three layers, Slag layer 1, Slag layer 2 and Slag layer 3, and the molten steel is treated as one layer, i.e., the Steel layer. The reaction rate of the reaction between the molten steel and mold flux and the mass transfer in the mold flux are simulated by changing the thicknesses of these layers, as described above. That is, the thicknesses of each layer are the parameters of this model.
The model assumptions are as follows.
• The temperature of the molten steel layer (Steel layer) and that of the mold flux layer in contact with the molten steel layer (Slag layer 1) are the same.
• All the mold fluxes fed into the system flow in a molten state.
• The outflow of the mold flux from the system is the same as the mold flux consumption and flows out from each layer according to the thickness of each layer.
• The size of each Slag layer and the Steel layer are the same as the thickness and width of the mold.
• The thickness of each slag layer and steel layer during casting is constant.
• Both solid and liquid phases are considered in the equilibrium calculation.
• The overall thickness of the slag layer in the model is the same as the thickness of the molten mold flux layer during casting.
Here, the calculation procedure will be explained briefly. First, the equilibrium reaction between the molten steel and the mold flux layer adjacent to the molten steel (i.e., between the Steel layer and Slag layer 1) is calculated. Then, the inflow and outflow of material from Slag layer 1 to Slag layer 3 are calculated in order. At this time, the outflow amount of each layer is obtained by multiplying the mold flux consumption by the ratio of the thickness of each layer to the thickness of the entire molten mold flux layer, and the same amount as the outflow amount of each layer flows in from the upper layer. In the case of Slag layer 3, the amount of influx of mold flux used in Slag layer 3 is the same as the mold flux consumption. Finally, adjacent slag layers each mix 50% of each layer. The average composition of the entire mold flux at this time is output as a result. These calculation procedures are performed repeatedly as 1 step, and 1 step is assumed to be completed in 1 min. The calculation conditions are shown in Table 1. The temperature was assumed to be constant for each layer, all inclusions were assumed to be Al2O3, and a constant amount was assumed to flow from the molten steel into the mold flux.
Table 1. Calculation condition.
| Temperature of layer | Steel layer Slag layer1 | 1550°C |
| Slag layer2 | 1500°C |
| Slag layer3 | 1450°C |
| Inclusion | Concentration of Al2O3 | 20 ppm |
| Removal rate | 15% |
Table 2 shows the test casting conditions. Middle carbon-0.7 mass% Al steel, Al-killed ultra-low carbon steel and low carbon steel were cast. Three fluxes (Flux A, Flux B and Flux E) with different basicities and properties were used as the mold fluxes. The throughput index ITP was set to be different in each case, and was obtained by indexing the molten steel flow rate RSteel-Mold flux to the mold flux flow rate for each case, with Case 1 defined as 1. The molten steel flow rate RSteel-Mold flux is expressed by formula (2).
|
R
Steel-Mold flux
=
Q
Steel
Q
Mold flux
=
ρ×
V
c
×
t
slab
×
w
slab
C
Mold flux
×
V
c
×2×(
t
slab
+
w
slab
)
| (2) |
R
Steel-Mold flux [t/kg]: molten steel flow rate relative to the mold flux flow rate, Q
Steel [t/min]: molten steel flow rate (= throughput), Q
Mold flux [kg/min]: mold flux flow rate,
ρ [t/m
3]: molten steel density, V
c [m/min]: casting speed, t
slab [m]: slab thickness, w
slab [m]: slab width, C
Mold flux [kg/m
2]: mold flux consumption
Table 2. Casting conditions.
| Casel | Case2 | Case3 | Case4 |
|---|
| Steel composition [mass%] | C | 0.17 | 0.002 | 0.02 |
| Al | 0.7 | 0.04 | 0.02 |
| Mold flux | Flux A | Flux B | Flux E |
| Original composition of Al2O3 [mass%] | 1.3 | 1.6 | 6.0 |
| Basicity T.CaO/SiO2 [-] | 0.6 | 1.2 | 0.7 |
| Viscosity at 1573 K [poise] | 1.7 | 0.9 | 4.0 |
| Crystallization Temperature [°C] | 860 | 1130 | 960 |
| Casting machine | X | Y |
| Casting velocity Vc [m/min] | 1.0 | 0.8 | 1.8 | 1.6 |
| Slab thickness tslab [mm] | 235 | 260 |
| Slab width Wslab [mm] | 1450 | 1500 | 1615 |
| ITP [-] | 1.0 | 0.81 | 1.60 | 1.79 |
For the results of the Al2O3 concentration change in test casting under these conditions, the thicknesses of each layer (tSlag layer1, tSlag layer2, tSlag layer3, tSteel layer), which are model parameters, were changed variously, and tuning was carried out.
2.2. Property Estimation Model
A method for estimating the properties of the mold fluxes such as the crystallization temperature and viscosity, which greatly affect the stability of casting, was investigated.
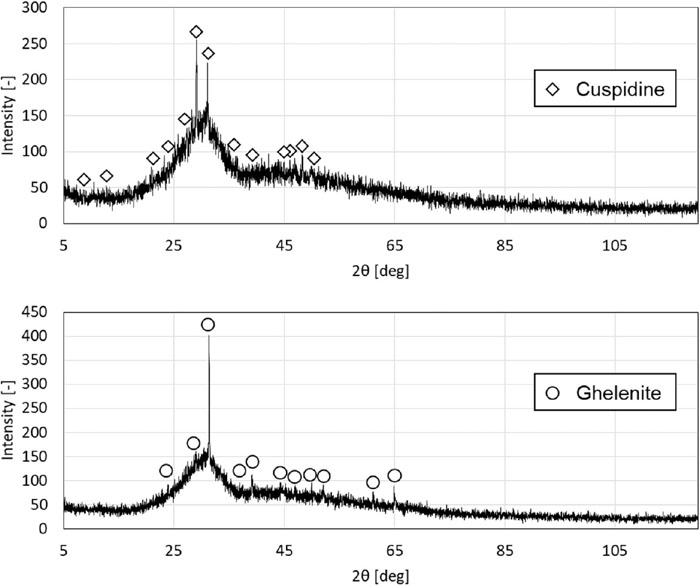
The composition and properties of the mold fluxes used in this study are shown in Table 3. Fluxes B to D with different basicities and mold fluxes simulating the increase of the Al2O3 concentration in each mold flux were used. FactSage was used to estimate the flux properties. The crystallization temperature was the highest temperature at which a solid phase existed, and the main crystal species was the solid phase existing at the crystallization temperature. The viscosity of the slag at 1573 K for each composition was calculated by using the Viscosity module of FactSage. Each property of the mold flux was measured as follows. The main crystal species were identified by powder X-ray diffraction (XRD) on samples obtained by quenching molten mold flux with a water-cooled copper plate. The crystallization temperature was measured with a differential scanning calorimeter (DSC) under cooling conditions of 1300°C to 4°C/min. Viscosity was measured at 1573 K by using a rotating viscometer.
Table 3. Compositions and measured characteristics of mold fluxes.
| Composition [mass%] | T.CaO/SiO2 [-] | Viscosity [poise] | Crystallization temperature [°C] |
|---|
| Al2O3 |
|---|
| B | 1.6 | 1.2 | 0.9 | 1130 |
| B-10 | 11.3 | 1.49 | 1.3 | 1000 |
| B-20 | 20.7 | 2.12 | 1.8 | 1130 |
| B-30 | 29.5 | 3.45 | 2.7 | 1160 |
| C | 1.6 | 1.4 | 0.7 | 1145 |
| C-10 | 11.3 | 1.78 | 0.9 | 1020 |
| C-20 | 20.7 | 2.72 | 1.2 | 1150 |
| C-25 | 25.1 | 3.54 | 1.7 | 1200 |
| C-30 | 29.5 | 5.13 | 2.3 | 1245 |
| D | 9.5 | 1.81 | 0.8 | 1030 |
| D-10 | 19.3 | 2.78 | 1.0 | 1150 |
| D-15 | 24.1 | 3.78 | 1.1 | 1165 |
| D-22 | 31.3 | 7.77 | 1.1 | 1200 |
| D-27 | 34.5 | 7.79 | 1.5 | 1255 |
3. Experimental and Computational Results
3.1. Composition Change Prediction Model
Figure 2 shows the results of the Al2O3 concentration changes in the mold flux during test casting. In Case 1 and Case 2, where the Al concentration in the molten steel was high, the Al2O3 concentration in the mold flux changed greatly during casting. The concentration of Al2O3 in the mold flux was the highest in Case 2 using the high basicity Flux B, and the concentration of Al2O3 rose to about 30 mass%. The Al2O3 concentration in the mold flux increased to about 5 mass% even in Case 3 and Case 4, where the Al concentration in the molten steel was low.
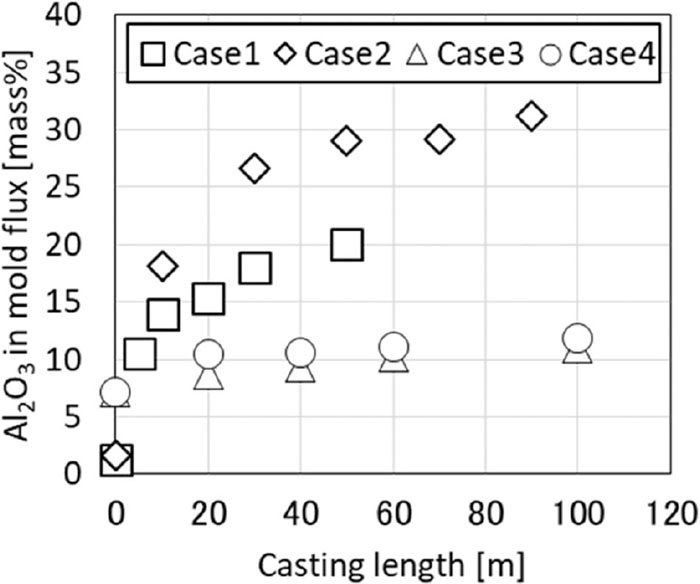
Figure 3 shows the results of tuning the model parameters against the actual changes in the Al2O3 concentration in Fig. 2. The actual Al2O3 concentration change during test casting could be reproduced by setting specific parameters in each case. Table 4 shows the model parameters that reproduced the actual changes in the Al2O3 concentration in each case. Here, the model parameters rSteel layer, rSlag layer 1, rSlag layer 2, and rSlag layer 3 are the ratio of the thickness of each layer to the thickness tTotal slag layer of the entire molten mold flux layer (formulas (3) and (4)).
|
r
i
=
t
i
t
total slag layer
i=Steel layer, Slag layer1, Slag layer2, Slag layer3
| (3) |
|
t
Total slag layer
=
t
Slag layer1
+
t
Slag layer2
+
t
Slag layer3
| (4) |
r
i [-]: ratio of the thickness of each layer to the thickness of the entire mold flux layer, t
i [mm]: thickness of each layer, t
Total layer [mm]: thickness of the entire mold flux layer
Table 4. Casting condition and model parameters.
| Casel | Case2 | Case3 | Case4 |
|---|
| Flux | Flux A | Flux B | Flux E |
| Viscosity [poise] | 1.7 | 0.9 | 4.0 |
| ITP [-] | 1.0 | 0.81 | 1.60 | 1.79 |
| rSlag layer3 [-] | 0.5 | 0.3 | 0.53 | 0.53 |
| rSlag layer2 [-] | 0.3 | 0.1 | 0.43 | 0.43 |
| rSlag layerl [-] | 0.2 | 0.6 | 0.03 | 0.03 |
| rSteel layer [-] | 0.5 | 0.4 | 1.5 | 2.5 |
As shown in Table 4, the model parameters were different in each case. The differences in the model parameters between the cases are considered to be due to the differences in the mold flux properties and the throughput of molten steel. The relationship between the viscosity of the initial composition of the mold flux and rSlag layer1 and the relationship between the throughput index ITP and rSteel layer are shown in Fig. 4. It can be understood that the thickness of Slag layer 1 decreases as the viscosity of the initial composition increases, and the thickness of the Steel layer increases as the throughput index increases.
3.2. Property Estimation Model
The results of estimating the main crystal species and crystallization temperature with FactSage are shown in Table 5, Figs. 5 and 6. The main crystal species estimated by FactSage agreed with the observed main crystal species. As for the crystallization temperature, although the average of the absolute value of the difference between the measured value and the estimated value was as large as about 50°C for the whole subject mold flux, the trend of the crystallization temperature with respect to the change in the Al2O3 concentration roughly agreed with the measured values for all mold fluxes.
Table 5. Comparison of main crystal estimated by FactSage to measured main crystal.
| Flux | Composition [mass%] | T.CaO/SiO2 [-] | Measured main crystal | Main crystal calculated by FactSage |
|---|
| Al2O3 |
|---|
| B | 1.6 | 1.2 | Cuspidine | Cuspidine |
| B-10 | 11.3 | 1.49 | Cuspidine | Cuspidine |
| B-20 | 20.7 | 2.12 | Ghelenite | Ghelenite |
| B-30 | 29.5 | 3.45 | Ghelenite | Ghelenite |
| C | 1.6 | 1.4 | Cuspidine | Cuspidine |
| C-10 | 11.3 | 1.78 | Cuspidine | Cuspidine |
| C-20 | 20.7 | 2.72 | Mayenite | Mayenite |
| C-25 | 25.1 | 3.54 | Mayenite | Mayenite |
| C-30 | 29.5 | 5.13 | Mayenite | Mayenite |
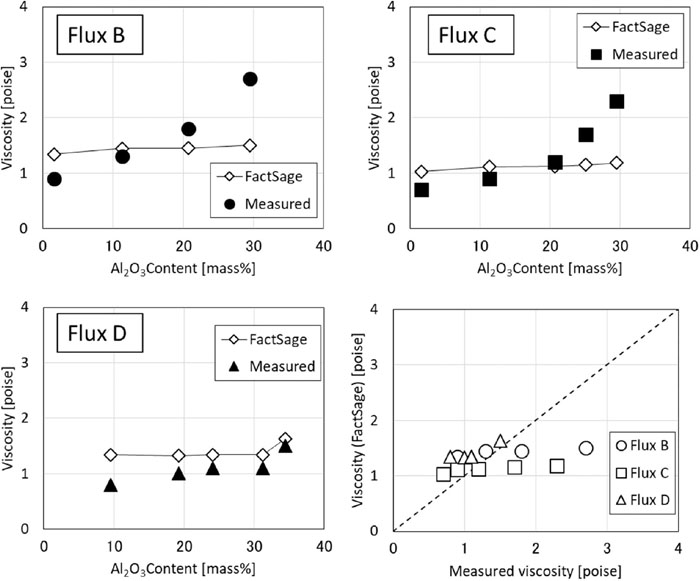
The results of the viscosity estimation using FactSage are shown in Fig. 7. As can be seen from the graph, the tendency of viscosity to change depending on the Al2O3 concentration did not agree with the measured value. In particular, in the region where the Al2O3 concentration is 25 mass% or more, the deviation between the measured value and the estimated value calculated with FactSage is large. It is thought that this difference occurred because the contribution of amphoteric oxide Al2O3 to basicity in the region of high Al2O3 concentration and high basicity could not be reproduced sufficiently by FactSage.
4. Discussion
4.1. Relationship between Mold Flux Properties, Casting Conditions and Model Parameters
As shown in Fig. 4, there was a correlation between the viscosity of the initial composition of the mold flux and rSlag layer1 and between the throughput index ITP and rSteel layer.
First, the relationship between the viscosity of the initial composition of the mold flux and the thickness of Slag layer 1 will be discussed. This relationship may be related to the mass transfer of Al2O3 in the mold flux. Figure 8 shows the estimated mechanism of the influence of the viscosity of the initial composition of the mold flux on the thickness of Slag layer 1, taking Case 1 and Case 2 with a small difference in throughput index ITP as examples. The mass transfer of Al2O3 in the molten mold flux B is qualitatively faster than that in Flux A because Flux B has a lower initial viscosity and thus is more susceptible to thermal convection and agitation. Therefore, in Flux B, Al2O3 is more likely to move upward in the mold flux, and the concentration of Al2O3 near the molten steel-mold flux interface decreases. As a result, the redox reaction (reaction shown by formula (1)) at the molten steel-mold flux interface is promoted, and the Al2O3 concentration in the mold flux increases. In the present model, the upward movement of Al2O3 corresponds to the larger thickness of Slag layer 1, which is adjacent to the molten steel-mold flux interface. Therefore, it is considered that the thickness of Slag layer 1 is larger in Case 2 using Flux B due to its low viscosity initial composition.

Next, the relationship between the throughput index ITP and the thickness of the steel layer will be considered. This relationship is considered to be related to the renewal rate of the molten steel. The estimated mechanism of the effect of the throughput index ITP on the thickness of the steel layer is shown in Fig. 9. Because a large throughput index ITP means that the renewal rate of the molten steel is high, and the amount of molten steel reacting with the mold flux per unit time also increases, this condition corresponds to a large thickness of the steel layer in this model. Therefore, in the casting condition where the throughput index ITP is large, the thickness of the steel layer in this model is considered to be large.

From the above discussion, a correlation is considered to exist between the model parameters Slag layer 1 and the viscosity of the initial composition of the mold flux and between the viscosity of the initial composition of the mold flux and the throughput index ITP, and the viscosity of the initial composition of the mold flux and the throughput (molten steel flow rate) have a large influence on the acceleration of the increase in the Al2O3 concentration in the mold flux. It is also considered possible to determine these model parameters from the casting conditions and mold flux properties by using the relationship in Fig. 4.
4.2. Application of Viscosity Estimation Equation
As shown in Fig. 7, the calculated viscosity obtained using FactSage did not agree with the measured viscosity. Therefore, a viscosity estimation equation proposed in the past was applied to verify whether the tendency of the measured value could be reproduced.
Although various viscosity estimation equations for molten oxide have been proposed,21,22,23,24,25,26,27,28,29,30) their use is limited to the composition region employed in the derivation, and their accuracy decreases significantly outside that composition region. These viscosity estimation equations in the ROUND ROBIN project (1997–2000),31) and the report indicated that the modified Iida’s equation30) and the Ribould equation23) have high estimation accuracy for mold flux for continuous casting of steel. Among the equations examined in the project, the modified Iida’s equation is the most accurate and is suitable for viscosity estimation over a wide range of Al2O3 concentrations, as it can consider the change in the behavior of amphoteric oxides with composition and basicity. The modified Iida’s equation is expressed by Eqs. (5), (6), (7), (8), (9), (10).
|
μ
calc
=A
μ
0
exp(
E
B
i
(
j
)
)
| (5) |
|
Bi=
∑
(
α
i
W
i
)
B
+∑
(
α
i
W
i
)
Am2
∑
(
α
i
W
i
)
A
+∑
(
α
i
W
i
)
Am1
| (7) |
|
B
i
(
j
)
=
∑
(
α
i
W
i
)
B
+∑
(
α
i
*
W
i
)
Am2
∑
(
α
i
W
i
)
A
+∑
(
α
i
*
W
i
)
Am1
| (8) |
|
A=1.029-2.078×
10
-3
T+1.050×
10
-6
T
2
| (9) |
|
E=28.46-2.0884×
10
-2
T+4.000×
10
-6
T
2
| (10) |
[Pa·sec]: estimated viscosity, A, E [-]: constants,
μ0 [Pa·sec]: viscosity of virtual monomolecular melt,
μ0i [Pa·sec]: viscosity of virtual melt of each oxide component, Bi [-]: basicity index,
αi [-]: specific coefficient of each oxide, W
i [mass%]: mass percent of each oxide, Bi
(j) [-]: modified basicity index, j [-]: number of modified specific coefficients,
α*
i [-]: modified specific coefficient, T [K]: temperature
In the modified Iida’s equation, the relationship between the composition and the viscosity of the molten oxide can be corrected by the measured data. Specifically, the specific coefficient αi of the amphoteric oxide is not a constant value, but a function α*i of the mass percent Wi of the amphoteric oxide, and the basicity index Bi is fitted so that the error between the estimated viscosity μcalc and the measured viscosity is minimized.
Iida et al. proposed α*Al2O3 as a linear function for mold flux for continuous casting based on viscosity measurement data in the Al2O3 concentration range of less than 12 mass%.30) In the present study, accurate estimation to a higher Al2O3 concentration range was necessary, so the function form of α*Al2O3 was also examined. Here, the data in Table 3 were used as the viscosity measurement data for correction, and values found in the literature were used for μ0i and αi.30) As a result of this examination, the specific coefficient α*Al2O3 of Al2O3 was obtained as a cubic function (Eq. (11)) of the following Wi and Bi.
|
a
Al2O3
*
=1.37Bi-2.27×
10
-1
B
i
2
+1.15×
10
-2
B
i
3
-4.07×
10
-1
W
Al2O3
+1.84×
10
-2
W
A
l
2
O
3
2
-2.6×
10
-4
W
A
l
2
O
3
3
+1.98
| (11) |
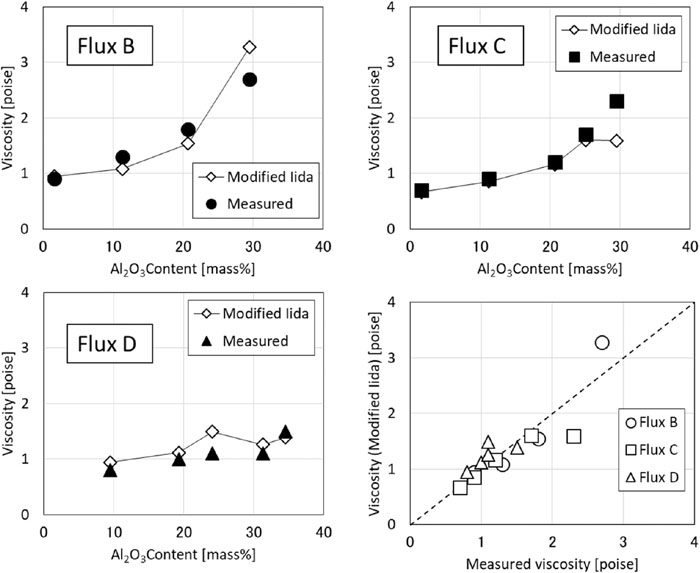
Figure 10 shows the estimation results of the modified Iida’s equation using Eq. (11). As can be seen from the graph, the estimated value obtained by the modified Iida’s equation is different from the value estimated by FactSage and can reproduce the tendency of viscosity with respect to the changes in the Al2O3 concentration. This is thought to be possible because the tendency of the specific coefficient of Al2O3, which changes with the basicity and the Al2O3 concentration, can be reproduced. Therefore, use of Eq. (11) enables an accurate estimation of the viscosity of the mold flux during casting of a high Al steel, in which the Al2O3 concentration varies greatly.
5. Conclusion
For the purpose of stable continuous casting of high alloy steels, a method for predicting the changes in the composition and properties of the mold flux during casting of high Al steel was evaluated, and the following findings were obtained.
(1) Three kinds of mold fluxes with different Al2O3 concentrations (1.3 to 6.0 mass%) and basicities were applied to 0.7 mass% Al steel and normal Al killed steel. The reduction of the oxide in the mold flux by [Al] in the steel during casting increased the Al2O3 concentration in the mold flux up to about 30 mass%. The composition changes that occur during casting were reproduced by the compositional variation model EERZM (Equilibrium Effective Reaction Zone Model).
(2) An examination of the relationship between the obtained model parameters (Slag layer, Steel layer thickness, etc.), casting conditions and physical properties of the mold flux revealed that the viscosity of the mold flux and the throughput of the molten steel (molten steel flow rate) greatly affect the acceleration of the Al2O3 concentration increase in the mold flux.
(3) The main crystal and the crystallization temperature were estimated by using the thermodynamic software FactSage. The estimated main crystal species agreed with the measured result, and the error between the estimated value and the measured value of the crystallization temperature was about 50°C. The change of the main crystal and crystallization temperature with the changes in the Al2O3 concentration in the mold flux could also be estimated.
(4) Although the change of viscosity in response to the change of the Al2O3 concentration in the mold flux could not be estimated by FactSage, the change in viscosity with the change in the Al2O3 concentration was successfully estimated by using the modified Iida’s equation, which considers the changes in the basic behavior of amphoteric oxides depending on composition, after correcting the equation with viscosity measurement data for mold fluxes with Al2O3 concentrations ranging from 1.6 mass% to 34.5 mass%.
References
- 1) K. C. Mills and A. B. Fox: ISIJ Int., 43 (2003), 1479. https://doi.org/10.2355/isijinternational.43.1479
- 2) K. C. Mills: ISIJ Int., 56 (2016), 1. https://doi.org/10.2355/isijinternational.ISIJINT-2015-231
- 3) K. C. Mills: ISIJ Int., 56 (2016), 14. https://doi.org/10.2355/isijinternational.ISIJINT-2015-355
- 4) T. Miyake, J. Yoshida and T. Mimura: Proc. 13th China-Japan Symp. on Science and Technology of Iron and Steel, The Chinese Society for Metals, Beijing, (2013), 171.
- 5) J. Rudnizki, R. Shepherd, E. Balichev, S. Karrasch and F. Kruger: Proc. 8th European Continuous Casting Conf. (ECCC), ASMET, Leoben, (2014), 1013.
- 6) W. Wang, B. Lu and D. Xiao: Metall. Mater. Trans. B, 47 (2016), 384. https://doi.org/10.1007/s11663-015-0474-z
- 7) J.-W. Cho, S. Yoo, M.-S. Park, J.-K. Park and K.-H. Moon: Metall. Mater. Trans. B, 48 (2017), 187. https://doi.org/10.1007/s11663-016-0818-3
- 8) M.-S. Kim, M.-S. Park, S.-E. Kang, J.-K. Park and Y.-B. Kang: ISIJ Int., 58 (2018), 686. https://doi.org/10.2355/isijinternational.ISIJINT-2017-603
- 9) S. He, Z. Li, Z. Chen, T. Wu and Q. Wang: Steel Res. Int., 90 (2019), 1800424. https://doi.org/10.1002/srin.201800424
- 10) K. Watanabe, H. Takahashi, A. Kiyose and K. Miyazawa: CAMP-ISIJ, 8 (1995), 160 (in Japanese).
- 11) A. Kiyose, H. Goto, K. Miyazawa, K. Watanabe, H. Takahashi and W. Yamada: CAMP-ISIJ, 8 (1995), 161 (in Japanese).
- 12) H. Nishikawa, I. Kimura, H. Bada, S. Moriwaki, N. Otani and F. Sudo: Tetsu-to-Hagané, 70 (1984), S927 (in Japanese). https://doi.org/10.2355/tetsutohagane1955.70.12_S923
- 13) T. Kishi, H. Tsuboi, H. Takeuchi, T. Nakano, M. Yamamiya and T. Ando: Seitetsu Kenkyu, (1987), No. 324, 10 (in Japanese).
- 14) Q. Wang, S. Qiu and P. Zhao: Metall. Mater. Trans. B, 43 (2012), 424. https://doi.org/10.1007/s11663-011-9600-8
- 15) Y.-B. Kang, M.-S. Kim, S.-W. Lee, J.-W. Cho, M.-S. Park and H.-G. Lee: Metall. Mater. Trans. B, 44 (2013), 309. https://doi.org/10.1007/s11663-012-9769-5
- 16) M.-S. Kim and Y.-B. Kang: Calphad, 61 (2018), 105. https://doi.org/10.1016/j.calphad.2018.02.010
- 17) M.-A. Van Ende and I.-H. Jung: ISIJ Int., 54 (2014), 489. https://doi.org/10.2355/isijinternational.54.489
- 18) Y. Hsieh, Y. Watanabe, S. Asai and I. Muchi: Tetsu-to-Hagané, 69 (1983), 596 (in Japanese). https://doi.org/10.2355/tetsutohagane1955.69.6_596
- 19) R. Ding, B. Blanpain, P. T. Jones and P. Wollants: Metall. Mater. Trans. B, 31 (2000), 197. https://doi.org/10.1007/s11663-000-0145-5
- 20) M.-A. van Ende, Y.-M. Kim, M.-K. Cho, J. Choi and I.-H. Jung: Metall. Mater. Trans. B, 42 (2011), 477. https://doi.org/10.1007/s11663-011-9495-4
- 21) K. Nakajima, H. Mizukami, M. Kawamoto and Z. Morita: Tetsu-to-Hagané, 80 (1994), 509 (in Japanese). https://doi.org/10.2355/tetsutohagane1955.80.7_509
- 22) M. Kosaka and S. Minowa: Tetsu-to-Hagané, 52 (1966), 1039 (in Japanese). https://doi.org/10.2355/tetsutohagane1955.52.7_1039
- 23) P. V. Riboud, Y. Roux, L.-D. Lucas and H. Gaye: Fachber. Huettenprax. Metallweiterverarb., 19 (1981), 859.
- 24) M. D. Lanyi and C. J. Rosa: Ironmaking Steelmaking, 9 (1982), 25.
- 25) K. Koyama, Y. Nagano and T. Nakano: Seitetsu Kenkyu, (1987), No. 324, 39.
- 26) M. Hanao, M. Kawamoto, T. Tanaka and M. Nakamoto: ISIJ Int., 46 (2006), 346. https://doi.org/10.2355/isijinternational.46.346
- 27) E. Benavidez, L. Santini, M. Valentini and E. Brandaleze: Procedia Mater. Sci., 1 (2012), 389. https://doi.org/10.1016/j.mspro.2012.06.052
- 28) X. Qi, G.-H. Wen and P. Tang: J. Iron Steel Res. Int., 17 (2010), 6. https://doi.org/10.1016/S1006-706X(10)60105-7
- 29) Z. Zhang, G. Wen, P. Tang and S. Sridhar: ISIJ Int., 48 (2008), 739. https://doi.org/10.2355/isijinternational.48.739
- 30) T. Iida: Estimation of Viscosities of Slags and Glasses, AGNE Gijutsu Center, Tokyo, (2003), 121 (in Japanese).
- 31) K. C. Mills, L. Chapman, A. B. Fox and S. Sridhar: Scand. J. Metall., 30 (2001), 396. https://doi.org/10.1034/j.1600-0692.2001.300608.x