Abstract
In response to the frequent problem of inconsistent quality of billet castings and their rolled products from each strand by a five-strand tundish, the flow field in tundish is optimized by presenting new flow control devices and conducting isothermal physical modelling along with numerical simulation. The results show that the dead volume fraction of the optimized case A6 is reduced from 27.74% to 19%, the stagnation time is prolonged from 12 s to 35 s, and the flow dynamic consistency for each strand is improved as well. In the subsequent industry production tests, the temperature difference of molten steel at the outlet of each strand is reduced to 1–5°C. The maximum difference of the as-cast equiaxed crystal rate among five strands is reduced from 5.67% to 2.7%, and the consistency of carbon segregation index is also improved with a basically identical appearance through the billet cross section. The maximum differences in oxygen and nitrogen contents for the rolled products of all strands are 2.7 ppm and 5.7 ppm respectively, which are lower than 5.0 ppm and 13.8 ppm before tundish optimization. The yield strength of rolled products is stabilized with much less divergence as compared to the products with the original tundish. Thus, it is believed that the reasonable flow field optimization to a multi-strand tundish not only will have a well-known positive impact on its tranditional metallurgical effect, but also may bring out an approaching identical steel quality from the same caster as we expected.
1. Introduction
The tundish is a buffer vessel connecting the ladle and the continuous casting mold, which plays a critical role in distributing molten steel to each strand equally, removing large-sized inclusions from molten steel, and stabilizing the quality of the casting billet.1,2,3) In order to exert the metallurgical function of the tundish, many approaches have been proposed, such as the application of channel-type induction heating,4,5,6) the control of the multiphase flow in tundish during ladle exchange,7,8) the development of an innovative ladle shroud9,10) and optimization of the flow control devices in tundishes.11,12,13,14,15) The study of tundish is usually carried out by using physical modeling and/or numerical simulation16,17,18,19) methods to obtain the expected structure of tundish, then it is applied to industrial practice. This is frequently proved to be effective. Tang et al.20) optimized a four-strand tundish through the above methods. After being applied in the steel production, the number of micro-inclusion and macro-inclusion in the billet castings was reduced by 2.7% and 44.9%, respectively, compared with that before optimization. Chen et al.21) also optimized the flow field of a two-strand tundish for slab casting. The total oxygen content of the slab castings dropped by 30.32% after applying the optimized tundish.
With the increasing demand for steel cleanliness and homogenization with less difference in strand to strand, improving the consistency of the metallurgical effect for a multi-strand tundish and the stability of its overall product quality has become a hot topic in recent years.14) Reasonable structure of the flow control device in tundish is expected to supply a homogeneous flow and thermal state of the molten steel to each strand, which should be beneficial to reduce the difference in the temperature and chemistry of molten steel among different strands from the very beginning of casting, even with an extending residence time of molten steel in the tundish for better inclusions removal, thus improving the quality of every billet strand equally.22,23) However, most of the present studies are based on the general criteria of reducing the dead volume fraction and prolonging the average residence time and stagnation time, which is suitable for the tundish with a small number of strands. For the multi-strand tundishes, such as 5 to 8 strands, or even 12 strands, large differences in the flow and temperature distribution of molten steel between the edge strands and the middle strands can easily occur due to its long and narrow inner geometry, then resulting in an inconsistent casting superheat and cleanliness of molten steel for each strand.24,25,26) Therefore, it is crucial to improve the consistency among strands for multi-strand tundishes.
The present work focuses on a five-strand T-shaped tundish adopted in the Xining Special Steel of China. During the original casting process, it was observed that the color of billet from the middle strand (No. 3 strand) in the second cooling zone was brighter as compared with the other strands. Also, the carbon loss of molten steel was found being larger during casting while with the original flow control tundish, and the mechanical properties of the following products are not consistent from different strands together with an irregular carbon segregation pattern. These problems have been proved in production with big data relating closely to the flow field in the tundish. For this reason, this study proposes an optimal flow control device through physical modeling along with numerical simulation method. While the optimized scheme was applied to the industrial tests, the temperature difference of the molten steel, and the quality index of billet castings and rolled products including oxygen and nitrogen contents, solidified microstructure and the mechanical properties, were compared in detail before and after optimization, and a surprising positive improvement effect was achieved in the consistence and stability of quality for billet castings and the subsequent rolled products.
2. Physical Modelling
2.1. Principles and Methods
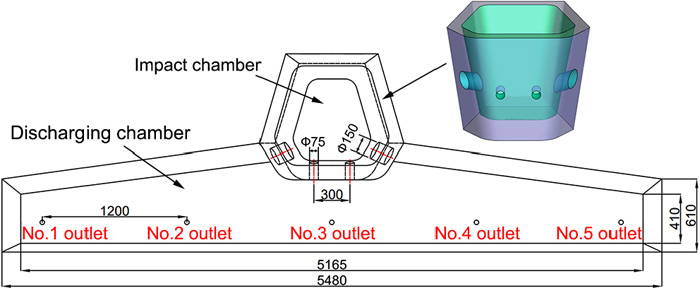
The physical modeling experiments were designed based on the similarity principles. To ensure the geometrical similarity between the water model and the tundish prototype, the geometric similarity scale is designed as 1:2.5 (model: prototype). The structure of prototype tundish and flow control device is shown in Fig. 1, and their operation parameters are listed in Table 1.
Table 1. Operation parameters of prototype and model tundish.
| Parameters | Prototype | Model |
|---|
| Depth of liquid (mm) | 750 | 300 |
| Diameter of long shroud (mm) | 70 | 28 |
| Submerged depth of shroud (mm) | 200 | 80 |
| Flow rate of single strand (L/min) | 48.8 | 4.9 |
The Reynold number (Re) and Froud number (Fr) of the prototype and the model need to keep equal according to the dynamic similarity. Since the flow in a tundish is Froud dominated,27) it is only necessary to ensure that the Fr of both equal:
where
Q is the volume flow rate, L/min;
λ is the similarity scale; subscript m and p denote model and prototype, respectively.
The stimulus-response method28) was used in physical modeling experiments. After the fluid flow in the model tundish was kept at stabilization, saturated KCl solution (100 mL) was injected into the model through the ladle shroud as a tracer. The variation of conductivity at each outlet of the tundish was monitored in real time by the conductivity electrodes. The conductivity curve against time (RTD curve) was obtained by a DJ800 system. Considering the symmetry of the tundish geometry, only the variation of conductivity at No. 1 to No. 3 outlets needed to be measured. In addition, ink was added to the tundish using the same method as the addition of KCl to show the flow trajectory. The RTD curves were analyzed with the mixing model proposed by Sahai et al.29) The flow characteristic parameters were calculated by the equations shown in Table 2. The standard deviations of tmin and tav among the three strands were calculated in the same way as ref. (4). A smaller standard deviation indicates a better consistency of the flow characteristics among strands.
Table 2. Calculation formula of flow characteristic parameters of molten steel in tundish.
| Parameters | Formula | Symbols |
|---|
| Theoretical mean residence time, ta, s | V/Q | V is the volume of the tundish, m3; Ci(t) is the conductivity of fluid in the No. i strand at time t, mS/cm; n is the number of measurement strands; stagnation time tmin and peak concentration time tpeak can read from the RTD curves |
| Actual mean residence time, tav, s |
∫
0
∞
t
C
i
(t)dt/
∫
0
∞
C
i
(t)dt
|
| Plug flow volume fraction, Vp, % | (tmin+tpeak)/2ta |
| Dead volume fraction, Vd, % | 1−tav/ta |
| Well-mixed volume fraction, Vm, % | 1−VP−Vd |
| Standard deviation, S, s |
[
∑
i=1
n=3
(
x
i
-
x
¯
)
2
]/(n-1)
|
| Overall RTD curve, E(θ) |
t
a
×
∑
n=1
5
C
i
(t)
∑
n=1
5
(
∫
0
∞
C
i
(t)dt
)
|
The flow control device of prototype case A0 has been shown in Fig. 1. The molten steel flows into the distribution chamber through the diversion holes in the wall. Due to the orientation and location of the diversion holes at the front wall, there may be a short-circuit flow at No. 3 outlet. As shown in Fig. 2, a new retaining wall structure is proposed for the possibly existing problems according to the analysis of the prototype structure. The purpose of the new design is to avoid the formation of short-circuit flow at No. 3 outlet and activate the flow field in the area between each outlet. In the physical experiments, a total of 17 cases were performed and each case was repeated 3 times. Here, only 7 representative cases are given and compared with the prototype case A0. The parameters of each case are shown in Table 3.
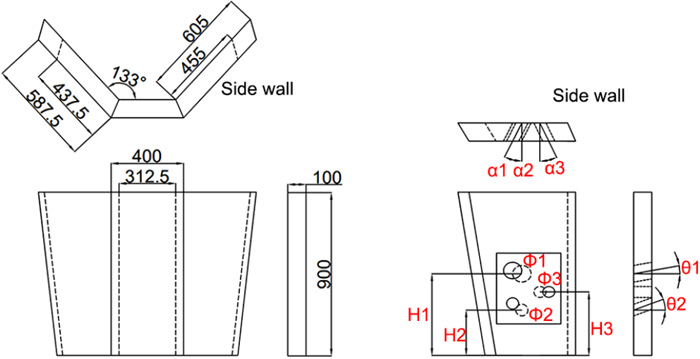
Table 3. Parameters of designed physical modeling case.
| Case | Diameter (mm) | Hight (mm) | Inclination angle (°) | Deflection angle (°) |
|---|
| Φ1 | Φ2 | Φ3 | H1 | H2 | H3 | θ1 | θ2 | α1 | α2 | α3 |
|---|
| A1 | 90 | 60 | 60 | 450 | 250 | 350 | 10 | 20 | 27 | 27 | −26a) |
| A2 | 90 | 80 | 60 | 450 | 250 | 350 | 10 | 20 | 27 | 27 | −26 |
| A3 | 80 | 80 | 60 | 450 | 250 | 350 | 10 | 20 | 27 | 27 | −26 |
| A4 | 80 | 80 | – | 450 | 250 | – | 10 | 20 | 27 | −30 | – |
| A5 | 90 | 80 | – | 450 | 250 | – | 10 | 20 | 27 | −30 | – |
| A6 | 90 | 70 | – | 450 | 250 | – | 10 | 20 | 27 | −30 | – |
| A7 | 80 | 80 | – | 450 | 250 | – | 10 | 20 | −30 | 27 | – |
a) − represents a counterclockwise direction.
As can be seen from the flow characteristic parameters listed in Table 4, the stagnation time and peak concentration time of three outlets in case A0 are significantly different. The stagnation time of No. 1 outlet and No. 2 outlet are 54 s and 35 s, and the peak concentration time are 125 s and 135 s, respectively. The stagnation time and peak concentration time of No. 3 outlet are only 12 s and 42 s, respectively, which implies the existence of short-circuit flow. These phenomena are caused by the structure of the prototype flow control device. The No. 3 outlet is closest to the diversion holes, which causes the fluid to flow directly out of No. 3 outlet, so its stagnation time is short and the concentration of tracer reaches peak value quickly. In addition, the fluid needs to move a longer distance to reach the No. 1 outlet due to the farther distance from the diversion holes, the stagnation time of No. 1 outlet is the longest. The dead volume fraction of case A0 is 27.74%. The large proportion of dead volume indicates that the fluid flows slowly in some areas of the tundish, which is not conducive to the collision and aggregation of non-metallic inclusions in molten steel. The standard deviation of the stagnation time among the three outlets is 21.05 s, which indicates that the consistency is poor. The same rules can be visualized from the RTD curves directly.
Table 4. Flow characteristic parameters of each experimental case.
| Case | Outlet | tav (s) | tmin (s) | tpeak (s) | Vd (%) | Vp (%) | Vm (%) | Stmin (s) | Stav (s) |
|---|
| A0 | No. 1 | 348 | 54 | 125 | 27.74 | 15.65 | 56.61 | 21.05 | 4.85 |
| No. 2 | 346 | 35 | 135 |
| No. 3 | 339 | 12 | 42 |
| Totala) | 345 | 12 | 138 |
| A1 | No. 1 | 383 | 52 | 71 | 21.84 | 20.82 | 57.34 | 12.83 | 6.85 |
| No. 2 | 388 | 44 | 183 |
| No. 3 | 396 | 27 | 156 |
| Total | 388 | 34 | 173 |
| A2 | No. 1 | 382 | 49 | 90 | 21.43 | 17.34 | 61.23 | 8.79 | 17.14 |
| No. 2 | 385 | 46 | 71 |
| No. 3 | 413 | 33 | 191 |
| Total | 390 | 37 | 135 |
| A3 | No. 1 | 385 | 50 | 74 | 21.24 | 21.73 | 57.04 | 14.74 | 5.15 |
| No. 2 | 395 | 44 | 174 |
| No. 3 | 392 | 22 | 35 |
| Total | 391 | 26 | 190 |
| A4 | No. 1 | 406 | 56 | 171 | 20.45 | 20.32 | 59.23 | 10.61 | 20.30 |
| No. 2 | 397 | 51 | 176 |
| No. 3 | 368 | 36 | 89 |
| Total | 394 | 31 | 171 |
| A5 | No. 1 | 409 | 64 | 178 | 19.74 | 21.83 | 58.43 | 14.68 | 16.23 |
| No. 2 | 400 | 41 | 147 |
| No. 3 | 377 | 37 | 117 |
| Total | 398 | 39 | 178 |
| A6 | No. 1 | 398 | 39 | 104 | 19.00 | 25.51 | 55.49 | 2.36 | 4.97 |
| No. 2 | 402 | 35 | 218 |
| No. 3 | 408 | 36 | 197 |
| Total | 402 | 35 | 218 |
| A7 | No. 1 | 387 | 48 | 125 | 24.42 | 15.33 | 60.25 | 11.79 | 15.98 |
| No. 2 | 373 | 38 | 124 |
| No. 3 | 355 | 24 | 152 |
| Total | 375 | 27 | 125 |
a) Total
tav, Total
tmin and Total
tpeak are obtained from the overall RTD curve, the formulars are listed in
Table 2.
The RTD curves of each case are shown in Fig. 3, where the abscissa represents the dimensionless time and the ordinate the dimensionless concentration. It can be seen from it that the stagnation time and the peak concentration time of No. 3 outlet in case A0 are the shortest, explaining that the short-circuit flow is formed after the fluid enters the tundish and the fluid flows out from No. 3 outlet directly. In this case, the inclusions in the molten steel flow into the continuous casting mold from the submerged nozzle before they float up, so that the number of inclusions in the billet of No. 3 strand may be more than in other strands. Meanwhile, it is shown that the RTD curves of the three outlets do not have a high coincidence, which means that there will be a certain difference in the temperature and composition of the molten steel among strands.
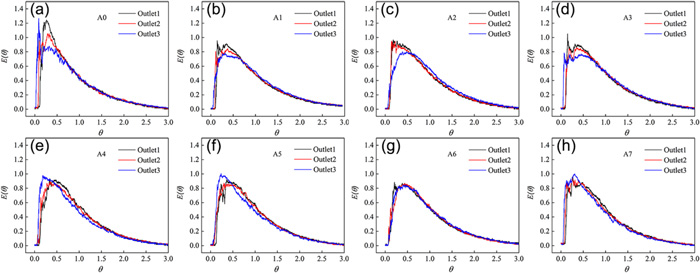
By comparing the flow characteristic parameters and RTD curves of each case, it is found that cases A1–A7 achieve obvious optimization effects after using the new retaining wall. In cases A1–A3, there are three diversion holes in the side wall as shown in Fig. 2 and Table 3. The purpose is to activate the flow field in the area between No. 2 and No. 3 outlet and reduce the dead volume fraction. It can be seen from Table 4 that the dead volume fraction in cases A1–A3 are all reduced to below 22%, indicating that the design idea has achieved the expected effect. In cases A1–A3, the stagnation time of No. 1 outlet and No. 2 outlet is between 44 s and 52 s, while that of No. 3 outlet is between 22 s and 33 s. There is still a certain difference in the stagnation time of each strand due to the close distance between the diversion hole and No. 3 outlet. Therefore, although the three-hole schemes reduce the dead volume fraction, it does not completely solve the problem of the fast response of No. 3 outlet.
In cases A4–A7, two diversion holes are set in the side wall, and they point to the area between the outlets. The flow characteristics of fluid is adjusted by controlling the diameter and deflection of the holes, so the flow field in the entire tundish can be activated as much as possible. The stagnation time of the No. 3 outlets in cases A4–A6 is extended to about 37 s, and the dead volume fraction is reduced to below 21%. Additionally, the standard deviation of the stagnation time is also reduced, which is a further improvement compared with the previous cases. However, the stagnation time of the No. 3 outlet in case A7 is only 24 s, and the dead volume fraction is larger than that of other optimization cases, which is 24.42%.
By contrast, case A6 has the best optimization effect among all cases. The two diversion holes of case A6 are arranged vertically in the side wall, and their dimensions and angles are shown in Table 3. Compared with the prototype case A0, case A6 increases the total average residence time by 57 s and the stagnation time by 23 s. The longer the molten steel stays in the tundish, the more conducive to the floating of inclusions and the uniformity of its composition and temperature. The standard deviations of the average residence time and the stagnation time of this case are only 4.97 s and 2.36 s, respectively, which are much smaller than those of case A0. It can also be seen from the RTD curves of case A6 that the three curves are in excellent agreement, which indicates that the consistency among strands has been significantly improved. The dead volume fraction is reduced to 19%, which is 8.74% lower than case A0. A lower dead volume fraction means that the flow field in the entire tundish is more active, which is conducive to the mixing of molten steel and increase of the utilization rate of tundish volume.
Figure 4(a) shows the trajectory of the ink tracer in case A0. At 10 s, the tracer starts to move along the surface after coming out from the diversion holes. At 35 s, the tracer has flowed out from the No. 3 outlet and a large part of the tracer moved to the side area of tundish. At 50 s, the tracer has flowed out from No. 1 outlet. The trajectory of the tracer directly verifies that the consistency of case A0 among strands is poor. Meanwhile, it is also observed that there is a dead zone between No. 2 outlet and No. 3 outlet as marked in red spot circle, where the fluid flows slowly and is not easy to mix. In Fig. 4(b), At 10 s, after coming out from the diversion holes, the tracer spreads to the side region of tundish along the liquid surface. From 35 s to 50 s, the tracer moves to the area between the outlets and flows out of the three outlets almost at the same time. At 60 s, the whole area of the tundish is completely mixed.

To sum up, A6 is the best optimized case. The stagnation time of each outlet in case A6 is similar, which means that the consistency among strands has been significantly improved. The dead volume fraction is reduced, the fluid in the area between No. 2 outlet and No. 3 outlet has been activated. It can also be verified from the RTD curves that they are smooth and fit well, indicating that the flow field in case A6 is more homogeneous than other cases.
3. Numerical Simulation
The numerical simulation method is widely used in the optimization of tundish, and the authors have also conducted an abundance of research works on this topic.14,19,20,25,26) The same simulation methods and principles were adopted in this paper to calculate the flow field and temperature filed of molten steel in the prototype and optimized tundish. The main governing equations30,31,32) are given in Table 5. In the simulation process, one half of the tundish was taken into consideration for its symmetry geometry. The following assumptions were made for simulation calculation: the density of molten steel is constant and does not change with temperature; the influence of slag layer on flowing was ignored; the slag-steel surface was treated as a free surface.
Table 5. Governing equations of the mathematical model.
| Governing equations | Symbols |
|---|
1. Continuity equation
∂(ρ
v
j
)
∂
x
j
=0
| ρ is density of molten steel, vi (or vj) is steel velocity component. |
2. Momentum conservation equation
∂(ρ
v
j
v
i
)
∂
x
j
=-
∂p
∂
x
i
+
∂
∂
x
j
[
μ
eff
(
∂
v
i
∂
x
j
+
∂
v
j
∂
x
i
)
]+ρ
g
i
| xi (or xj) is coordinate direction, μeff is effective kinetic viscosity, p is pressure, g is the acceleration of gravity. |
3. Turbulent equations
∂(ρk
v
j
)
∂
x
j
=
∂
∂
x
j
(
μ
t
σ
k
∂k
∂
x
j
)
+ρ
G
K
-ρε
∂(ρε
v
j
)
∂
x
j
=
∂
∂
x
j
(
μ
t
σ
ε
∂ε
∂
x
j
)
+
C
1
ε
k
ρ
G
K
-
C
2
ρ
ε
2
k
G
K
=
μ
t
ρ
∂
v
j
∂
x
i
(
∂
v
i
∂
x
j
+
∂
v
j
∂
x
i
)
μ
eff
=
μ
0
+
μ
t
=
μ
0
+ρ
C
μ
k
2
ε
C1=1.44, C2=1.92, Cμ=0.09, σK=1.0, σε=1.3 | k is turbulence kinetic energy, ε is turbulent kinetic energy dissipation rate, μ0 is the laminar viscosity, μt is the turbulent viscosity, GK is generation rate of turbulence energy, C1, C2, Cμ, σk and σε are constant. |
4. Energy equation
∂
∂
x
j
(
ρ
v
j
C
p
T
)
=
∂
∂
x
j
(
K
eff
∂T
∂
x
j
)
| T is temperature, Cp is specific heat, Keff is effective thermal conductivity. |
The velocity inlet condition was adopted to the inlet of the molten steel in tundish. The inlet temperature was set as 1800 K. The direction of velocity was perpendicular to the section of the long nozzle inlet, and its value was obtained by the size of the casting section (170 mm×170 mm) and the casting speed (1.21 m/min) according to the mass conservation. The tundish outlet was set as outflow boundary condition; the vertical gradient of all variables on the free surface was zero; the tundish wall was regarded as non-slipping condition, and the standard wall function was adopted to deal with the near wall; the heat flux of each wall was specified.33) The material parameters26) and boundary conditions of the model are shown in Table 6, where the turbulence kinetic energy and the turbulence energy dissipation rate are obtained by semi-empirical formulas34) k = 0.01v2 and ε = 2×k1.5/D, respectively (v represents the velocity of molten steel and D represents the diameter of the ladle shroud).
Table 6. Boundary conditions and materials paraments.
| Boundary condition and material parameter | Value | Boundary condition and material parameter of molten steel | Value |
|---|
| Inlet velocity (m/s) | 0.7988 | Density (kg/m3) | 7018 |
| Inlet temperature (K) | 1800 | Specific heat (J/kg/K) | 750 |
| Longitudinal wall heat flux (W/m2) | −3800 | Thermal conductivity (W/m/K) | 41 |
| Transversal wall heat flux (W/m2) | −3200 | Viscosity (kg/m/s) | 0.0061 |
| Free surface heat flux (W/m2) | −15000 | k (m2/s2) | 0.006381 |
| Bottom heat flux (W/m2) | −1400 | ε (m2/s3) | 0.01456 |
The flow and temperature distribution of molten steel in the tundish were simulated by commercial CFD software FLUENT 2020 R1. The pressure-based solver was chosen for calculation. The pressure and velocity coupling were based on the SIMPLE algorithm. The computational convergence residual is set to less than 10−6 for the energy equation and 10−4 for the other equations.
3.2. Results of Numerical Simulation
Figure 5 presents the RTD curves obtained in physical modeling and numerical simulation in case A6. It can be seen that the RTD curves predicted by numerical simulation are in good agreement with those from physical modeling, indicating that the numerical simulations are reliable.
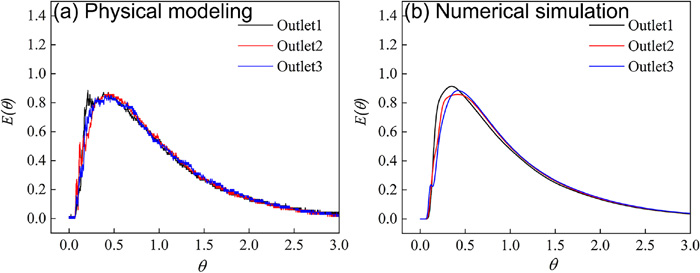
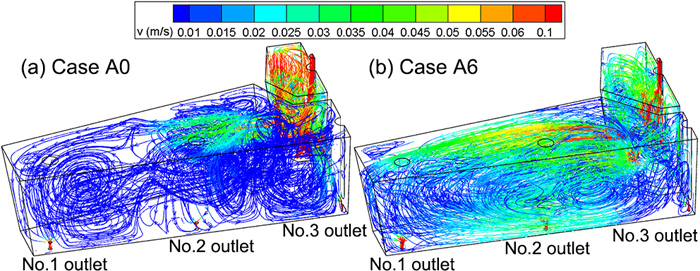
Figure 6 shows the 3D streamline of cases A0 and A6. It is seen that in case A0, the velocity of the molten steel in the tundish is slow. Due to the large diameter of the diversion hole in the side retaining wall, which is 150 mm, the molten steel does not have enough kinetic energy to flow to the side region. The molten steel tends to move downward after reaching the surface of the tundish, then it flows to the area between No. 2 and No. 3 outlets, which may lead to an uneven temperature of molten steel between the side area and the intermediate area of the tundish. The molten steel velocity near No. 3 outlet is higher than that of other outlets. It means that the molten steel flows out from the diversion hole in the front retaining wall and directly flows out of the No. 3 outlet to form a short-circuit flow. By comparison, the flow field of case A6 is more uniform, and the flow velocity is clearly intensified, due to the adoption of the optimized wall structure. Reasonable flow field is advantageous with the uniformity of molten steel composition and temperature. What’s more, the velocity of the molten steel at the tundish level in case A6 is significantly higher than that in case A0.
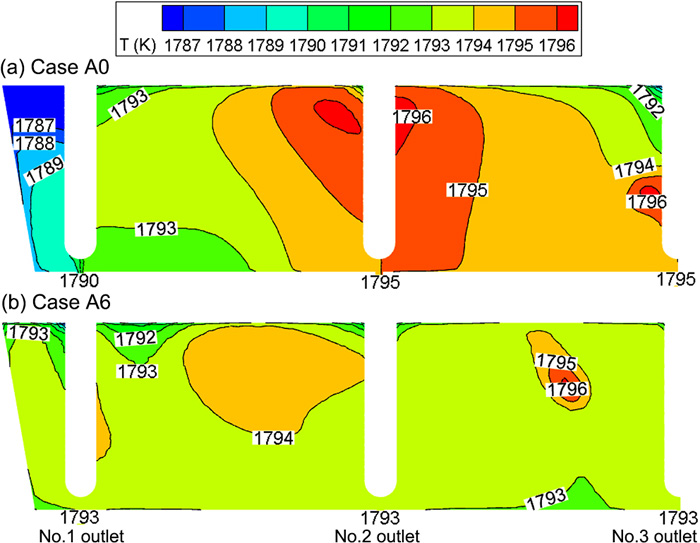
The temperature distribution of the two cases in the vertical section of the outlet center is shown in Fig. 7. The flow field in the tundish is crucial to the temperature uniformity of molten steel within. Similarly, the temperature distribution in case A6 is more homogeneous. In case A0, it is 9 K lower in the upper region near No. 1 outlet (1787 K) than the coming stream temperature (1796 K) .The maximum temperature difference between each strand outlet is 5 K. While in case A6, the maximum temperature difference in the whole section is decreased to 4 K (1796 minus 1792 K), and the original low temperature zone near No. 1 outlet disappears. The temperature of each outlet is consistent.
It is pointed out that the molten steel density varies with temperature actually, and natural convection caused by temperature difference can affect the flow behavior and velocity of the molten steel. Previous researches35,36) showed that the hotter molten steel moves upward and the cooler molten steel moves downward. When the temperature difference of molten steel in tundish is lower than ±2°C, the natural convection can be ignored.37) During the steady state casting of molten steel, the temperature difference between the molten steel flowing out of ladle shroud and that in tundish is usually smaller, thus the density of the molten steel is set as a constant. It is also verified to be generally rational by the following temperature measurement from industrial trail.
4. Industrial Trail Comparison
Based on the above modeling results, the optimized case A6 was adopted to the industrial production of HRB400E steel. The chemical composition of HRB400E is shown in the Table 7. The parameters of continuous casting process are listed in Table 8. Under the same tundish refractory materials and operating conditions, the temperature difference of the molten steel, and the quality index of the five-strand billet castings and subsequent rolled products before and after optimization were carefully surveyed and compared.
Table 7. The chemical composition of HRB400E steel. (wt%)
| C | Si | Mn | P | S |
|---|
| 0.21–0.25 | 0.53–0.55 | 1.38–1.42 | ≤0.025 | ≤0.015 |
Table 8. The parameters of continuous casting process.
| Parameter | Value |
|---|
| Liquidus temperature | 1503–1505°C |
| Superheat degree | 30–55°C for the first heat, 15–30°C for the following heats |
| Casting temperature | 1530–1560°C for the first heat, 1515–1535°C for the following heats |
| Casting speed | 1.21–2.26 m/min for the first three heats, 2.42 m/min for the following heats |
The temperature of molten steel in tundishes before and after optimization was measured. The same thermometer was inserted into the molten steel from the stopper hole, the local temperature near the outlets of No. 1 to No. 3 strands was recorded at intervals of 20 s and their maximum temperature difference was obtained accordingly. A total of 22 measurements were made before optimization and 40 measurements were made after optimization. The obtained results are shown in Fig. 8.

As can be seen from Fig. 8, before the tundish optimization, the maximum temperature difference among strands is 2–10°C, and the average temperature difference is 5.3°C. After optimization, the maximum temperature difference dropped to 1–5°C, and the average temperature difference decreased to 2.9°C accordingly, indicating that the uniformity of the temperature field in tundish had been improved. It shows that the optimization of the flow field plays an important role in improving temperature consistency. The homogeneity of the temperature field is helpful to stabilizing and unifying the superheat degree of molten steel among strands, thereby stabilizing the as-cast solidification structure of the billet castings and ensuring a close quality index of the subsequent rolled products.
4.2. Comparison of the Quality of Billets Before and After Optimization
The billet samples of five strands were cut and acid etched with a 1:1 HCl solution at 70°C for 20 minutes to compare the differences in the equiaxed crystal rate of each strand before and after tundish optimization. The results are shown in Table 9.
Table 9. Quality items of billet castings before and after optimization.
| Process | Strand | Equiaxed crystal rate (%) | Center porosity | Carbon content (%) | Carbon segregation index |
|---|
| Before optimization | 1 | 18.28 | 1.0 | 0.248–0.274 | 0.961–1.062 |
| 2 | 18.79 | 1.5 | 0.253–0.265 | 0.981–1.027 |
| 3 | 19.61 | 1.0 | 0.245–0.269 | 0.952–1.045 |
| 4 | 23.95 | 1.0 | 0.247–0.280 | 0.922–1.045 |
| 5 | 20.89 | 1.5 | 0.243–0.274 | 0.949–1.07 |
| Δmax | 5.67 | 0.5 | 0.037 | 0.148 |
| After optimization | 1 | 17.00 | 1.5 | 0.224–0.266 | 0.949–1.127 |
| 2 | 18.30 | 1.5 | 0.226–0.284 | 0.950–1.193 |
| 3 | 19.60 | 1.5 | 0.223–0.300 | 0.937–1.261 |
| 4 | 19.70 | 1.5 | 0.223–0.269 | 0.937–1.130 |
| 5 | 17.10 | 1.0 | 0.216–0.255 | 0.923–1.090 |
| Δmax | 2.70 | 0.5 | 0.084 | 0.338 |
Before optimization, the equiaxed crystal rate of each strand distributes between 18.28% and 23.95%. The difference among strands is from 0.51% to 5.67%, while it is reduced to 0.1–2.7% after optimization. The billet center porosity under two working conditions is both at 1.0–1.5, but the consistency after optimization is improved. As we know, the equiaxed crystal rate and columnar crystal rate are closely related to the superheat degree, and a lower superheat degree will lead to a more developed equiaxed crystals.38) The difference of as-cast center porosity among strands is reduced, which should give the credit to the more uniform temperature field after optimization.
After acid etching, the pieces of billet were further sampled by a ϕ5 mm drill for chemical analysis as shown in Fig. 9. A total of 9 points were drilled in the cross-section of each billet, and their carbon contents were measured by an HCS-140 infrared carbon and sulfur meter. The results are listed in Table 9.
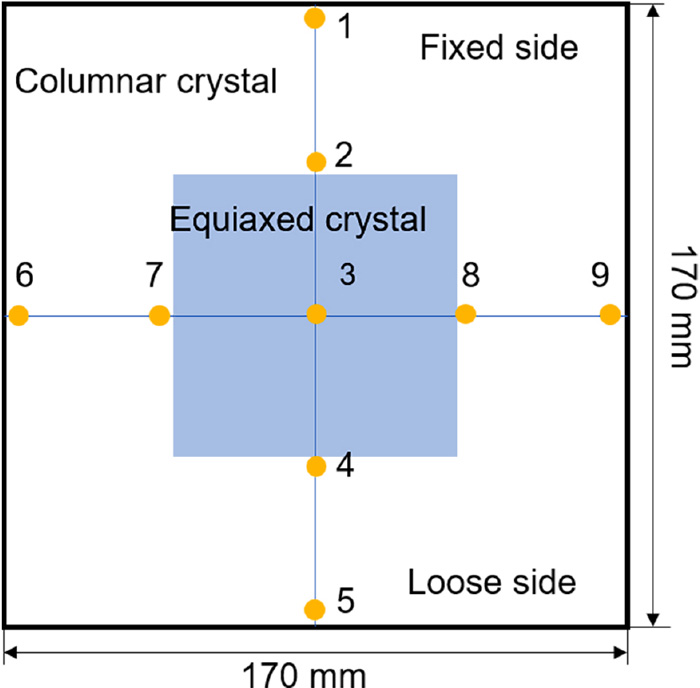
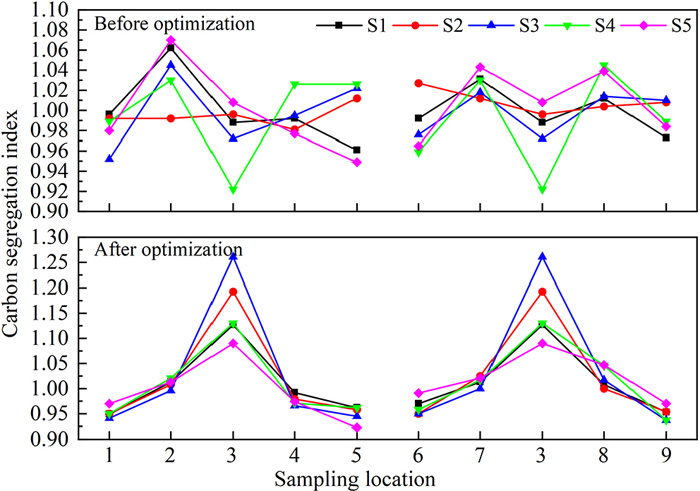
Table 9 and Fig. 10 show that the carbon segregation index across the billet section before optimization fluctuates between 0.922 and 1.07 irregularly, while it is between 0.923 and 1.261 but with an identical contour after optimization. The carbon segregation index at billet center after optimization has increased compared with that before optimization, but the consistency among strands is obviously improved. Except for the center No. 3 point, the carbon segregation index of each strand after optimization is very close, but there is a remarkable difference strand to strand before optimization. Element segregation is usually related to the as-cast structure, while the as-cast structure is closely connected to the superheat degree of molten steel.39) As mentioned above, after the optimization, the flow of molten steel in the tundish is much fairer to each strand, so its temperature distribution is also more homogeneous as measured in Fig. 8. The superheat of molten steel of each strand is at the same level, which well explains the improved solidification and segregation consistency among the five strands. The carbon segregation index of No. 3 point in S3 in Fig. 10 is obviously higher than the other strands, which may be the result of local sampling difference. It is found in practice that when drilling sample is taken from different positions in central line along casting direction, the measured carbon content varies. When it is taken from where the concentrated molten steel, the carbon content is usually higher than from the dendrite bridging area.
Rod-shaped samples were taken from the rolled products in the corresponding strand from S1 to S5 before and after tundish optimization, and the oxygen and nitrogen contents were measured by TCH600 oxygen and nitrogen analyzer. The results are shown in Fig. 11.
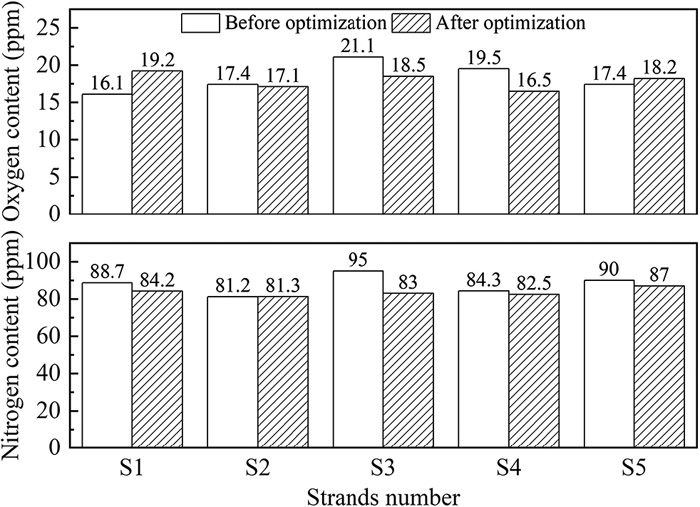
As can be seen from Fig. 11, the oxygen content of rolled products before optimization is 16.1–21.1 ppm, nitrogen content 81.2–95.0 ppm, and the maximum differences in oxygen and nitrogen contents among five strands are 5 ppm and 13.8 ppm, respectively. However, the oxygen content of the rolled products after optimization is 16.5–19.2 ppm, the nitrogen content 81.3–87.0 ppm, and the maximum difference among strands decreases to 2.7 ppm for oxygen content and 5.7 ppm for nitrogen content. It is obvious that the consistency of oxygen and nitrogen contents among strands has been improved compared with that before optimization, and the cleanliness of the steel has been significantly enhanced, characterized by the reduction in their contents. As shown above in Table 4, after tundish optimization, the stagnation time and average residence time of molten steel in the tundish was extended. Therefore, the total oxygen content of the billet is reduced by the extended time for inclusions in molten steel to float up, and the consistency of the billet quality is improved by the close residence time of molten steel and temperature at each strand.
The yield strength of rolled products was measured using a universal material testing machine WAW-Y500C. It can be read from Table 10 that the yield strength consistency of the products from different strands is similarly improved compared with that before optimization. The maximum difference in yield strength of the products is 2.0 MPa after optimization, which is lower than 5.5 MPa before optimization and reduced by 3.5 MPa. It shows that the quality of steel produced by the caster is more uniform and stable with small fluctuation after tundish optimization. It can also be noted from the table that the yield strength after optimization is 466.5–468.5 MPa, which is smaller than the value of 483.5–489 MPa before. It is thought to be possibly related to the enhanced center segregation together with less equiaxed crystal rate as shown in Fig. 10 and Table 9, but the overall yield strength fully meets the requirements of the products. Finally, it is clear to be realized from the above full process strand to strand survey, that a reasonable flow control design to a multi-strand tundish can not only reach an enhanced traditionally metallurgical effects, but also bring out a final basically identical product quality as well. What’s more, the results of industry test indicate that the isothermal physical modelling and numerical simulation still match well in the optimization of flow state of molten steel for the tundish, although the actual flow in tundish will be affected by the buoyancy-driven convection.
Table 10. The yield strength of rolled products.
| Process | Yield strength (Mpa) |
|---|
| Strand 1 | Strand 2 | Strand 3 | Strand 4 | Strand 5 | Δmax |
|---|
| Before optimization | 489 | 486 | 485.5 | 489 | 483.5 | 5.5 |
| After optimization | 466.5 | 467.5 | 468 | 467 | 468.5 | 2.0 |
5. Conclusions
To solve the frequent problem of inconsistent quality of casting billets and their rolled products among different strands produced by a five-strand tundish, the physical modelling companied by numerical simulation were first performed to optimize the metallurgical functions of the tundish. Then the optimization case A6 was applied to the industrial tests, and the temperature difference of molten steel in tundish, as well as the quality of cast billets and rolled products, were compared before and after the optimization. Through this study, the beneficial results were revealed by industry and the following main conclusions are drawn.
(1) The physical modelling experiments show that the dead volume fraction of prototype tundish is 27.74%, the total average residence time is 345 s, and total the stagnation time is only 12 s. There is a serious short-circuit flow at No. 3 outlet, and the uniformity of the flow in the tundish is poor. The dead volume fraction of the optimized case A6 is reduced to 19%. The stagnation time and the average residence time are extended to 35 s and 402 s, respectively. The RTD curves of No. 1–No. 3 outlets almost completely overlap, showing that the flow consistency of case A6 is significantly improved.
(2) The numerical simulation results show that the flow field and temperature field in the tundish of case A6 is more uniform due to the adoption of an optimized wall structure. The maximum temperature difference in the whole outlet vertical section is decreased from 9 K to 4 K and low temperature zone near No. 1 outlet disappears.
(3) The temperature difference of molten steel measured among the strands is reduced from 2–10°C to 1–5°C after tundish optimization. The maximum difference in equiaxed crystal rate among strands of the casting billets is reduced from 5.67% to 2.7% after optimization. The uniformity of carbon segregation index is also significantly improved.
(4) The oxygen and nitrogen content of the rolled products after optimization are 16.5–19.2 ppm and 81.3–87.0 ppm, respectively, which is lower than 16.1–21.1 ppm and 81.2–95.0 ppm before optimization. The consistency of mechanical properties of rolled products has also been basically reached.
To sum up, the flow field optimization of a multi-strand tundish can bring a noticeably beneficial effect to the stability and consistence of quality of its subsequent billets and rolled products among different strands, which should be paid enough attention in steel casting especially for multi-strand long product production.
Acknowledgements
The authors are greatly grateful for the funding support from National Natural Science Foundation of China (grant number 51874033) and Beijing Natural Science Foundation (grant number 2182038) to Haiyan TANG.
References
- 1) G. C. Wang, M. F. Yun, C. M. Zhang and G. D. Xiao: ISIJ Int., 55 (2015), 984. https://doi.org/10.2355/isijinternational.55.984
- 2) L. C. Zhong, L. Y. Li, B. Wang, M. F. Jiang, L. X. Zhu, L. Zhang and R. R. Chen: Steel Res. Int., 77 (2006), 103. https://doi.org/10.1002/srin.200606361
- 3) P. Y. Ni, L. T. I. Jonsson, M. Ersson and P. G. Jönsson: ISIJ Int., 57 (2017), 2175. https://doi.org/10.2355/isijinternational.ISIJINT-2017-377
- 4) H. Lei, B. Yang, Q. Bi, Y. Y. Xiao, S. F. Chen and C. Y. Ding: ISIJ Int., 59 (2019), 1811. https://doi.org/10.2355/isijinternational.ISIJINT-2019-118
- 5) B. Yang, A. Y. Deng, Y. Li and E. G. Wang: ISIJ Int., 62 (2022), 677. https://doi.org/10.2355/isijinternational.ISIJINT-2021-018
- 6) Q. Zhang, G. Y. Xu and K. Iwai: ISIJ Int., 62 (2022), 56. https://doi.org/10.2355/isijinternational.ISIJINT-2021-352
- 7) H. T. Ling, R. Xu, H. J. Wang, L. Z. Chang and S. T. Qiu: ISIJ Int., 60 (2020), 499. https://doi.org/10.2355/isijinternational.ISIJINT-2019-506
- 8) H. Zhang, Q. Fang, R. H. Luo, C. Liu, Y. Wang and H. W. Ni: Metall. Mater. Trans. B, 50 (2019), 1461. https://doi.org/10.1007/s11663-019-01572-6
- 9) F. A. Zepeda-Diaz, S. Garcia-Hernandez, J. D. J. Barreto and E. Gutierrez: ISIJ Int., 59 (2019), 51. https://doi.org/10.2355/isijinternational.ISIJINT-2018-527
- 10) J. S. Zhang, Q. Liu, S. F. Yang, Z. X. Chen, J. S. Li and Z. Y. Jiang: ISIJ Int., 59 (2019), 1167. https://doi.org/10.2355/isijinternational.ISIJINT-2019-044
- 11) T. Merder and J. Pieprzyca: Steel Res. Int., 83 (2012), 1029. https://doi.org/10.1002/srin.201200059
- 12) X. Y. Wang, D. T. Zhao, S. T. Qiu and Z. S. Zou: ISIJ Int., 57 (2017), 1990. https://doi.org/10.2355/isijinternational.ISIJINT-2017-165
- 13) W. X. Huang, S. Chang, Z. S. Zou, H. Song, Y. X. Qu, Lei Shao and B. K. Li: ISIJ Int., 62 (2022), 1439. https://doi.org/10.2355/isijinternational.ISIJINT-2021-600
- 14) W. Deng, S. Niu, E. J. Yang, D. J. Wang, K. M. Wang and H. Y. Tang: J. Iron Steel Res., 33 (2021), 1144 (in Chinese). https://doi.org/10.13228/j.boyuan.issn1001-0963.20210241
- 15) V. K. Gupta, P. K. Jha and P. K. Jain: ISIJ Int., 61 (2021), 2445. https://doi.org/10.2355/isijinternational.ISIJINT-2020-667
- 16) H. Cui, Y. Liu and D. X. Li: ISIJ Int., 55 (2015), 2604. https://doi.org/10.2355/isijinternational.ISIJINT-2015-409
- 17) C. Y. Ding, H. Lei, S. F. Chen, H. Zhang, Y. Zhao and Z. S. Zou: Steel Res. Int., 93 (2022), 2200187. https://doi.org/10.1002/srin.202200187
- 18) D. Y. Sheng: ISIJ Int., 63 (2023), 91. https://doi.org/10.2355/isijinternational.ISIJINT-2022-286
- 19) H. Y. Tang, L. Z. Guo, G. H. Wu, H. Xiao, H. Y. Yao and J. Q. Zhang: Metals, 8 (2018), 374. https://doi.org/10.3390/met8060374
- 20) H. Y. Tang, M. Yu, J. S. Li, Y. P. Bao, J. Jing, C. B. Ji and T. Li: J. Univ. Sci. Technol. Beijing, 31 (2009), 38 (in Chinese). https://doi.org/10.13374/j.issn1001-053x.2009.s1.034
- 21) Y. Chen, X. D. Ou, H. R. Wei, L. Q. Xue and P. F. Yuan: Contin. Cast., 44 (2019), 75 (in Chinese). https://doi.org/10.13228/j.boyuan.issn1005-4006.20180149
- 22) F. Xing, S. G. Zheng and M. Y. Zhu: Steel Res. Int., 89 (2018), 1700542. https://doi.org/10.1002/srin.201700542
- 23) F. He, H. J. Wang and Z. H. Zhu: ISIJ Int., 59 (2019), 1250. https://doi.org/10.2355/isijinternational.ISIJINT-2018-835
- 24) S. Chang, L. C. Zhong and Z. S. Zou: ISIJ Int., 55 (2015), 837. https://doi.org/10.2355/isijinternational.55.837
- 25) H. Y. Tang, K. M. Wang, X. S. Li, J. W. Liu and J. Q. Zhang: Metals, 11 (2021), 1075. https://doi.org/10.3390/met11071075
- 26) H. Y. Tang, X. S. Li, S. Zhang and J. Q. Zhang: Acta Metall. Sin., 56 (2020), 1629 (in Chinese). https://doi.org/10.11900/0412.1961.2020.00194
- 27) D. Mazumdar and R. I. L. Guthrie: ISIJ Int., 39 (1999), 524. https://doi.org/10.2355/isijinternational.39.524
- 28) A. Kumar, D. Mazumdar and S. C. Koria: ISIJ Int., 48 (2008), 38. https://doi.org/10.2355/isijinternational.48.38
- 29) Y. Sahai and T. Emi: ISIJ Int., 36 (1996), 667. https://doi.org/10.2355/isijinternational.36.667
- 30) X. Huang and B. G. Thomas: Can. Metall. Q., 37 (1998), 197. https://doi.org/10.1179/cmq.1998.37.3-4.197
- 31) B. G. Thomas, Q. Yuan, S. Sivaramakrishnan, T. Shi, S. P. Vanka and M. B. Assar: ISIJ Int., 41 (2001), 1262. https://doi.org/10.2355/isijinternational.41.1262
- 32) B. E. Launder and D. B. Spalding: Comput. Methods Appl. Mech. Eng., 3 (1974), 269. https://doi.org/10.1016/0045-7825(74)90029-2
- 33) S. Chakraborty and Y. Sahai: ISIJ Int., 31 (1991), 960. https://doi.org/10.2355/isijinternational.31.960
- 34) K. Y. M. Lai, M. Salcudean, S. Tanaka and R. I. L. Guthrie: Metall. Trans. B, 17 (1986), 449. https://doi.org/10.1007/BF02670209
- 35) D. Y. Sheng, C. S. Kim, J. K. Yoon and T. C. Hsiao: ISIJ Int., 38 (1998), 843. https://doi.org/10.2355/isijinternational.38.843
- 36) N. L. Cheng, M. Y. Zhu and Z. Q. Xiao: Iron and Steel, 36 (2001), 23 (in Chinese). https://doi.org/10.13228/j.boyuan.issn0449-749x.2001.10.007
- 37) S. H. Peng, J. J. Wang, S. T. Qiu and Z. Q. Xiao: J. Univ. Sci. Technol. Beijing, 28 (2006), 113. https://doi.org/10.13374/j.issn1001-053x.2006.02.027
- 38) D. W. Guo, Z. B. Hou, Z. Q. Peng, Q. Liu, Y. Chang and J. H. Cao: ISIJ Int., 61 (2021), 844. https://doi.org/10.2355/isijinternational.ISIJINT-2020-515
- 39) S. K. Choudhary and S. Ganguly: ISIJ Int., 47 (2007), 1759. https://doi.org/10.2355/isijinternational.47.1759