3. Results and Discussion
3.1. Elemental Composition of Feedstock and Their Char Samples
Table 1 shows the elemental composition of raw feedstocks and their pyrolyzed char, as well as the char yield under different temperatures. After pyrolysis of these carbonaceous feedstocks, the char samples have a significantly higher carbon content and a lower percentage of other elements, and this trend becomes more pronounced after pyrolysis at 800°C. The ultimate analysis indicates that the higher the grade of coal and the carbon content, the lower the sulfur and oxygen content. Biomass has the lowest carbon content and contains a greater amount of oxygen, because of cellulose and hemicellulose components. The yield of char decreases with increasing temperature, and more volatiles is released at higher temperatures. The higher the carbon content of the starting feedstocks is, the more char is obtained after 500°C pyrolysis. And most of the biomass decomposed at 500°C into light volatiles, and only 31.2 mass% of the biomass remained as char.
Table 1. Ultimate analysis of carbonaceous feedstocks and the pyrolyzed char, and the char yield.
| Ultimate analysis [mass%-d.a.f.] | Char yield [g/g-coal] |
|---|
| C | H | N | S+O (diff.) |
|---|
| GO coal | 86.9 | 4.9 | 1.9 | 6.2 | – |
| GO 500 | 87.7 | 4.0 | 1.8 | 6.5 | 0.949 |
| GO 800 | 93.9 | 1.1 | 1.6 | 3.3 | 0.853 |
| KP coal | 77.9 | 5.4 | 1.7 | 15.0 | – |
| KP 500 | 81.0 | 3.5 | 1.7 | 13.8 | 0.823 |
| KP 800 | 92.0 | 1.1 | 1.7 | 5.2 | 0.637 |
| LY coal | 68.6 | 5.3 | 1.3 | 24.8 | – |
| LY500 | 77.1 | 3.6 | 1.6 | 17.7 | 0.640 |
| Biomass | 51.7 | 6.7 | 0.2 | 41.5 | – |
| Biomass 500 | 81.1 | 3.6 | 0.3 | 15.0 | 0.312 |
Gas evolution during pyrolysis was measured by a quadrupole mass spectrometer (Q-MS) online. Figure 1 shows the gas evolution rate from the pyrolysis of four types of feedstocks from room temperature to 900°C. By integration, the amount of these gas components released at any temperature below 900°C can be obtained. Water vapor has two evolution peaks: one is seen around 100°C, and the other one is after 300°C. The former represents moisture from desorbed by evaporation of water in feedstock, while the latter represents water produced by pyrolysis. Only the latter peak of water was used for calculating the amount of water produced by the thermal decomposition of feedstock, called pyrolytic vapor.

The pyrolysis of caking GO coal begins to release five gas species at around 350°C. The pyrolytic vapor of GO coal was integrated from 300–500°C, accounting for 0.55 mol/kg-coal. On the other hand, the pyrolytic vapor was also integrated from 300–500°C, accounting for 2.67 mol/kg-coal from KP. It was found that the gas release from GO and KP coals continued after 500°C to produce more CO, CH4, and H2, while the lignite LY coal and biomass began pyrolysis at lower temperatures, in which the pyrolytic vapor, CO, and CO2 were released first, especially for lignite coal. LY coal has a large amount of adsorbed moisture released below 250°C. Furthermore, the release of CO and CO2 gases is seen from around 100°C evolved possibly due to the desorption and chemical reaction, according to He, et al. who have reported the similar experimental behaviors.15) The pyrolytic vapor from LY coal is 1.87 mol/kg-coal. For biomass, the pyrolytic vapor of biomass was integrated at the range of 200–500°C, accounting for 13.3 mol/kg-feedstock, which is the dominant product in this range. The decomposed water from carbonaceous samples may be attributed to the dehydration-condensation reaction of oxygen-containing functional groups and the hydrogenation-deoxygenation reaction, which reaches a maximum at around 350°C. The evolution rate of CO and CO2 reached a peak at the same time, attributed to the decomposition of oxygen-containing functional groups in cellulose and hemicellulose.
Peak evolution of H2O, CO, and CO2 from coals are clearly observed at 400–500°C. For biomass, the reactions occur at even lower temperatures (350°C). It implies that chemical structure would be largely changed in this temperature range. In 500–550°C, the evolution rates of CH4 reached the maximum, which was attributed to the decomposition of aliphatic chains such as methyl and methylene. Whereas the evolution of H2 associated with the growth of aromatic clusters begins at around 400°C for coal samples and at 550°C for biomass, but all reach the maximum at 700–800°C.
It is essential to know the gas evolution heated up to 500°C where the caking property is exhibited. Moreover, the evolution of H2 and H2O is particularly related to the fate of hydrogen, while the CO and CO2 formation are contributed to the decomposition of oxygenated groups. Table 2 shows cumulative gas evolution at 500°C. Here, the amounts of hydrogen gas and pyrolytic vapor released were used for the determination of transferable hydrogen, which would be discussed together with the changes of hydroxyl groups in the following section. Biomass starts to decompose at lower temperatures (around 200°C) and dehydrates a large amount of pyrolytic vapor, which is the main reaction of cellulose and hemicellulose in the preliminary stage of pyrolysis. LY coal and biomass released more CO and CO2 up to 500°C.
Table 2. Cumulative gas evolution during pyrolysis of GO, KP, LY coals, and biomass at 500°C.
| Gas generation amount [mol/kg-coal] |
|---|
| H2 | H2O* | CH4 | CO | CO2 |
|---|
| GO coal | 0.08 | 0.55 | 0.4 | 0.12 | 0.04 |
| KP coal | 0.08 | 2.67 | 0.61 | 0.51 | 0.52 |
| LY coal | 0.14 | 1.87 | 0.25 | 2.65 | 1.99 |
| Biomass | 0.16 | 13.30 | 0.30 | 2.53 | 2.71 |
* Cumulative H
2O of GO and KP coals is integrated at 300–500°C in order to subtract the adsorbed moisture, while cumulative H
2O of LY coal is integrated from 250 to 500°C, and biomass is between 200 and 500°C.
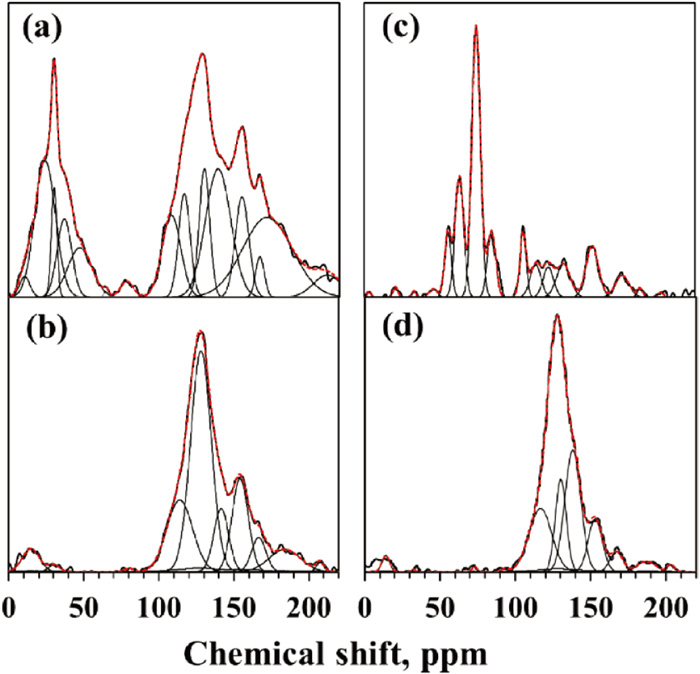
Aromatic clusters of the feedstock before and after thermal treatment were characterized by 13C and 1H NMR. Peak assignments for solid-state 13C NMR were referred to the previous studies,9,16,17) which reported a more detailed subdivision of the spectra, particularly in the sp3-hybridized carbon. The chemical shift of 13C-NMR spectra can be mainly divided into two regions: sp3-hybridized carbons at 0–90 ppm and sp2-hybridized carbons at 90–240 ppm. The sp3-hybridized carbons can be distinguished as methyl, methylene, methine, and quaternary carbon at 0–50 ppm, as well as oxy-methylene and oxy-methine at 50–90 ppm. The sp2-hybridized carbons are divided into aromatic carbons, including alkylated, protonated, non-protonated, and phenolic carbon shown in the range of 90–165 ppm, and the carboxyl and carbonyl carbon displayed in the range of 165–210 ppm.
The deconvoluted peaks for 13C NMR of carbonaceous feedstock and their char samples are shown in Figs. 2 and 3. Not only 500°C-chars but also the char of GO and KP coals treated with 800°C were characterized to investigate the effect of high-temperature treatment on coal’s structure, since these coals release large amounts of gas even at a higher temperature, as shown in Fig. 1. From 13C NMR spectra, it can be seen that the peaks at 0–90 ppm have a significant decrease after pyrolysis, especially pyrolyzed at a higher temperature. The sp3-hybridized carbons of GO and KP coals almost disappear after pyrolysis at 800°C. The methyl groups of three kinds of coal are mainly presented in the range of 0–50 ppm, which is related to the rank of the coal samples. Compared with coals, the spectra of the biomass sample showed higher intensity in the peaks between 50–90 ppm representing oxy-methylene and oxy-methine groups due to the structural properties of cellulose and hemicellulose components. Furthermore, the intensity in the region of the sp2-hybridized carbons is smaller, showing a low proportion of the aromatics in raw biomass (in Fig. 3(c)), while it increases significantly after pyrolysis. However, the abundance of oxygen-attached aliphatic carbon (around 70 ppm) in biomass almost disappeared after treatment with 500°C, attributed to the decomposition and dehydration of cellulose and hemicellulose components in pyrolysis.

From the deconvolution of 13C NMR spectra, the amount of each carbon group was evaluated based on the areas of resolved peaks by deconvoluting the spectra, shown in Table S1. The χb is the ratio of bridgehead carbon to all aromatic carbons which includes the protonated aromatic carbon (Ar–H), bridgehead carbon, and aromatic carbon with alkyl groups (Ar–C). χb is used to represent the degree of aromatization and mean aromatic cluster size. And the relationship of χb value and the C number of the aromatic cluster were proposed by Solum M. S., et al.,10) shown in Fig. 4. The χb of the carbonaceous samples increased after the pyrolysis treatment and further increased with the rise of pyrolysis temperature. The χb value of raw coal samples increased with an increase of coal rank (from lignite to bituminous coal.18) And the χb value of raw biomass is the lowest.

The condensation reaction of macromolecular structure in pyrolysis leads to the occurrence of aromatic cluster growth and the formation of hydrogen molecules. The growth of mean aromatic clusters in the carbonaceous samples can be quantified by the change in χb before and after pyrolysis. From the 13C NMR results, the value of χb can be calculated, and then the corresponding carbon number is obtained from the equation on the below of Fig. 4. The formation of hydrogen molecules is then estimated by equilibrium, which leads to the stoichiometric equations on the upper of Fig. 4. Based on the ratio of the carbon number in the aromatic cluster to the content of all Ar–C (obtained by 13C NMR), the amount of hydrogen formed by aromatic growth can also be calculated via the changed H number. In this way, the estimated hydrogen production was calculated, accounting for 4.04, 3.81, and 1.55 mmol/g-coal for GO, KP, and LY coals, respectively, which is highly related to the property of different coal ranks. Bituminous coal GO shows higher caking properties and decomposes into larger aromatics clusters, while the lower the coal quality, the less likely it is to cake. Higher temperature is also the reason for promoting agglomeration of aromatics. The formation of hydrogen from the growth of aromatic clusters in the pyrolysis of biomass was also calculated, accounting for 1.29 mmol/g-feedstock. Only lignin in biomass contains aromatic groups, while a large amount of cellulose and hemicellulose decompose into lighter volatiles during the heat treatment, and only 31.2 mass% remained as char. Therefore, biomass has less amount of hydrogen formation through the growth of aromatic clusters.
The 1H-NMR spectra for the coal and biomass samples are used to determine the hydrogen distribution in the structure of samples, which can be divided into two major peaks centered at 6.5±0.5 ppm for hydrogen attached to the aromatic ring and 1.7±0.5 ppm for hydrogen attached to sp3-hybridized carbons.11) The raw data was correct so that the two separated peaks matched the chemical shifts in the reference. However, the raw data of KP char (at 500 and 800°C) could not be resolved due to the weak response of the spectra. The amounts of aliphatic and aromatic hydrogens for carbonaceous feedstocks, obtained by 1H-NMR spectra, shown in Table S2. Ha, which is defined as the ratio of aromatic hydrogen to total hydrogen in aliphatic and aromatic groups, was calculated by deconvoluting the spectra of 13C NMR. The Ha value of raw biomass is the smallest, and the Ha of these different carbonaceous feedstocks was elevated to different degrees after pyrolysis.
3.4. Quantification of O-containing Functional Groups
3.4.1. Evaluation of Hydroxyl and Carboxyl Groups via FT-IR
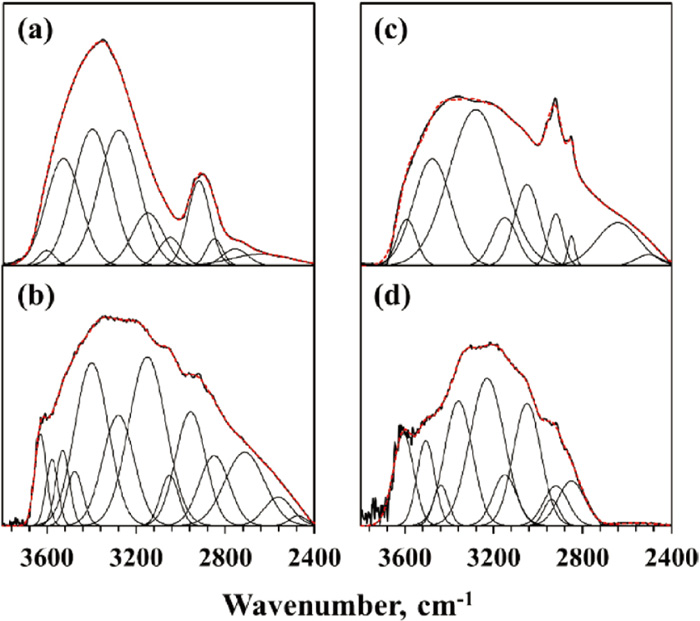
The FT-IR spectra for the coals and biomass, as well as their pyrolyzed chars were all characterized and shown in Figs. 5 and 6. The spectra were deconvoluted by an established method to estimate the amounts of hydroxyl and carboxyl groups for the raw and pyrolyzed samples.12,13) The region of 2400–3800 cm−1 was investigated, which related to the hydroxyl group (2940–3530 cm−1), aliphatic C–H group (2850–2954 cm−1), aromatic C–H group (3050 cm−1), and carboxyl group (2715 cm−1). By integrating the deconvolution peaks, the peak area distribution of these functional groups can be obtained.

The amount of carboxyl and hydroxyl groups in the char samples were quantified based on the method proposed by Fukuoka, et al.6) Based on the quantitative values of Ar–H obtained by solid-state 13C NMR analysis (in Table S1) and the area ratio that related to the 3050 cm−1 peak of FT-IR, which represents a similar bonding form, and the area ratio of the aromatic C–H peaks to the total hydroxyl groups peak by FT-IR, the hydroxyl groups in the char samples can be determined. And the total amount of -OH in raw feedstocks was estimated based on the correlation between the amount of -OH and the elemental composition of the samples provided by Yarzab, et al.,19) as in Eqs. (1), (2), (3).
|
O
OH
=-0.341*
W
C
+32.67
| (1) |
|
C
O
=
W
O
*
W
coal
/(
M
O
*100
)
*1 000*
Y
OH
| (3) |
Where, OOH is the percent of OH in coal, mass%; WC and WO are the weight percent of carbon and oxygen compounds in dry samples, mass%; YOH is the ratio of OH in oxygen content. CO is the mole of OH in coal samples, mmol/g-coal; Wcoal is the weight of coal, g/g-coal. MO is the molecular weight of oxygen, mol/g.
The quantitative results for OH groups are shown in Table 3. The calculations in this work are based on the mass of raw coal, and the units are unified as mmol/g or mol/kg. From the quantitative estimation of the hydroxyl group of the samples, the phenolic OH accounts for most of the total hydroxyl groups. The hydroxyl groups of four carbonaceous feedstock, both phenolic OH and carboxyl OH, dramatically drop after heating treatment at 500°C and further decrease after being treated at 800°C (for GO and KP coals), which is mainly attributed to the occurrence of dehydration or hydrodeoxygenation reactions. Among them, biomass contains the largest amount of hydroxyl groups due to a large amount of cellulose and hemicellulose components in Japanese cedar without aromatic C and with a high concentration of OH groups, which is also the reason why a large amount of pyrolyzed water was released during the pyrolysis of biomass.
Table 3. Quantitative estimation of the hydroxyl group of samples.
| Amount of hydroxyl, mmol/g |
|---|
| GO | GO500 | GO800 | KP | KP500 | KP800 | LY | LY500 | Biomass | Biomass500 |
|---|
| Total OH | 1.69* | 0.37 | 0.11 | 3.61* | 1.06 | 0.16 | 5.63* | 1.98 | 9.35* | 4.11 |
| Carboxylic OH | 0.14 | 0.07 | 0.02 | 0.23 | 0.04 | 0.02 | 0.60 | 0.02 | 0.27 | 0.14 |
| Phenolic OH | 1.55 | 0.30 | 0.09 | 3.38 | 1.02 | 0.14 | 5.03 | 1.96 | 9.08 | 3.97 |
* Amount of total hydroxyl group for raw coals is calculated by the equation proposed by Yarzab,
et al.19)The XPS method has been suggested to distinguish oxygenated functional groups presented on the surface of samples.14) Since the amount of oxygen in volatiles is unknown exactly, the reactions of oxygen-containing functional groups could be quantified only by the change of the solid-state chemical structure and the gas evolution. The oxygenated group, like aromatic and aliphatic carbon (248.8 eV), C–N or C–COO (285.3 eV), C–O (286.3 eV), C=O (287.5 eV), and O=C–O (289.0 eV) carbon distributions can be determined by XPS C(1 s) spectra.14) The peak deconvolution treated by XPSPEAK41 software is shown in Figs. 7 and 8.


Table 4 summarizes the amount of oxygen-containing functional groups based on XPS and FT-IR analysis. The spectral results of XPS determine the amount of oxygen associated with C–O and O=C–O groups, in which the C–O peak contains hydroxyl and ether groups, and the O=C–O peak contains carboxyl and ester groups. So, in combination with the determination of carboxyl and hydroxyl groups in FTIR, the amount of ether and ester groups can be obtained. The total O level itself is obtained by the elemental composition of S+O. It is clearly seen that C–O bonds exist mainly in the form of hydroxyl groups, while the higher level of hydroxyl groups appears in lower-rank coals, which coincides with the findings of Kelemen, et al.14) However, the level of carboxylic OH of all carbonaceous feedstocks is absolutely decreasing after pyrolysis.
Table 4. Quantitative estimation of O-containing functional groups for the carbonaceous feedstocks and chars.
| Content of O-containing functional groups, mmol/g |
|---|
| GO raw | GO500 | GO800 | KP raw | KP500 | KP800 | LY raw | LY500 | Biomass raw | Biomass500 |
|---|
| C=O | 0.60 | 0.73 | 0.60 | 0.74 | 0.67 | 0.46 | 3.19 | 1.04 | 8.36 | 1.06 |
| O=C–O | 0.21 | 0.14 | 0.13 | 0.68 | 0.34 | 0.18 | 3.75 | 1.74 | 0.74 | 0.03 |
| C–O–C | 0.50 | 1.96 | 0.73 | 2.72 | 4.34 | 0.94 | – | 0.23 | 6.01 | – |
| Carboxylic OH | 0.14 | 0.07 | 0.02 | 0.23 | 0.04 | 0.02 | 0.60 | 0.02 | 0.27 | 0.14 |
| Phenolic OH | 1.55 | 0.30 | 0.09 | 3.38 | 1.02 | 0.14 | 5.03 | 1.96 | 9.08 | 3.97 |
| Total O* | 3.47 | 3.49 | 1.59 | 8.89 | 6.84 | 1.95 | 15.08 | 6.76 | 25.75 | 2.86 |
* Total O was calculated by the amount of S+O in elemental composition.
Furthermore, it was observed for GO and KP coals that the level of the C–O–C group content first increased at 500°C and then decreased at 800°C compared with the level present in the starting coal, which was attributed to the occurrence of dehydration reaction on OH groups, and then the decomposition reaction gradually happened to form CO at higher temperature range. The other oxygenated group of GO and KP coal both show an obvious declined trend after being thermally treated at higher temperature. The C–O–C group of raw LY and biomass 500 cannot be determined by finding the difference between the C–OH amount obtained by FTIR analysis and the C–O amount obtained by XPS. One reason is related to the differences between the two analytical instruments and the errors for the separate measurements. However, the most important reason is thought to be that to make the calculation consistent, the OH groups of lignite coal and biomass were also calculated from Eq. (1), while Yarzab, et al. also stated that the adaptation of the formula differs for different coal types.19) So, the applicability of the correlation formula to lignite coal and biomass should be considered.
In this work, we estimated seven possible reactions involving oxygen-containing functional groups, which are divided into three main categories: dehydration reaction, hydrodeoxygenation reaction, and decomposition reaction. The amount of each reaction occurring can be roughly deduced from the content of oxygen-containing functional groups derived from FTIR and XPS analysis, combined with the gas fraction of H2O, CO, and CO2 derived within 500°C pyrolysis, as shown in Table 5.
Table 5. The possible reactions for oxygen-containing functional groups at 500°C.
| Entry | Reaction type | Chemical equation | Estimated amounts of the reaction [mmol/g-coal] |
|---|
| GO | KP | LY | Biomass |
|---|
| (a) | Dehydration reaction | 2C–OH → C–O–C+ H2O | 0.06 | 1.08 | 1.24 | 2.50 |
| (b) | C–OH + COOH → O=C–O + H2O | 0.07 | 0.19 | 0.58 | 0.13 |
| (c) | Hydrodeoxygenation | C–O–C + H2 → C–C + H2O | – | 1.39 | 0.05 | 8.51 |
| (d) | O=C–O + H2 → O=C + H2O | 0.09 | 0.01 | | 2.17 |
| (e) | Decomposition reaction | C=O → CO | 0.12 | 0.08 | 2.15 | 2.53 |
| (f) | O=C–O → CO2 | 0.04 | 0.52 | 1.99 | 2.71 |
| (g) | C–O–C → CO | – | 0.43 | 0.50 | – |
The relative levels of hydroxyls, carbonyls, and carboxyls functional groups decline in all carbonaceous feedstock following pyrolysis at 500°C. And the amounts of these possible reactions of oxygen-containing functional groups followed by order of GO<KP<LY<Biomass. The decomposition reaction (f) was considered as the main path to forming CO2. While CO evolution is considered to be produced via two paths, including the cleavage of carbonyl and ether functional groups, the allocation of the two reactions needs to be determined by the consumption of carbonyl and ether groups, and the production of CO gas. The dehydration reaction (a) and (b) are the main decomposition reactions for the coal samples to produce pyrolytic vapor, which is decreased with the decreasing of coal’s rank. In addition, the hydrodeoxygenation reactions significantly occurred on KP coal, while for lignite coal the distribution of the number of hydrodeoxygenation reactions cannot be determined based on the amount of C–O–C and O=C–O groups. The estimated amount of 0.05 mmol/g-coal is considered to be accounted for the hydrogen consumed by hydrodeoxygenation to form the pyrolytic vapor.
For biomass samples, a large number of hydroxyl and ether groups in the cellulose and hemicellulose components suffered from bond breaking and cleavage at 500°C, so more low-molecular volatiles were released, and a smaller amount of char remained. For GO coal, the increase of the C–O–C group was found after being treated with 500°C of pyrolysis, so the consumption of the C–O–C group of GO coal cannot be estimated. The decomposition reaction (g) of the biomass sample was underestimated in this work because it occurs at 973 K, as suggested by Figueiredo, et al.20) Therefore, the reduction of C–O–C groups on the biomass was considered only for the hydrodeoxygenation reaction (c). In fact, the pyrolysis of biomass should also involve inter-molecular hydration reactions on the cellulose and hemicellulose components to produce water vapor, while no further discussion was made for the sake of consistency with the comparison with coal samples instead attributed to reactions (c) and (d) in this work. The carbon-oxygen reactions for coals with the aromatic cluster are estimated here by simplifying the reactions, while the practicality for the quantification of biomass pyrolysis still deserves iterative discussion. Some cases where the amount of change of functional groups and the number of gaseous products produced do not reach equilibrium are also found, supposedly because of insufficient consideration of reaction types. However, considering more reactions would make the quantification calculation more challenging to perform.
3.5. Estimation of Transferable Hydrogen
Condensation reactions between aromatic ring systems can happen in coal pyrolysis and lead to the growth of aromatic clusters in coal macromolecular structure. The possible amount of hydrogen evolved with the heating treatment of the coal samples up to 500°C was estimated by using the information of the aromatic cluster structures of the raw coal samples (at ambient temperature) and their chars obtained from the pyrolysis. There are three possible fates for (a) the hydrogen generated by aromatic cluster growth, like (b) the molecular hydrogen released to the gas phase, (c) the hydrogen consumed by hydro-deoxygenation reaction and converted to water, and (d) the hydrogen consumed to stabilize radicals formed by the thermal decomposition, named transferable hydrogen. The amount of hydrogen formed by aromatic cluster growth and the fate distribution upon pyrolyzing up to 500°C is demonstrated in Fig. 9.

The amounts of transferable hydrogen were estimated by the difference of the hydrogen generated from the growth of aromatic clusters with gas-phase hydrogen as well as hydrogen consumed for water formation, as shown in Table 6. The amounts of transferable hydrogen are estimated to be 3.96, 2.32, and 1.36 mol/kg-coal for GO, KP, and LY, respectively. The amount of the transferable hydrogen in GO would be sufficient to effectively quench the radicals formed and induce softening. Meanwhile, the non-caking KP coal and lignite LY coal exhibit less softening properties, possibly due to the less amount of transferable hydrogen. These results suggest the effectiveness of transferable hydrogen as an indicator for assessing caking properties in coal thermal pretreatment. However, biomass contains a different structure (containing around 70% cellulose and hemicellulose, which are polysaccharides) compared to coal samples and has different pyrolysis properties, as seen in the previous online measurement of gas evolution. The large number of -OH functional groups in biomass structure is mainly consumed to form water via intermolecular dehydration on hydroxyl groups, intramolecular dehydration of cellulose and hemicellulose, and hydrodeoxygenation of lignin. Here, the hydrogen consumed by hydrodeoxygenation (c) comes from the growth of the aromatic cluster on the one hand, and the intermolecular reaction of cellulose and hemicellulose to produce monomeric volatile products such as furfural and 5-HMF on the other hand.21) The latter dominates the biomass pyrolysis process and cannot be accurately calculated, so the transferable hydrogen of biomass cannot be exactly calculated in this work.
Table 6. Quantitative estimation for transferable hydrogen of GO, KP, LY, and biomass.
Feedstock
(mol-H2/kg-coal) | Aromatic cluster growth formed hydrogen | Pyrolytic gas released hydrogen | Hydro-deoxygenation consumed hydrogen | Transferable hydrogen |
|---|
| (a) | (b) | (c) | (d) |
|---|
| GO coal | 4.04 | 0.08 | 0.00 | 3.96 |
| KP coal | 3.81 | 0.08 | 1.41 | 2.32 |
| LY coal | 1.55 | 0.14 | 0.05 | 1.36 |
| Biomass | 1.29 | 0.16 | 10.67 | 0.00 |
Note: (d)=(a)-(b)-(c)