1. Introduction
Partial or entire replacement of coal by biomass as feedstock of metallurgical coke contributes to a reduction in the emission of fossil-derived CO2 from ironmaking. The production of coke from biomass has, therefore, become a research topic of interest in the field of biomass conversion. Most of the existing studies have focused on the application of biomass as an additive to coal and coke production by conventional coke-oven methods.1,2,3,4,5) A common conclusion from previous studies was a loss of coke strength and an increase in coke reactivity unless the addition rate of biomass was below 5 mass%. The loss of strength was ascribed mainly to fluidity upon heating by the biomass addition4) or a mismatch in the volatile matter content between coal and biomass.5)
Wibawa et al.6) successfully prepared coke with cold tensile strength (TS) of up to 32 MPa from woody biomass (Japanese cedar) alone, which was much greater than that of commercially available coke-oven coke, 4–6 MPa on average.7,8) They modified a series of processes including pulverization, hot briquetting, and carbonization, which had been demonstrated for lignites and sub-bituminous/bituminous coals,9,10) by inserting the torrefaction before the pulverization. The torrefaction at an optimized temperature, 275°C, greatly improved pulverizability of the biomass but also allowed hot briquetting at 200°C and preparation of briquette with TS of up to 8 MPa without either binder or pulverized coal. TS of the torrefied cedar briquette increased by carbonization at 500–1000°C. Such an increase was caused by an increase in the strength of the continuous carbonaceous matrix and, more importantly, the bonding and coalescence of particles. Wei et al.11) torrefied woody biomass in the presence of acid-catalysts, which greatly enhanced the formation of anhydrosugars. They also converted the torrefied biomass to high-strength coke by applying the sequence proposed by Wibawa et al.6) Wibawa et al.12) also prepared coke from mixtures of non-caking coal and torrefied cedar and demonstrated co-pulverization of the coal and torrefied cedar before briquetting led to coke with a TS as high as 28–32 MPa regardless of the mixing ratio. They found the bonding between particles derived from coal and torrefied cedar in the course of carbonization.
A particular feature of biomass-derived coke is much higher reactivity with CO2 than coal-derived coke from general caking and non-/slightly caking coals.1,2,3,4) Such reactivity is attributed mainly to alkali and alkaline earth metallic (AAEM) species, i.e., Na, K, Mg, and Ca that play catalytic roles in CO2 gasification.13,14,15,16,17) The contents of the individual metallic species in woody biomass are generally well below 1 mass% on a dry basis, but their catalysis results in the rate of catalytic gasification much greater than that in their absence, i.e., that of non-catalytic gasification. This is attributed to the fact that major portions of AAEM species are highly dispersed in the organic matrix of biomass as cations bonded to acidic functional groups such as carboxylic groups, or otherwise inorganic salts.
The catalysis of AAEM species undoubtedly and significantly increases the so-called coke reactivity index (CRI), causing a decrease in coke strength after reaction (CSR).18) This is reasonably understood because the CSR of coke with a larger CRI is measured at higher conversion (greater carbon loss). It seems that cokes with a smaller CRI are often favored over those having a greater one.19,20,21) It is, however, also claimed that a greater CRI is not a negative but even a positive property of coke if it has sufficiently high CSR even at higher conversion by CO2 gasification. Such coke is even favored due to a decrease in the temperature of the thermal reserve zone and then an increase in the thermal efficiency of the blast furnace operation.22,23) The cokes prepared by Wibawa et al.6,12) had a TS much greater than commercially available cokes and this leads to an expectation of ‘high CRI but high CSR’, which has not been proven yet.
Removal of AAEM species from biomass or torrefied biomass is undoubtedly effective to decrease the reactivity of resulting coke. Water is the cheapest solvent to remove AAEM species from biomass. It can remove substantial portions of monovalent Na and K, but much less of divalent Mg and Ca.24) It is believed that washing with acidic water is effective for removing more of not only monovalent but also divalent AAEM species because removal of ion-exchanged AAEM species (that are hardly removed by washing with neutral water) requires proton, H+. Acidic water is also effective for dissolving Ca in the form of carbonate, which is almost insoluble in neutral water. An important feature of biomass pyrolysis is the formation of organic acids such as acetic and formic acids. It is, therefore, expected that acidic water from pyrolysis is available in the removal of AAEM species from the parent biomass or its char. Karnowo et al.25) washed a type of biomass (rice husk) with acidic water (pH ≈ 2.6) from its pyrolysis at 500°C, and thereby removed 90% or more of Na, K, and Mg, and 70% of Ca from the rice husk. They also reported that phenolic compounds dissolved in the acidic water promoted the leaching of AAEM species out of the rice husk by promoting the permeation of water and acetic acid. This work was followed by Chen et al.26,27) who investigated the removal of AAEM species from bamboo with acidic water from its pyrolysis. It is known that hemicellulose is the most important source of pyrolytic acetic acid, while it is also formed from cellulose and lignin.28,29) The hemicellulose undergoes pyrolysis at temperatures lower than the other major components. As a result of this, pyrolysis at 500°C or higher temperatures is not necessarily favored for increasing or maximizing acetic acid yield.28,29) Recovery of acetic acid from torrefaction at temperatures lower than 300°C,28,29) if combined with its use for removing AAEM species from the biomass or torrefied biomass, is expected to be more effective than pyrolysis at 500°C or higher.
In continuation of the above-mentioned studies by Wibawa et al.,6,12) the present authors have been investigating formed coke production from woody biomass by torrefaction, pulverization, washing with torrefaction-derived acidic water, hot briquetting, and carbonization, as shown in Fig. 1, focusing on the removal of AAEM species by the acid-water washing and examining its effects on the strength and reactivity of the resulting coke.
2. Experimental
2.1. Materials
The same sawdust of a Japanese cedar used in our previous studies6,12) (SD) was employed as the feedstock. It had particle sizes smaller than 3.0 mm. The ultimate and proximate analyses and AAEM contents of SD are shown in Tables 1 and 2, respectively. The AAEM contents were determined according to a reported method.25,30) SD and torrefied SD (hereafter referred to as TSD) before and after the washing were carefully and completely ashed by heating in the air with heating rate, holding temperature, and holding time of 1°C/min, 620°C, and 60 min, respectively. The resulting ash was digested in an equivolume mixture of 1 M HF and 1 M HNO3 at 60°C for 16 h. The acids and water were then evaporated at 120°C. The solid residue was dissolved in 4-mmol/L aqueous solution of methanesulfonic acid and analyzed by ion chromatography for quantification of Na, K, Mg, and Ca. Their molar fractions were 3.0, 22.7, 15.1, and 59.2%, respectively. Na was much less abundant than the others. Twenty-two types of organic compounds, which are shown later, of reagent grades were purchased from FUJIFILM Wako Pure Chemical Corp. and used without further purification for preparation of the simulated acidic water from the torrefaction.
Table 1. Ultimate and proximate analyses of cedar (SD) and torrefied cedar (TSD).
| Ultimate analysis | Proximate analysis |
|---|
| C | H | N | O (diff.) | VM | ash | FC |
|---|
| mass%-dry | mass%-dry |
|---|
| SD | 49.2 | 6.0 | 0.3 | 44.6 | 85.7 | 0.5 | 13.9 |
| TSD | 55.4 | 5.5 | 0.3 | 38.8 | 76.9 | 1.1 | 22.0 |
Table 2. Contents of AAEM species in SD and TSD.
| Element | Na | K | Mg | Ca |
|---|
| mass%-dry-SD or mass%-dry-TSD |
|---|
| SD | 0.0028 | 0.037 | 0.015 | 0.097 |
| TSD | 0.0037 | 0.049 | 0.020 | 0.129 |
SD with a dry mass of around 4 g was torrefied in a horizontal fixed bed reactor by heating in the flow of atmospheric N2 at a rate of 5°C/min to a holding temperature of 275°C. The temperature holding time was fixed at 60 min. As reported previously,6,12) TS of coke was maximized by torrefaction at 275°C. Tables 1 and 2 compare the properties of TSD with those of SD. The reactor exit was connected to an aerosol collector equipped with a silica-fiber-made thimble filter, which was for complete recovery of the heavier portion of bio-oil (molecular mass of the components, MM > 200).30,31) The exit of the aerosol collector was connected to two condensers in a series cooled at 0°C and −70°C, respectively. The lighter portion of the bio-oil (MM < 200) and water were condensed completely in those condensers.30,31) The non-condensable gases that had passed through the collector/condensers were collected in a gasbag together with N2 and then analyzed by gas chromatography. The mixture of the light bio-oil and water was a single-phase liquid, which is hereafter referred to as acidic water (AW). The water and organic compounds were quantified by Karl-Fischer titration and gas chromatography/mass spectrometry (GC/MS), respectively. The distribution of the torrefaction products is shown in Table 3.
Table 3. Product yields from torrefaction.
| Product |
|---|
| Torrefied cedar | Light bio-oila) | heavy bio-oil | gas |
|---|
| mass% of dry cedar |
|---|
| 76.3 | 16.5 | 3.1 | 4.1 |
a) The light bio-oil consisted of water (47.2 mass%) and organic compounds with molecular mass < 200 (52.7 mass%).
TSD was pulverized to sizes smaller than 100 μm in a cutter mill within around 1 min6,12) and subjected to leaching. Properties of the pulverized TSD are available in Supporting Information (Table S1 and Fig. S1). The leaching tests were performed employing six different liquids, i.e., deionized water, aqueous solutions of acetic acid (AcA), oxalic acid (OxA) and hydrogen chloride (HCl), and a simulated AW (SAW). SAW consisted of water and 22 compounds, which are listed in Table 4, with the same concentration as those of AW. The properties of the acidic waters are summarized in Table 5. SAW-1 represents the fresh SAW. Its pH, 1.95, was in good agreement with that of AW (1.93).
Table 4. Composition of AW.
| Compound | Formula | content in bio-oil (wt%) |
|---|
| Acetaldehyde | C2H4O | 0.42% |
| 2,3-Butanedione | C4H6O2 | 0.35% |
| Formic acid | CH2O2 | 0.85% |
| Acetic acid | C2H4O2 | 12.12% |
| Acetol | C3H6O2 | 5.81% |
| Propanoic acid | C3H6O2 | 0.42% |
| 1-Hydroxy-2-butanone | C4H8O2 | 0.38% |
| monoacetate | C4H8O3 | 1.55% |
| Propanoic acid | C3H6O2 | 0.33% |
| Furfural | C5H4O2 | 2.36% |
| 2-Furanmethanol | C5H6O2 | 4.28% |
| 2-Cyclopenten-1-one | C5H6O | 2.93% |
| 2(5H)-Furanone | C4H4O2 | 1.01% |
| o-Guaiacol | C7H8O2 | 1.76% |
| methylphenol | C8H10O2 | 1.28% |
| 1,4-Butanediol | C4H10O2 | 6.07% |
| 2-Methoxy-4-ethylphenol | C9H12O2 | 0.03% |
| Guaiacol | C7H8O2 | 1.78% |
| Eugenol | C10H12O2 | 0.87% |
| Phenol | C6H6O3 | 6.35% |
| Vanillin | C8H8O3 | 0.84% |
| Vanilly methyl ketone | C10H12O3 | 1.01% |
| Total | | 52.80% |
The total contents of the organic compounds were 52.8 mass% of AW, while that of water was 47.2 mass%.
Table 5. Liquids employed for leaching of AAEM species from torrefied cedar and conditions of leaching.
| acid concentration mol/L | pH | volume mL | mass of TC g-dry |
|---|
| before leaching | after leaching |
|---|
| Deionized water | – | 6.25 | 7.12 | 160 | 8.0 |
| Acetic acid (AcA) | 1.0 | 2.35 | 2.72 | 160 | 8.0 |
| Hydrogen chloride (HCl) | 0.1 | 1.05 | 1.18 | 160 | 8.0 |
| Oxalic acid (OxA) | 1.0 | 0.77 | 0.77 | 160 | 8.0 |
| Light bio-oil (LBO) | | 1.93 | – | | |
| Fresh SAW (SAW-1) | – | 1.95 | 2.08 | 160 | 8.0 |
| Once-used SAW (SAW-2) | – | 2.09 | 2.24 | 140 | 7.2 |
| Twice-used SAW (SAW-3) | – | 2.24 | 2.37 | 120 | 6.1 |
In each leaching test, the pulverized TSD was suspended in either water or acidic waters at a fixed liquid/TSD ratio of 20 mL/g-TSD except in repeated use of SAW. The suspension was heated to 60°C, stirred gently for 24 h avoiding pulverization of TSD, cooled down to ambient temperature, and then filtered for liquid/solid separation. The acid-washed TSD was further washed with deionized water until no anion could be detected, i.e., chlorine, acetate, oxalate, or formate ion. The solid was vacuum-dried at 60°C for 6 h and then stored until use, while the filtrate was subjected to pH measurement. The filtrate from the leaching with SAW-1 (i.e., the spent SAW-1 = SWA-2) was used for the leaching of TSD. Then, the filtrate from this leaching (SAW-2) was used further in the same way. The purpose of the repeated use of SAW was to investigate its leaching capacity.
2.4. Briquetting and Carbonization
The pulverized TSD and pulverized/acid-washed TSDs were briquetted individually into disks at 200°C under a mechanical pressure of 128 MPa according to our previous report.6,12) Those TSDs were dried at 40°C for 24 h under vacuum prior to the briquetting. The dimensions of briquettes were 13.9–14.1 mm and 5.1–6.9 mm in diameter and thickness, respectively. No binder was used for the briquetting. Briquettes were carbonized to coke by heating to 1000°C in a flow of N2 with a heating rate and holding time of 1000°C of 5°C/min and 10 min, respectively.6,12)
2.5. Measurement of the Tensile Strength of Briquette and Coke
Briquette and coke samples were subjected to indirect measurement of TS at ambient temperature. Details of the measurement were reported previously.9,10) Four to eight specimens were tested for each coke or briquette. It was confirmed that the deviation of TS was within ±10% of the average, as reported previously.6,12) The diameter, thickness, and mass of each briquette or coke specimen were measured to determine its apparent (bulk) density.
2.6. Gasification of Coke with CO2
Each coke sample was pulverized to sizes smaller than 125 μm and subjected to CO2 gasification in a thermogravimetric analyzer (TGA, Hitachi High-Technologies, model STA7200). Each sample with a mass of ca. 1 mg was heated in the flow of atmospheric N2 (flow rate; 700 mL-stp/min) to 900°C at a rate of 10°C/min. After 10-min of temperature holding, the gas was switched instantaneously to CO2/N2 mixture (50/50 vol%, flow rate; 700 mL-stp/min). The coke mass was continuously measured until complete gasification was achieved. The initial mass of coke and gas flow rate were chosen according to a report by Asano et al.,17) who demonstrated the conditions for eliminating mass transport effects on the rate of char gasification in TGA.
3. Results and Discussion
3.1. Leaching of AAEM Species of TSD
Figure 2 shows removal rates of AAEM species for the neutral or acidic water as a function of its initial pH. The neutral water removed 64% of K while only 11–15% of the other AAEM species were removed. It was believed that the water leached only highly water-soluble inorganic salts such as carbonates and chlorides, leaving organically bound (ion-exchanged) AAEM species and Ca/Mg carbonates. It is generally accepted that the removal rate is determined mainly by the pH of water, and that lower pH results in a higher removal rate. However, none of the AAEM species followed such an expected trend. SAW-1 (initial pH = 1.95) gave greater removal rates than HCl (1.05), OxA (0.77) and AcA (2.35) for all the AAEM species. The removal rates of K, Mg, and Ca for SAW-1 were as high as 96–97%. The major acid of SAW-1 was acetic acid, but the removal rates with SAW-1 were clearly higher than that with AcA.

The above-mentioned high leaching ability of SAW-1 was attributed to the high content of organic compounds (39.4 mass%, excluding acetic, formic, and propanoic acids). Those compounds, in particular, phenolic compounds such as derivatives of furan, guaiacol phenol, eugenol, and vanillin, greatly helped the water and acids penetrate into the organic matrix of TSD, which was more hydrophobic than SD.24,25) Karnowo et al.25) reported that furan, guaiacol, and phenol derivatives were well absorbed into the organic matrix of biomass and concentrated there. It was believed that the hydrophobicity of TSD reduced the accessibilities of the HCl, AcA, and OxA aqueous solutions. Though not confirmed, it was expected that SAW-1 was also a better leaching agent than the others for SD, according to the reports by Karnowo25) and Chen.26)
The removal rate of Na was much lower than that of the other monovalent cation, i.e., K, and the reason for this was not clear. A possible explanation was that the organic matrix of TSD retaining a major portion of Na was more hydrophobic than that retaining K. This explanation would be applicable to Mg and Ca. OxA had a pH lower than that of HCl, but gave a much lower removal rate of Ca. This was probably due to the very low solubility of Ca oxalate in water.
It was also found that the fresh, once-used, and twice-used SAWs (with a pH before use of 1.95, 2.09, and 2.24, respectively) gave very similar removal rates for all the AAEM species. This result suggested the possibility of repeated use of AW for leaching of the AAEM species. The total amount of acetic, formic, and propanoic acid collected from the torrefaction was 374 mmol/kg-dry-cedar (= 374 meq/kg-dry-cedar). This was 5.4 times that of the AAEM species that was leached by SAWs (69.5 meq/kg-dry-cedar). The total amount of the organic acids from the torrefaction was thus sufficient for the leaching of the AAEM species out of TSD. The removal of AAEM species with AW is further considered in Section 3.6 from an engineering point of view.
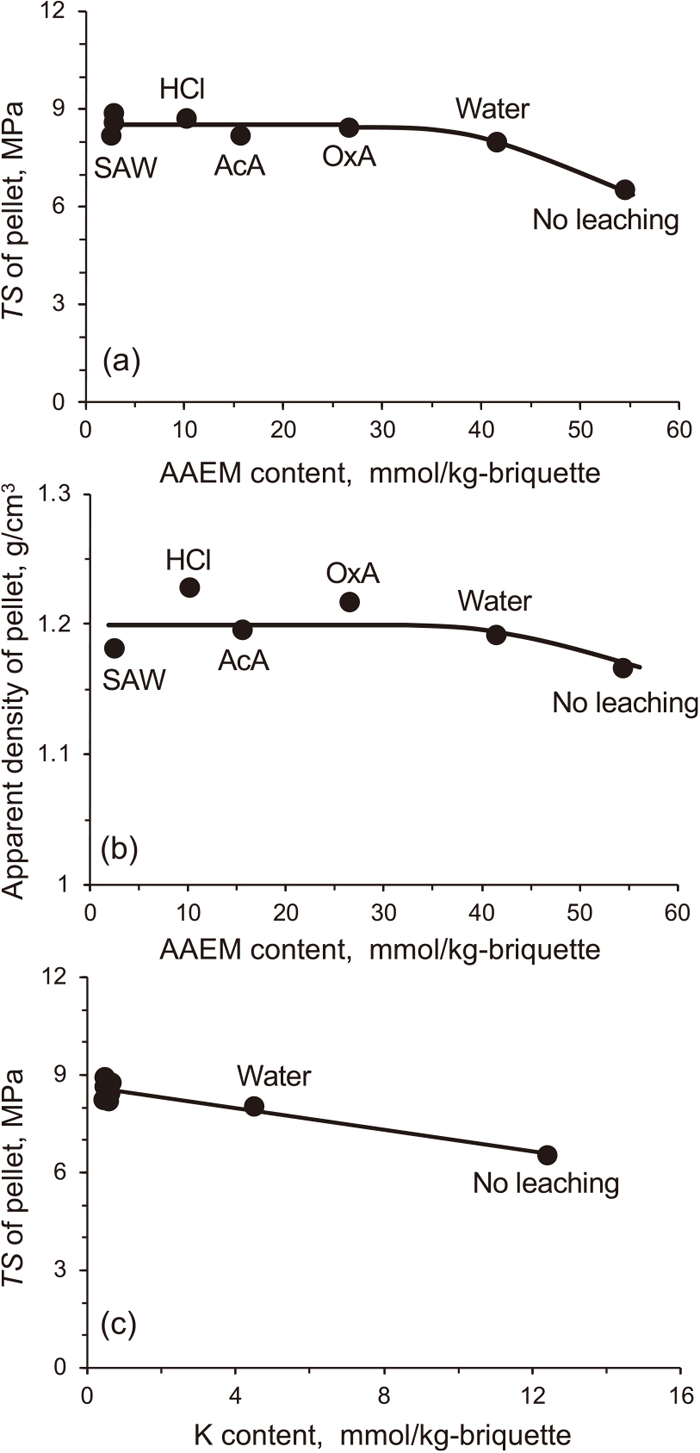
3.2. Strength of Briquette
Figure 3 shows the effects of the removal of AAEM species on the apparent density and TS of briquette. As seen in graphs (a) and (b), the leaching of only a portion of AAEM species with the neutral water was effective for increasing both the density and TS. It also seemed that such positive effects were saturated at around half the removal of AAEM species. In other words, the briquettes of the TSDs washed with the acidic waters were similar within the range of 8.2–8.9 MPa. As shown in graph (c), further analysis revealed that the briquette TS correlated better with the content of K than that of the other AAEM species. Such a correlation, unless it was a coincidence, implied that the K species suppressed the plasticization of TSD particles and the resulting particle deformation and bonding and then densification of briquette. Suppression of the plasticization is likely to occur since metallic cations, regardless of their valences, can act as ionic cross-linking agents inducing property changes such as an increase in glass transition temperature.32,33) The divalent cations, Mg and Ca, were more abundant in TSD, and 32–97% of these cations were removed by washing with acidic waters. However, it seemed that the removal of those cations hardly influenced the briquette TS. The reason for this was not clear, but it was suggested that the divalent cations were absent or not abundant in the ‘plasticizable’ portion of the organic matrix.
Figures 4(a) and 4(b) show TS and apparent density of coke as functions of AAEM content in the briquette. Both properties seemed to increase with an increasing AAEM removal rate. TS of the coke from the SAW-washed TSD was greater than that from TSD by a factor of 1.25. It is generally accepted for formed coke that an increase in the apparent density leads to that in TS.9) TS of the cokes from TSDs in fact followed this trend. It was believed that the densification and TS increase occurred mainly during carbonization at 500–1000°C,6) where the volumetric shrinkage in bulk was the main driving force of particle bonding and coalescence.6) The volumetric shrinkage was then investigated. Figure 5(a) plots the volatile matter yields from the carbonization of TSDs against their AAEM contents. As expected from previous studies on the pyrolysis of acid-washed biomass,27) the volatile matter increased while the coke yield decreased with an increasing removal rate of AAEM species. This was mainly due to the removal of AAEM species that behaved as cross-links or cross-linking promoters in the pyrolysis.34) More volatile matter yield resulted in greater volumetric shrinkage (Fig. 5(b)), which correlated well with TS (Fig. 5(c)). The removal of AAEM species was thus effective for increasing the TS of coke from TSD, although the increment was limited.

Table 6 lists the AAEM contents in the coke samples. It was found that the retention of AAEM species, which was defined by
Table 6. Contents of AAEM species in cokes.
| Element | Na | K | Mg | Ca |
|---|
| mass%-dry-coke |
|---|
| Coke sample |
| No leaching | 0.011 | 0.14 | 0.059 | 0.38 |
| Water | 0.0095 | 0.052 | 0.050 | 0.34 |
| OxA | 0.0094 | 0.0069 | 0.020 | 0.26 |
| AcA | 0.0082 | 0.0070 | 0.026 | 0.12 |
| HCl | 0.0089 | 0.0074 | 0.017 | 0.07 |
| SAW-1 | 0.0061 | 0.0052 | 0.0024 | 0.013 |
(AAEM content in coke) x (coke yield from briquette)/(AAEM content in briquette),
was within a range of 90–110% for all the AAEM species and cokes with no systematic trends. More details are available in Fig. S2. It was then concluded that the volatilization loss of AAEM species, if any, was insignificant during the carbonization of briquette. The AAEM contents shown in Table 6 were thus given by
(AAEM content in briquette)/(coke yield based on briquette mass).
Figure 6 compares time-dependent changes in 1–X (X; mass-based conversion of coke) in the CO2 gasification of the cokes. The removal of AAEM species, as expected, greatly slowed down the gasification. The coke having a lesser amount of AAEM species underwent gasification more slowly, and this was an indication of the importance of the catalysis of AAEM species. Figure 7 shows the times required for X = 0.50 and X = 0.99, denoted by t0.50 and t0.99, respectively, as functions of the total concentration of K, Na, and Ca in the coke before gasification. The concentration of Mg was not considered because its catalysis is questionable.35,36) t0.50 and t0.99 for the SAW-1 coke were longer than those of coke without leaching by factors of 24 and 46, respectively. Such factors were as small as 1.6 and 2.1, respectively, for the coke from the water-washed TSD. The SAW-1 coke reactivity was compared with that of coke from caking coal (Goonyella), which was reported by Karnowo et al.,37) who investigated the kinetics of gasification at the same temperature and CO2 concentration as in the present study. The t0.50 of that coke, 230 min, was 1.6 times that of the SAW-1 coke. Thus, the reactivity of the coke from TSD had approached that of coke from such a typical caking coal.

The rate of gasification of coke that contains catalyst such as AAEM species is generally expressed by the following kinetic equation assuming progress in parallel of non-catalytic and catalytic gasification.14,15,16,17)
|
(dX/dt)=
(dX/dt)
nc
+
(dX/dt)
c
=
k
nc
(1-X)+
k
c
| (1) |
(dX/dt)nc: rate of non-catalytic gasification (= gasification in the absence of catalyst)
(dX/dt)c: rate of catalytic gasification
knc: first-order rate constant for non-catalytic gasification
kc: zero-th-order rate constant for catalytic gasification
It has been demonstrated that the non-catalytic gasification of chars from biomass and lignite follows first-order kinetics with respect to (1–X). knc is steady over the entire range of X, in which the surface area of char changes.14,16,17) On the other hand, the rate of catalytic gasification obeys zero-th-order kinetics with respect to (1–X) if the catalytic species are highly dispersed in the gasifying char.14,16,17) The rate constant kc can be expressed by
|
k
c
=
k
c
’
C
c,0
=
k
c
’
C
c
(1-X)
| (2) |
kc’: rate constant of catalytic gasification per catalyst concentration
Cc,0: catalyst concentration at X = 0
Cc: catalyst concentration in gasifying char
Equation (3) assumes no loss of catalytic species by volatilization.15,17,39) kc’ represents the catalytic activity, and it can increase and decrease with X due to catalyst activation and deactivation, respectively. From Eqs. (1) and (2), the specific rate of gasification, rsp, is given by
|
r
sp
=(dX/dt)/(1-X)=
k
nc
+
k
c
’
C
c
| (4) |
is experimentally given from the rate analysis of the gasification of char that contains no catalytic species. Asano
et al.17) removed AAEM species and transition metallic species almost completely from Victorian lignite, as well as its char, by exhaustive acid washing and determined
knc = 0.0040 min
−1 at 900°C and CO
2 concentration = 50 vol%. Zahara
et al.,
15) Halim
et al.,
30,39) and Byambajav
et al.38) determined
knc for the gasification of sugarcane bagasses, Indonesian lignites, and Mongolian lignites, respectively. For all types of feedstocks,
knc was around 0.004 min
−1 under the same temperature and CO
2 concentration as above. According to this,
knc for the present cokes was assumed to be around 0.004 min
−1.
Figure 7 shows (d
X/d
t) for the SAW-1 coke of that AAEM species had been removed near completely in comparison with (d
X/d
t)
nc with
knc = 0.004 min
−1. The (d
X/d
t) is slightly greater than the (d
X/d
t)
nc over the range of
X probably due to insignificant catalysis of the remaining AAEM species. The assumption of
knc = 0.004 min
−1 was thus reasonable, and it enabled the extraction of (d
X/d
t)
c for all the cokes by
Eqs. (1) and
(4).
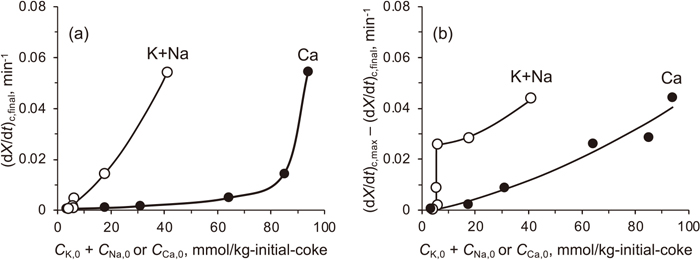
Figure 9 shows (dX/dt)c for different cokes. The rate of gasification of the coke from TSD without the leaching was contributed mainly by (dX/dt)c but negligibly by (dX/dt)nc. On the other hand, (dX/dt)nc was more important than (dX/dt)c for the gasification of the SAW-1 coke. It was also found that (dX/dt)c changed with X through a maximum at X = 0.4–0.7 for the cokes except for the SAW-1 coke. This common trend indicated that the overall catalytic activity of K, Na, and Ca increased and then decreased during the gasification due to their activation and deactivation, respectively. The order of the maximum (dX/dt)c agreed with that of the total contents of K, Na, and Ca. As shown in Fig. 10, (dX/dt)c was correlated but non-linearly with the total concentration of K, Na, and Ca in the initial coke (i.e., that at X = 0), which are hereafter denoted by CK,0, CNa,0, and CCa,0, respectively.


The non-linearity seen in Fig. 10 is discussed. It was suspected that the difference in the intrinsic activity of K, Na, and Ca catalysts caused the linearity, and it was found that (dX/dt)c,max was correlated linearly with corrected catalyst concentration in the initial char, which was defined by CK,0 + CNa,0 + aCCa,0 (a = 0.20), with a correlation factor r2 = 0.982. This result is available in Fig. S3. Thus, the lower activity of the Ca catalyst than the K and Na catalysts could explain the non-linearity. This explanation was, however, not necessarily reasonable. Hippo et al.36) investigated the kinetics of CO2 gasification of K, Na, Ca, and Mg-loaded lignites that were prepared from the identical exhaustively acid-washed lignite. The AAEM species were individually loaded onto the lignite by ion exchange at carboxyl groups. They found that the activities of K, Na, and Ca were near equivalent while that of Mg was much lower.
The focus was then turned to the increase in catalyst activity during gasification. Figure 11 illustrates changes in kc’ with CK + CNa + CCa, which is given as Cc in Eqs. (2), (3), (4). It was found for all the cokes that kc’ was maximized at X in a range of 0.37–0.57, and more importantly, the coke with greater Cc,0 had greater maximum kc’ than that with smaller Cc,0 at equivalent Cc. If the catalyst activity was determined exclusively by Cc, the kc’–Cc profile could be independent of Cc,0. Under the assumption the initial concentration of AAEM species had no effect, it was expected that the same or very similar kc’–Cc profiles could be attained from the different cokes. This was, however, not the case. The initial concentration of catalyst Cc,0 was thus an important factor for its activity during the gasification, and this seemed to be the primary reason why a degree of AAEM removal resulted in a greater decrease in (dX/dt)c, as presented in Fig. 10. Halim et al.39) investigated K-catalyzed gasification of lignite char and drew a similar conclusion about the effect of the initial K concentration in char on the rate of gasification. The mechanism inducing the effect of Cc,0 is unknown. A possible mechanism is that the greater rate of gasification due to higher Cc,0 helped form active clusters of K, Na, and/or Ca from less active or inactive species that are dispersed in an atomic scale in the form of C–O–M (M; K39,40,41) or Na42)). If redox cycles of metallic species occurred slowly, active oxygen could be supplied (from CO2) to reduced species to regenerate C–O–M. In fast gasification, aggregation of metallic species (i.e., clusters formation) could occur more rapidly than the oxygen supply. Another possible mechanism was cluster formation before gasification. Higher concentrations of metallic species could be favored for cluster formation during carbonization. This was reasonable because the carbonization (before the gasification) decreased the oxygen content in coke reducing the capacity of holding metallic species in the form of C–O–M.

The increasing activity of catalyst with its concentration increase in the gasifying char is another feature of Fig. 11, and it is known for K39,40,41) and Na.42) It is believed that metallic species were dispersed in the carbon matrix of char being bonded carbon in the form of C–O–M at low concentrations but that tended to form active clusters due to the limited capacity of the carbon to hold the metallic species.40,41,43,44) Figure 11 also shows that kc’ decreases in the mid and late stages of gasification. This was due to catalyst deactivation. It was believed that two different mechanisms were responsible for the decrease in kc’. TSD as well as SD had SiO2 with a small content of SiO2 (0.16 wt%-dry-SD). This corresponds to 70 mmol-Si/kg-SD and is roughly equivalent to the valence-based content of AAEM species in the cedar, 0.69 meq/kg-SD. Thus, a portion of the AAEM species was likely to undergo deactivation by reacting with SiO2 forming silicates. It is also known that Ca clusters grow in size to coarser particles that have little or no catalytic activity.45) On the other hand, the activity of K clusters seems to be sustainable until their precipitation from the gasifying carbon matrix.39,40) Halim et al.39) prepared K-loaded chars from exhaustively acid-washed parent lignites and reported that the activity of K increased as its concentration increased in the gasifying char and then leveled off without deactivation. It was suggested that Ca underwent self-deactivation resulting in the decrease in kc’ while neither K nor Na behaved in such a manner.
Two different parameters were considered for examining the above discussion. One was (dX/dt)c,final, which was defined as (dX/dt)c at X = 0.98. Figure 12 plots (dX/dt)c,final and the other parameter, the difference from (dX/dt)c,max against CK,0 + CNa,0 or CCa,0. The difference between (dX/dt)c,max and (dX/dt)c,final indicates the degree of reduction of the overall catalytic activity, and it seems to be correlated much better with (CK,0 + CNa,0) than CCa,0. This correlation is reasonably accepted by considering that the deactivation of Ca catalyst45) greatly contributed to the decrease in (dX/dt)c in the mid/late stages of the gasification as well as that in kc’. On the other hand, the (dX/dt)c,max−(dX/dt)c,final difference is not well correlated with CK,0 + CNa,0, probably due to the sustainability of the K/Na catalyst activity.40,41) The contribution of the Ca catalyst to (dX/dt)c,final is not denied, but the plot of (dX/dt)c,final against CCa,0 may not be reasonable considering that the initial higher catalyst concentration (in other words, initial higher activity) results in more rapid loss of activity during gasification.14,38,46) Assuming the role of Na/K catalyst in (dX/dt)c,final is much more reasonable.
This section verifies the applicability of AW to the removal of AAEM species from TSD, assuming a type of process that is presented schematically in Fig. 13.
3.6.1 Quantitative Description of Acidity of AW and Leaching of AAEM Species
The property of AW as an acid is considered. AW contained acetic acid (AcA), formic acid (FA) and propanoic acid (PA) with mass fractions of 12.1, 0.9 and 0.4%, respectively, while that of water was 47.2%. The properties and concentrations of these acids are summarized in Table 7. The pH of AW was calculated by solving simultaneous equations on the acidity constants (Ka), ionic product of water (Kw), charge balance and material balance. The calculated pH, 1.91, was close to the measured pH of AW (1.93) and SAW-1 (1.95), and it was thus reasonable to consider that AcA, FA and PA represented the acids in AW. Calculation was also performed to determine an overall pKa (= 4.54 or 4.58) of the acids in AW, which gave pH of 1.93 or 1.95, respectively, by the above-mentioned simultaneous equations.
Table 7. Properties and concentrations in AW of AcA, Fa and PA.
| acid | conc. in AW, mol/L-water | pKa, − |
|---|
| AcA | 4.27 | 4.75 |
| FA | 0.41 | 3.75 |
| PA | 0.12 | 4.86 |
| Total | 4.80 | 4.54a |
a pKa of a single fictitious acid that represents the acidity of AW.
Consumption of acid in leaching of AAEM species was considered with a focus on the history of pH of SAW, which is shown in Table 5. In the calculation, the three acids in AW were represented by the single fictitious acid with pKa of 4.54 (see Table 7). The measured concentrations of Na+, K+, Mg2+ and Ca2+ in SAW-1, SAW-2 and SAW-3 after the leaching were converted to equivalent concentrations [M+], which was defined by [M+] = [Na+] + [K+] + 2[Mg2+] + 2[Ca2+]. It was preliminarily found that the calculated pH was clearly higher than measured (for example, 2.69 (calcd.) vs 2.37 for SAW-3 after the leaching). Such overestimation suggested that the leaching occurred with the following two different types of reactions.
|
(Type I)
AH+RM=
M
+
+
A
-
+RH
(Type II)
M
+
X
-
=
M
+
+
X
-
|
The type (I) reaction represents ion exchange between organically bound M+ in TSD and acid (AH). R represents functional groups such as carboxyls (COO–). This type of reaction consumes the acid forming the conjugate base (A–). The other type of reaction is simply dissolution of water-soluble salt with no acid consumption. Table 8 compares the measured pH of SAW with that calculated by assuming that 41.9% of M+ was leached by Type (I) reaction while 58.1% was just dissolved hardly influencing the pH of SAW. It seemed that M+X– was present in the matrix of TSD as salt such as chloride, carbonate and sulfate. This assumption is reasonably accepted because it explains the reason why the leaching with water removed only small portions of Na, Mg and Ca (10–15%). It was believed a substantial portion of the above-mentioned inorganic salt was inaccessible to water and the acids other than SAW.
Table 8. Comparison of calculated history of pH of SAW with measured pH.
| Status of SAW | calculated pH | measured pH |
|---|
| SAW-1_b.l. | 1.95 | 1.95 |
| SAW-1_a.l. | 2.11 | 2.08 |
| SAW-2_a.l | 2.25 | 2.24 |
| SAW-3_a.l | 2.37 | 2.37 |
b.l. and a.l.; before/after use in leaching, respectively.
As already mentioned in Section 3.1, the total amount of AcA, FA and PA from the torrefaction was 5.4 times (on the mol-equivalent basis) that of the AAEM species that had been removed from TSD. However, this was insufficient for verifying the applicability of the leaching with AW as an industrial process. In this section, therefore, a process schematically shown in Fig. 13 is simulated numerically and discussed. The followings are the characteristics of the process, (a) to (h). These were assumed in the simulation.
(a) The torrefaction produces 76.3 kg TSD and 16.5 kg AW together with heavy bio-oil and non-condensable gases from 100 kg-dry SD, which is defined as 1 mass unit (m.u.).
(b) 1519.2 kg AW (AW0) is produced from the torrefaction of 92 m.u. SD in advance of this process.
(c) The leaching of AAEM species from TSD accepts 76.3 kg TSD and 1535.7 kg AW, and it is operated batchwise. The AW/TSD mass ratio is 19.9, which is equivalent to that employed in the leaching experiments.
(d) The 1535.7 kg AW consists of 206.1 kg (3.485 kmol) organic acid with pKa = 4.54, 604.8 kg non-acid organic compounds and 724.8 kg water.
(e) The contents of Na, K, Mg and Ca in TSD are the same as those shown in Table 2. Their removal rates are the same as those obtained with SAW-1 (see Fig. 2). The amount of removed AAEM species is 0.00695 kmol-equivalent, 41.9 and 58.1% of which are attributed to ion-exchanged cations and salts, respectively.
(f) After the leaching, the AW/TSD mixture is separated to the spent AW and clean TSD with no material loss.
(g) A major portion of the spent AW with a mass of (1535.7–16.5 m) kg is recycled to the second batch leaching, while the other portion (16.5 m kg) is sent to the desalination that removes the salts of AAEM species by evaporation or another method. m is equal to or greater than 1.
(h) The desalinated AW is divided into two portions with 16.5 and 16.5 (m–1) kg mass, the latter of which is recycled to the second batch leaching. The former portion is sent to a process for recovering chemicals.
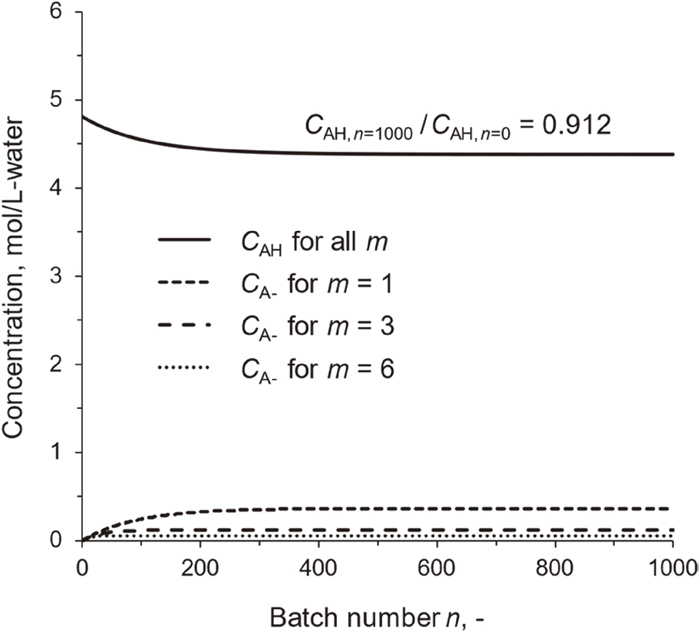
Figure 14 shows concentrations of the unconsumed organic acid (CAH) and carboxylate ions (CA–) as the consumed acid in the recycled AW as functions of batch number n. CAH and CA– decreases and increases with n, respectively, and then become steady at n ≈ 300, It is also seen that increasing m suppresses accumulation of the carboxylate ions together with AAEM ions. m = 1 indicates no portion of the spent AW is sent to the desalination. Thus, the recycling of AW makes the AAEM removal sustainable. Figure 15 presents the change in pH of the recycled AW at steady state. The pH at m = 1 (3.46) is higher than that of the initial AW by 1.5. It would be difficult at such high pH to remove the AAEM species as much as SAW-1, -2 and -3. The accumulation of carboxylate ions, even if CA– is much lower than CAH, causes great increase in pH, and this is a common nature among weak acids. The desalination is therefore effective for lowering pH. Increasing m to 10 results in the steady pH of 2.46, which is close to that of SAW-3 (2.37).
A conventional way of the desalination is to simply evaporate water, acids and other organic compounds leaving the salts as solid. The authors’ previous studies31,47,48) demonstrated that water-rich light bio-oils from the biomass pyrolysis, which were recovered by a method very similar to that adopted in this work, were evaporated completely at temperatures well below 200°C. Then the heat required for complete evaporation of AW was estimated from the mass fractions and standard heats of vaporization of all the components. The result is shown in Table S3. The overall standard heat of vaporization of AW was estimated as 1.51 MJ/kg. The relationship between the heat required for the vaporization of AW is plotted against m in Fig. 16. The heat is given by 1.24 (m–1) %-HHV of SD, and it seems to be within an acceptable range even if m = 10.

The discussion developed in this section has shown that the proposed process of removing AAEM species with AW is technically feasible. However, verification of the process concept should be done experimentally in the future work.


