Abstract
The three-dimensional aggregated structural models of two types of coals, A and B, were constructed. It is found that the density and the Tg of the models were qualitatively consistent with values obtained experimentally. The Tg of coals A and B calculated using the model structures are 315°C and 328°C, respectively. The effect of temperature on the distribution of cohesive energy was quantitatively elucidated using the three-dimensional aggregated structural models. The cohesive energy density (CED) of coal B was greater than that of coal A at temperatures <Tg. However, at temperatures >Tg, the CED of coal A is comparable to that of coal B. This implies that the molecules are more strongly aggregated in coal B than in coal A at low temperatures due to hydrogen bonding, and the intermolecular interaction is considered to have gradually relaxed above the Tg. It is concluded that differences in the molecular and cohesive structures of the coals led to differences in the distribution of van der Waals energy and electric energy at different temperatures. The van der Waals energy changed from attraction to repulsion at about 450°C and 285°C in coal A and B, respectively. Electric energy remained an attractive force as the temperature increased. The mechanism of the 13°C difference in the calculated Tg of each coal can be explained by the temperature change in the intermolecular force distribution. Therefore, this three-dimensional aggregated structural model can be used to understand the thermal behavior of aggregated molecules, such as coal thermoplasticity.
1. Introduction
Coal has special physical and chemical properties, as indicated by its softening, melting, gasification, and dilatation. Many researchers have focused on the chemical structure of bituminous coal and constructed experimental chemical structural research models. Historically, in the early days of molecular structural analysis of coal, a molecular model1) was constructed by X-ray analysis, which was a model with condensed aromatic rings indicated diffraction patterns. The Shinn’s model,2) which is now widely accepted, consists of two components, a low molecular weight component obtained by Soxhlet extraction of pyridine and a solvent-insoluble macromolecule, indicating that coal models are becoming more sophisticated as analytical methods become more sophisticated.
The noncovalent bonds between coal molecules, first described by Kovac and Larcen’s model,3) affect its coking properties, including dilatation. γ component theories4,5) and the metaplast theory6,7) explain that an increase in low-molecular-weight components above 360°C–420°C dominates the coking properties. This implies that these compounds, which are key for dilatation and fluidity, must be generated by the relaxation of the aggregated structure of coal. To simulate the relaxation of aggregated structures more accurately, it is important to describe molecular structures based on reliable information obtained from experimental analyses. Therefore, we prepared coal fractionated samples according to the extraction procedure shown in Fig. 1. We also constructed two kinds of coal models8) using reliable molecular weights calculated by gel permeation chromatography (GPC) using new standard materials and a supporting computer program developed by Sato.9) These models are shown in Fig. 2.

Therefore, for coals, both two-dimensional structural models and three-dimensional aggregated structural models are important for understanding intermolecular forces. Recently, due to developments in computer simulations, chemical structural models for coals have expanded from two to three dimensions.10,11) This has facilitated descriptions of the noncovalent bonds between aggregated molecules. Three-dimensional coal models constructed by Carlson,12) Faulon and co-workers,13,14) and Takanohashi and co-workers15,16) have enabled the calculation of three-dimensional minimum energy conformations for different coals. They found that van der Waals interactions and hydrogen bonding were the main interactions between coal molecules.
On the other hand, from a practical point of view, it is essential to understand the chemical interactions between binder molecules and coal in order to develop coal utilization technology for advanced coke strength control.17) Based on previous studies, Ashida et al. developed a low grade coal reforming technology to expand applicable coal resources for coke making into the low-grade coal with an average number of 1–2 aromatic rings.18,19) Sakimoto et al. investigated the relationship between the chemical structure of binder derived from low-grade coals and coke strength and found a relationship between the number of aromatic rings in the binder and coke strength.20) Furthermore, Koyano et al. reported that when various polycyclic aromatic hydrocarbon compounds were added to blended coals as model substances for coking agents, strength enhancement effects were obtained in case of materials with four aromatic rings, and the effects increased as the number of rings increased. In addition, a comparison of the same number of aromatic rings showed that the strength-improving effect of the peri-type model material was higher than that of the kata-type model material.21) In the evaluation of coal and binder combinations, the effects of binder on coke quality were found to be dispersed.22) The effect of aromatic ring number of coal and binder molecules on fluidity23) were evaluated, and van der Waals forces were considered to affect fluidity.23) In recent years, chemical structure analysis has made it possible to quantify changes in the number of aromatic rings in coal and semi-coke during carbonization, by high-resolution solid-state nuclear magnetic resonance (NMR),24) and to observe single molecules in binders using microscopy.25) In order to promote further efficient utilization of binder in the future, it is necessary to further understand the basic softening and melting mechanism, so that construction of a three-dimensional coal structure model required firstly which enables us to evaluate the relaxation process of the cohesive structure of coal alone. None of the three-dimensional models of coal representing the cohesive structure constructed so far has evaluated the effect of intermolecular forces in coal on thermophysical properties.
The purpose of this study was to determine the degree to which intermolecular forces in the aggregated structure of coal function as key factors in coking properties. In the current paper, three-dimensional aggregated structural models for two different kinds of coal were constructed and intermolecular forces were estimated.
2. Experimental
2.1. Preparation of the Coal Sample Extractions
Two kinds of bituminous coals, A and B, with considerably different maximum dilatation (Max D) values, were analyzed according to JIS M 8801:2008. The coals were ground to <150 μm for sub-sequential analyses. The results of the proximate and ultimate analyses and the Max D values are listed in Table 1. After being dried in a vacuum at 80°C for 12 h, the coal samples were extracted with a mixed solvent (CS2/N-methyl-2-pyroridone) under ultrasonic irradiation at room temperature (20°C–25°C). The residues were labeled as magic solvent-insoluble (MI) fractions. The obtained extracts were fractionated with acetone and pyridine to form acetone-soluble (AS), pyridine-soluble (PS), and pyridine-insoluble (PI) fractions. The PS, PI and MI fractions were washed with acetone, and the AS fraction was washed with mixed solvent (1:4 acetone to water by volume). All the fractions (AS, PS, PI and MI) were dried under vacuum at 120°C for 12 h to remove the solvent from the extracts and residue. The ratio of each fraction is shown in Table 2.
Table 1. Coal sample proximate and ultimate analyses (daf; dry ash free, db; dry base), maximum dilatation (MD), and maximum fluidity (MF) by Gieseler plastometer.
| Coal | Ultimate analysis (mass% d.a.f.) | Proximate analysis (mass% d.b.) | MaxD (%) | MF
(log DDPM) |
|---|
| C | H | N | S | Odir* | Ash | VM |
|---|
| A | 84.6 | 5.0 | 1.9 | 0.8 | 7.8 | 8.9 | 28.8 | 218 | 3.88 |
| B | 81.8 | 5.6 | 2.0 | 0.5 | 10.0 | 8.6 | 36.3 | 22 | 2.34 |
Table 2. Yields of acetone-soluble (AS), pyridine-soluble (PS), pyridine-insoluble (PI), and magic solvent-insoluble (MI) fractions (daf; dry ash free, db; dry base).
| Coal | Residue ratio (% d.a.f.) | Extract fraction (% d. a. f.) |
|---|
| MI | AS | PS | PI |
|---|
| A | 61.8 | 4.7 | 15.1 | 20.3 |
| B | 73.6 | 7.1 | 17.8 | 0.4 |
The analytical methods and structural analysis data for the coal extractions and residues reported in our previous research8) are summarized in Table 3. The structural parameters of aromaticity fa, degree of aromatic ring condensation Har/Car, and degree of aromatic ring substitution (σ) were obtained based on 1H NMR and 13C NMR spectra and ultimate analysis. The solid state 1H NMR spectrum of the MI fraction was curve-fitted and separated into four types of hydrogen (Ha, Hα, Hβ, and Hγ), as in the liquid state 1H NMR spectra. The mean molecular weight (Mw) was determined by GPC. New standard materials with structures similar to coal extracts, synthesized using the coupling reaction, were adopted for the GPC to obtain a more accurate mean Mw.8)
Table 3. Chemical structural parameters of the extraction and residue models of coals A and B.
| Coal | fractions | Mw | fa | Har/Car | σ | Ultimate analysis (% d. a. f) | Molecular Formula |
|---|
| C | H | N | S | O |
|---|
| A | AS | measured values | 796 | 0.69 | 0.66 | 0.44 | 86.1 | 6.8 | 1.9 | 2.6 | 4.4 | – |
| calculated parameters | 796 | 0.71 | 0.62 | 0.39 | 87.5 | 6.7 | 1.8 | 0 | 4.0 | C58H53NO2 |
| PS | measured values | 2148 | 0.75 | 0.61 | 0.50 | 83.7 | 5.4 | 2.5 | 2.0 | 7.7 | – |
| calculated parameters | 2145 | 0.72 | 0.62 | 0.42 | 84.6 | 5.4 | 2.6 | 0 | 7.5 | C151H114N4O10 |
| PI | measured values | 2164 | 0.75 | 0.57 | 0.59 | 84.9 | 5.0 | 1.9 | 1.9 | 7.4 | – |
| calculated parameters | 2186 | 0.74 | 0.56 | 0.53 | 85.7 | 5.0 | 1.9 | 0 | 7.3 | C156H113N3O10 |
| MI | measured values | – | 0.75 | – | – | 83.3 | 4.8 | 1.9 | 0.8 | 9.1 | – |
| calculated parameters | 3003 | 0.74 | 0.64 | 0.44 | 83.2 | 4.8 | 1.9 | 1.1 | 9.1 | C208H144N4O17S |
| B | AS | measured values | 1054 | 0.51 | 0.78 | 0.55 | 83.7 | 6.8 | 2.1 | 0.5 | 6.9 | – |
| calculated parameters | 1081 | 0.53 | 0.80 | 0.56 | 83.3 | 6.7 | 2.6 | 0 | 7.4 | C75H72N2O5 |
| PS | measured values | 2560 | 0.71 | 0.75 | 0.52 | 81.3 | 5.4 | 2.6 | 0.5 | 10.2 | – |
| calculated parameters | 2569 | 0.69 | 0.77 | 0.50 | 81.4 | 5.4 | 3.3 | 0 | 10.0 | C174H138N6O16 |
| MI | measured values | – | 0.64 | – | – | 81.2 | 5.4 | 2.1 | 0.5 | 10.8 | – |
| calculated parameters | 3123 | 0.64 | 0.75 | 0.55 | 80.8 | 6.2 | 2.2 | 0.0 | 10.8 | C210H193N5O21 |
Material Studio (Version 8.0; BIOVIA) was used as the simulation software. The COMPASS II force field26) was used for the molecular dynamics calculations, and a DREIDING force-field calculation27,28) was carried out for comparison. The potential energy (E) of a molecule was defined by a combination of bonded torsions dependent on the covalent and noncovalent bonds between molecules and dependent only on distance, as shown in Eq. (1). The bonded torsions were defined as bond length torsion (Eb), bond angle torsion (Eθ), dihedral angle torsion (Eϕ), and inversion (Ei), while the noncovalent bonds consisted of van der Waals (Evdw), electrostatic (Eel), and hydrogen bonds (Ehb), according to previous research.29)
|
E=
E
b
+
E
θ
+
E
ϕ
+
E
i
+
E
vdw
+
E
el
+
E
hb
| (1) |
The procedural flow of the calculation is shown in Fig. 3. To optimize the potential energy in the constructed models, molecular mechanics (MM) were calculated, and charge modification was implemented. The molecular dynamics (MD) calculation for 5 ns (=NPT ensemble 1 fs × 5000 000 steps) was then used. The lowest energy structure was conformed, and the MM was recalculated to find the lower energy conformation. The obtained conformation was termed the energy-minimum structure (i.e., the most stable conformation for the chemical structural models).

The MD calculation was carried out from 0°C to 800°C to obtain the energy-minimum conformation structures for each fraction and whole coal model. The physical density of the coal was calculated by energy-minimum conformation models for each fraction and whole coal model at room temperature. The calculated glass transition temperature (Tgcalc), defined as the change point of the coefficient of thermal expansion, was estimated using the specific volume calculated in the temperature range of 0°C to 800°C according to previous research.30) The intermolecular forces of the energy-minimum conformation structures were calculated from 0°C to 800°C to determine the differences in the coking properties of the two kinds of coals. For the MD calculation, the molecular number of fraction models in one cubic cell of coal was defined as follows:
|
Coal A AS:PS:PI:MI=1:1:2:3,
Coal B AS:PS:MI=1:1:4.
|
The apparent real densities of the coals and fractions were evaluated using the gas replacement method31) and an ultrapycnometer (1000; Yuasaionics Corporation). A schematic diagram of the evaluation system is shown in Fig. 4. Helium was used to fill the samples and sample holders.
2.5. Differential Scanning Calorimeter Measurement
Differential scanning calorimetry (DSC; Shimadzu Corporation) of the coal and fractions was conducted under a nitrogen atmosphere, and the experimental glass transition temperature (Tgexp) was determined. The coal and fraction samples were heated at rates of 10, 30, and 50 K/min.
3. Results and Discussion
3.1. Densities of Each Fraction and the Whole Coal
Examples of the three-dimensional aggregated structural models of coals A and B are shown in Figs. 5(a) and 5(b). The cube in the figure shows the unit cell, in which the coal molecules are arranged. There are structures where the planes of the aromatic rings are partially parallel to each other. The parallel aromatic rings appeared to be clearly more present in coal A than in coal B. The experimental and whole coal densities of each coal A fraction and the whole coals are shown in Table 4. Although there was a small difference between the experimental and calculated temperatures, the calculated densities of each fraction agreed well with the experimental densities (within 6%). The MI residue fraction densities showed the largest difference between the calculated and experimental values compared to the AS, PS, and PI extracted fractions because the MI fraction contained an ash component. Each calculated PS, PI, and MI fraction density obtained by the COMPASS II force-field method was closer to the experimental value compared to the value calculated by the DREIDING force-field method. It was determined that the COMPASS II force-field method was better than the DREIDING force-field method for constructing the three-dimensional aggregated structural coal models, probably because the COMPASS II force-field method calculates a charge parameter that is not included in the DREIDING force-field method.26) Therefore, the charge parameter cannot be ignored for the accurate calculation of the cohesive structure of coal.

Table 4. Density of each fraction and whole coals.
| Coal | Fraction | Densities (g/cm3) |
|---|
| Experiment at 25°C | Calculated at 0°C (COMPAS II) | Calculated at 0°C (DREIDING) |
|---|
| A | AS | 1.20 | 1.19 | – |
| PS | 1.28 | 1.30 | 1.06 |
| PI | 1.30 | 1.30 | 1.20 |
| MI | 1.42 | 1.34 | 1.20 |
| Whole | 1.39 | 1.32 | – |
| B | Whole | 1.29 | 1.22 | – |
The DSC thermograms of the AS, PS, and PI coal fractions (heating rate 3 K/min) showed endothermic peaks at about 180°C–220°C, 220°C–360°C, and 310°C–520°C, respectively (Fig. S1). This suggests that these endothermic peaks were due to the relaxation of the aggregated coal structure, according to previous research.30,32) After that, the specific volume obtained from the calculations was plotted for each temperature in Fig. 6. Next, assuming that the specific volume before and after the phase transition shows a linear temperature dependence, two extrapolated lines were created, one for the low temperature side and the other for the high temperature side. The range of data to be extrapolated was the combination of plots that minimized the sum of the least-squares errors of the two lines. Furthermore, the intersection of the two lines obtained above was defined as the temperature at which the coefficient of thermal expansion changes, and was set as the glass transition temperature. The Tgcalc of the AS, PS, and PI fractions were 272°C, 380°C, and 421°C, respectively. Table 5 summarizes the Tgcalc and Tgexp for each fraction, and the qualitative trends of the Tgexp and Tgcalc were consistent: AS < PS < PI. Glass transition is a type of thermal relaxation of the cohesive structure. Therefore, it was considered that these fractions and simulated aggregated models qualitatively described the relaxation of extracted coal.

Table 5. Estimated glass transition temperature (
Tg) of acetone-soluble (AS), pyridine-soluble (PS), and pyridine-insoluble (PI) fractions of coal A, whole coal A, and whole coal B.
| Coal | fraction | Experiment | Calculated |
|---|
| A | AS | 180–220°C | 272°C |
| PS | 220–360°C | 380°C |
| PI | 310–520°C | 421°C |
| Whole | 313°C | 286°C |
| B | Whole | 327°C | 308°C |
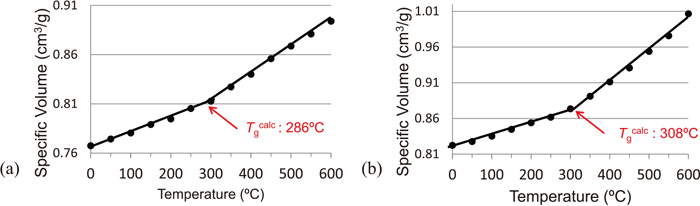
The specific volumes of each whole coal model at 0°C–600°C are shown in Figs. 7(a), 7(b). The DSC thermograms of coals A and B were measured at heating rates of 10°C, 30°C, and 50°C/min (Figs. S2 and S3) due to the broad width of the spectra obtained at 3°C/min. From the Tgexp corresponding to the respective heating rates, the Tgexp was calculated assuming a heating rate of 0°C/min (Fig. S4). The Tgcalc of coals A and B were 286°C and 308°C, respectively, and the Tgexp were 315°C and 328°C, respectively (Fig. 7). Both the experimental and calculated Tg of coal A were lower than those of coal B, and the difference between the Tgs of coals A and B was about 10°C–20°C. Since glass transition is a type of thermal relaxation of the cohesive structure, these three-dimensional aggregated structure models were considered to represent the relaxation of the entire coal well.
3.3. Intermolecular Forces in Coals A and B
The cohesive energy density (CED) of coals A and coal B were calculated as intermolecular forces from 0°C to 600°C, as shown in Fig. 8. The CED of coal A was larger than that of coal B at temperatures below the 350°C, and the CED of coal A was comparable to that of coal B at temperatures >350°C. This implied that the molecules in coal A were more strongly aggregated than those in coal B at low temperatures. Furthermore, it was considered that this strong aggregation must be released at temperatures above Tg.

The calculated total energy of the noncovalent bonds was divided into van der Waals energy and electric energy. The van der Waals energy was mainly due to electron localization in neutral molecules, such as the π electrons on an aromatic ring, and electrical interactions resulting from polar functional groups, such as when hydrogen bonding occurs. The CED distributions of coal A and coal B from 0°C to 600°C are shown in Fig. 9. The black, red, and blue lines in Fig. 9 show the decreasing rates of the CED of the total energy, van der Waals energy, and electric energy, respectively, in coals A and B. The same-color lines have the same slopes. The slopes of the red line, indicating van der Waals energy, in both coals A and B have the same formula at all temperature ranges, as written below the lines in Fig. 9. The CED formula of van der Waals Energy could be described as below. This showed that the degree of decrease in van der Waals energy with increasing temperature was not affected by coal type (i.e., the chemical structure of the coal).
|
van der Waals energy:CED(T)=CED(0)-(0.34 to 0.37) T
(coal A and coal B at 0°C–600°C)
|
The van der Waals energy in coal A was larger than that in coal B. This could have been because the number of aromatic rings per cluster in coal A (5 to 7) was larger than that in coal B (3 to 6), as shown in Fig. 2, considering the π-π interactions between aromatic rings. However, it was considered that charge-transfer interactions contributed more to the aggregated structure compared to van der Waals forces where different numbers of aromatic rings were stacked. The calculated intermolecular energy of the van der Waals force contributing to the stability of the aggregate structure in coals A and B at 0°C were 658.5 J/cm3 and 385.0 J/cm3, respectively.
However, the slopes of the blue lines, indicating electric energy in both coals A and B, have different formulas at more than 300°C, as written below the lines in Fig. 9. For Coal A, the tendency of the decrease in electrostatic attraction with increasing temperature could be well fitted by the linear approximation over the entire temperature range. On the contrary, as for Coal B, the slope of the dataset from 0°C to 300°C was similar to that of Coal A, but the slope above 350°C was deviated significantly from the tendency under 300°C, so that the temperature conditional expression was applied for Coal B as following equations. The CED formula of electric energy could be described as below. The slope for the coal B formula changed at about the Tg. It was therefore considered that the differences in the thermal properties of the coals were due to the difference in the composition of the cohesive energy.
|
Electric energy:CED(T)=CED(0)-0.13 T
(coal A at 0°C-600°C and coal B at 0°C–300°C)
CED(T)=CED(0)–0.26 T
(only coal B>300°C)
|
The electric energy of coal A was smaller than that of coal B. Electric energy is considered to mainly work between oxygen functional groups, and the number of oxygen atoms in coal B was greater than that in coal A, as shown in the structural models of coals A and B. Therefore, the electrostatic interaction of the aggregate structure of coal B was larger than that of coal A. The calculated intermolecular energy of the electrostatic force contributing to the stabilization of the aggregate structure in coals A and B at 0°C was 1341.8 J/cm3 and 1701.3 J/cm3, respectively.
The decreased ratio of the CED to van der Waals energy with increasing temperature was larger than that of the electrostatic energy as shown in Fig. 9. Van der Waals interactions are considered inversely proportional to the intermolecular distance to the 6th power (the repulsive force is inversely proportional to the intermolecular distance to the 12th power), whereas the electrostatic force is inversely proportional to the intermolecular distance (in the case of point charges). When van der Walls energy becomes negative, the van der Walls energy no longer contributes to the aggregated structure of the coal, as it changes from an attractive to a repulsive force. Focused only on the van der Waals energy, the temperature at which the stabilization energy due to van der Waals energy became zero was about 300°C for coal B and 446°C for coal A. In other words, over the softening temperature range of about 350°C–400°C, the van der Waals force worked as a repulsive force for coal B, while it worked as an attracting force for coal A. It was considered that coal B had fewer low-molecular-weight components that worked as softening materials than coal A, as discussed in our previous paper8) and such intermolecular forces were also responsible for the higher Tg in coal B compared to coal A.
This modeling did not consider thermal decomposition, that is, the cleavage of covalent bonds. It would be difficult to explain all the phenomena using only such a difference in intermolecular force. In addition, the electrostatic energy obtained by this calculation was more stable than the actual value, since the molecular structures aggregated by hydrogen bonding decompose at relatively low temperatures due to dehydration and thermal decomposition reactions. It should be noted that there is a possibility of overestimating the contribution of thermal decomposition to stabilization. However, the model showed that it is possible to evaluate the glass transition temperatures of two types of coal with different thermophysical properties. By quantifying the intermolecular forces dominating the cohesive structure, it is possible to consider intermolecular forces as one of the reasons for the different thermophysical properties of the two types of coal. As a result, the present paper shows that van der Waals forces are dominant in the cohesive structure relaxation.
4. Conclusion
Three-dimensional aggregated structural models of two types of coal were constructed using computer simulation. It was found that the tendency of the modeled densities was consistent with the actual densities of the samples. The qualitative trends of the Tgexp and Tgcalc values obtained for the AS, PS, and PI fractions, which comprise the three-dimensional aggregated structural models of coal A, were consistent. These fraction and aggregated structural models qualitatively described the relaxation trends of coal. The CED of coal B was larger than that of coal A at temperatures below the 350°C, and the CED of coal A was similar to that of coal B at temperatures above the 350°C. This implies that the aggregated interaction among molecules in coal A was stronger than that in coal B at low temperatures due to hydrogen bonding. It was concluded that the differences in the molecular and cohesive structures of the coal led to differences in the distribution of van der Waals energy and electric energy at different temperatures. The van der Waals energy decreased 0.34 and 0.37 J/cm3 for every 1°C increase, and it changed from attraction to repulsion at about 450°C and 285°C in coals A and B, respectively. Electric energy decreased from 0.13 to 0.26 J/cm3 for every 1°C increase, and it remained an attractive force, even with increasing temperature. The mechanism for the 13°C difference in the calculated Tg of the coal types was due to the composition of the cohesive energy, which reflected the distribution of the molecular structure.
References
- 1) W. Fuchs and A. G. Sandhoff: Ind. Eng. Chem., 34 (1942), 567. https://doi.org/10.1021/ie50389a010
- 2) J. H. Shinn: Fuel, 63 (1984), 1187.
- 3) J. Kovac and J. Larsen: Prepr. Pap. Am. Chem. Soc., Div. Fuel Chem., 22 (1977), 181.
- 4) A. H. Clark and R. V. Wheeler: J. Chem. Soc. Trans., 103 (1913), 1704.
- 5) T. Shinmura: Res. Rep. Fuel Res. Inst., Jpn., 14 (1931), 1 (in Japanese).
- 6) D. W. van Krevelen, C. van Heerden and F. Huntjens: Fuel, 30 (1951), 253.
- 7) S. Sarkar and S. G. Krishmen: Fuel, 42 (1963), 303.
- 8) Y. Hata, H. Hayashizaki, T. Takanohashi, T. Takahashi, K. Kanehashi and K. Norinaga: ISIJ Int., 62 (2022), 948. https://doi.org/10.2355/isijinternational.ISIJINT-2021-459
- 9) S. Sato: J. Jpn. Pet. Inst., 40 (1997), 46 (in Japanese).
- 10) M. R. Narkiewicz and J. P. Mathews: Energy Fuels, 22 (2008), 3104. https://doi.org/10.1021/ef700779j
- 11) V. D. Niekerk and J. P. Mathews: Fuel, 89 (2010), 73. https://doi.org/10.1016/j.fuel.2009.07.020
- 12) G. A. Carlson: Energy Fuels, 6 (1992), 771.
- 13) J. L. Faulon, G. A. Carlson and P. G. Hatcher: Energy Fuels, 7 (1993), 1062.
- 14) J. L. Faulon, J. P. Mathews, G. A. Carlson and P. G. Hatcher: Energy Fuels, 8 (1994), 408.
- 15) T. Takanohashi, M. Iino and K. Nakamura: Energy Fuels, 8 (1994), 395.
- 16) T. Takanohashi, M. Iino and K. Nakamura: Kagaku Kogaku Ronbunshu, 20 (1994), 959 (in Japanese).
- 17) T. Arima, S. Aizawa and S. Nomura: Tetsu-to-Hagané, 100 (2014), 110 (in Japanese). https://doi.org/10.2355/tetsutohagane.100.110
- 18) J. P. Mathews and A. L. Chaffee: Fuel, 96 (2012), 1.
- 19) R. Ashida, M. Morimoto, Y. Makino, M. Pattarapanusak, K. Miura, K. Kato and K. Ota: Tetsu-to-Hagané, 96 (2010), 240 (in Japanese). https://doi.org/10.2355/tetsutohagane.96.240
- 20) N. Sakimoto, T. Takanohashi, Y. Harada and H. Fujimoto: Tetsu-to-Hagané, 100 (2014), 134 (in Japanese). https://doi.org/10.2355/tetsutohagane.100.134
- 21) K. Koyano, K. Ueoka, T. Takanohashi, K. Fukada and K. Ota: Tetsu-to-Hagané, 96 (2010), 224 (in Japanese). https://doi.org/10.2355/tetsutohagane.96.224
- 22) Y. Dohi, K. Fukada, T. Matsui, M. Nagayama and N. Nanri: Proc. Conf. Coal Sci., 51 (2014), 18 (in Japanese). https://doi.org/10.20550/jiesekitanronbun.51.0_18
- 23) M. Kaiho and Y. Kodera: Proc. Conf. Coal Sci., 56 (2019), 68 (in Japanese). https://doi.org/10.20550/jiesekitanronbun.56.0_68
- 24) N. Takeda, L. Zhang, S. Kudo, J. Hayashi and K. Norinaga: Proc. Conf. Coal Sci., 52 (2015), 72 (in Japanese). https://doi.org/10.20550/jiesekitanronbun.52.0_72
- 25) K. Harano: Enermix, 98 (2019), 676 (in Japanese). https://doi.org/10.20550/jieenermix.98.6_676
- 26) H. Sun, Z. Jin, C. Yang, R. L. Akkermans, S. H. Robertson, N. A. Spenley, S. Miller and S. M. Todd: J. Mol. Model., 22 (2016), 47. https://doi.org/10.1007/s00894-016-2909-0
- 27) T. Takanohashi, M. Iino and K. Nakamura: Kagaku Kogaku Ronbunshu, 20 (1994), 959 (in Japanese).
- 28) S. L. Mayo, B. D. Olafson and W. A. Goddard III: J. Phys. Chem., 94 (1990), 8897.
- 29) T. Takanohashi, M. Iino and K. Nakamura: Energy Fuels, 12 (1998), 1168. https://doi.org/10.1021/ef980042x
- 30) T. Takanohashi, T. Yoshida and H. Kawashima: Fuel Process. Technol., 77 (2002), 53.
- 31) JIS R 1620:1995, Testing methods for particle density of fine ceramic powder (in Japanese).
- 32) Y. Yun and E. M. Suuberg: Fuel, 72 (1993), 1245. https://doi.org/10.1016/0016-2361(93)90337-2