Abstract
An Fe-0.15C-5Mn-0.5Si-0.05Nb medium-Mn steel annealed at 660°C and 685°C both exhibited inhomogeneous deformation with Lüders deformation and followed by an extremely high work hardening stage, but with different Lüders strain and work hardening behavior. In-situ neutron diffraction measurements during tensile tests were performed to investigate changes in the phase stresses, the stress contribution to the strength of the constituent phases, and the crystal orientation of austenite. The role of each constituent phase on the deformation behavior and the crystallographic orientation dependence of austenite stability were examined. Deformation-induced martensite showed excellent phase stress and contributed to the strength of approximately 1000 MPa at around tensile strength, which is close to macroscopic tensile strength. Although austenite contributed less to the strength, during Lüders deformation and work hardening stages, it continuously transformed to martensite as the deformation progressed, suggesting that it mainly contributed to the ductility of the steels through a transformation-induced plasticity effect. Austenite transformed to martensite during Lüders deformation almost regardless of its crystallographic orientations. However, there was a tendency for more 311 oriented austenite grains to remain parallel to the tensile direction.
1. Introduction
Medium-Mn steels proposed by Miller1) exhibiting remarkably high tensile strength and excellent total elongation are expected to be the next generation advanced high-strength steel plates. Typical medium-Mn steels contain 3–10 mass% Mn and consist of ultra-fine body-centered cubic (BCC) structured ferrite matrix (α) and metastable face-centered cubic (FCC) austenite (γ).1,2,3,4) Metastable γ transforms to deformation-induced martensite (α’) during deformation, resulting in the transformation-induced plasticity (TRIP) effect,5,6) which improves the ductility of the steel. The appropriate phase stability of γ against deformation is important for the TRIP effect. In low-alloyed TRIP steels, which is typical steels utilizing the TRIP effect, the following factors have been reported: the influence of test temperature,7,8,9) carbon content,10,11) the location and morphology,12,13) and crystal orientation of γ.8,14,15,16) The phase stability of γ is also important in medium-Mn steels, and factors affecting the phase stability have been investigated. The phase stability of γ in medium-Mn steels is enhanced by intercritical annealing in the α + γ region after cold rolling.1,17) The mechanical properties of medium-Mn steels vary significantly with the annealing temperature.1,2,17,18,19) At relatively low annealing temperatures of the α + γ region (600°C–650°C for steels containing 5 mass% Mn), the steel exhibits large Lüders elongation (> 10% strain) and total elongation, but work hardening rate is low. In contrast, annealing at a relatively high temperature of the α + γ region (660°C–690°C for steels containing 5 mass% Mn) reduces elongation and increases tensile strength and work hardening. These differences in deformation behavior have been associated with the phase stability of γ.17,18) The phase fraction of γ decreases at relatively low annealing temperatures in the α + γ region, whereas it increases at relatively high annealing temperatures. The concentration of Mn in γ decreases with the increasing phase fraction of γ.17,18,20) In other words, higher annealing temperatures decrease the phase stability of γ and increase the phase fraction of deformation-induced α’. Because medium-Mn steels annealed at relatively low temperatures exhibit inhomogeneous deformation behavior with large Lüders elongation, various methods have been applied to elucidate the relationship between the inhomogeneous deformation behavior and deformation-induced martensitic transformation. For example, the macroscopic strain distribution on the specimen surface has been measured by digital image correlation (DIC),2,19,21,22,23) infrared thermography,18) in-situ observation during tensile deformation using synchrotron radiation X-rays,23,24,25,26) and neutron beams.27) In-situ synchrotron X-ray observations revealed that the lattice strain distribution and the phase fraction of γ decrease with the passage of Lüders deformation.24,25) However, reports on the stress partitioning behavior between the phases during Lüders deformation and on the phase stresses of deformation-induced α’ are limited,26,27,28) and the deformation behavior of deformation-induced α’ in medium-Mn steels is unclear. In addition, the effects of each constituent phase are unknown on the high tensile strength and work hardening that occurs when the phase stability of γ decreases by relatively high-temperature annealing, and the effect of crystallographic orientation on the stability of γ.
In-situ neutron diffraction during tensile deformation is a technique that enables the simultaneous evaluation of changes in phase stress, phase fraction, and crystallographic orientation of each constituent phase. In low-alloyed TRIP steels, the phase stresses of not only α and γ but also the deformation-induced α’ have been estimated.13,14,29,30) Here, medium-Mn steels were annealed at a relatively high temperature in the α + γ phase region to prepare steels with high amounts of retained γ, which has low phase stability. In-situ neutron diffraction measurements during tensile deformation were performed to clarify the role of each constituent phase on stress partitioning, work hardening, and stress contribution to the strength and evaluate the effect of crystallographic orientation on the phase stability of γ. Since the deformation may be inhomogeneous with the formation of Lüders and Portevin-Le Chatelier (PLC) bands, the strain distribution on the specimen surface was measured by the DIC method.
2. Experimental Procedures
2.1. Preparation of Steel Samples
A 0.15C-0.44Si-4.95Mn-0.046Nb steel (in mass%) was used for the test steel. The steel was cold-rolled, and then, the steel plates were held at 700°C for 120 s and air-cooled to obtain the α + α’ duplex phases. Subsequently, the plates were annealed in the α + γ region at 660°C or 685°C for 30 min, and air-cooled. Hereafter, the samples obtained from the intercritical annealing at each temperature are referred to HT660 and HT685, respectively. Specimens for tensile test and microstructural observation were obtained from the heat-treated steel plates using a wire-cut electric discharge machine. Microstructural observations were performed on the plane perpendicular to the rolling direction (RD). After polishing the RD plane surface of the specimen with emery paper (#240 to #4000), electropolishing was performed using ethanol perchlorate (perchloric acid: ethanol = 1: 9) maintained at −15°C for 30 s at a voltage of 33 V. The RD plane surface of the polished specimens was observed using the electron backscattered diffraction (EBSD) method, with an acceleration voltage of 15 kV, a field of view size of 10 μm × 10 μm, and a step size of 0.05 μm. Points with a confidence index (CI) of 0.05 or less were excluded as noise.
2.2. In-situ Neutron Diffraction during Tension
In-situ neutron diffraction measurements during tensile deformation were performed on the TAKUMI,31) a time-of-flight diffractometer dedicated to the investigation of engineering materials at BL-19 of the Materials and Life Science Experimental Facility (MLF) in the Japan Proton Accelerator Research Complex (J-PARC). Plate-type specimens with a parallel length of 25 mm, a parallel width of 4 mm, and a thickness of 1.3 mm as shown in Fig. 1(a) were used for the tensile test. Figure 1(b) shows a schematic of the experimental setups of the TAKUMI instrument. The detectors were positioned at ±90° to the incident neutron beam. Changes in the lattice spacing in the direction parallel (Axial) and perpendicular (Transverse) to the tensile loading direction (LD) can be measured by aligning the tensile specimen at 45° to the incident neutron beam. In this study, changes in lattice spacing parallel to the sample RD and the sample thickness direction (normal direction: ND) were measured. An incident neutron beam size and a detector field of view were defined using a 5 mm high × 5 mm width slit and a 5 mm width radial collimator, limiting the size of the observation area to 125 mm3. The gauge volume of the neutron diffraction region was approximately 4 mm × 1.3 mm ×
5
2
mm, depending on the specimen size and arrangement. The neutron beam intensity was 500 kW. The tensile test at 298 K was performed in step-increasing load control mode (holding time: 300 s) in the elastic region and by a continues crosshead speed control (initial strain rate: 1.3×10⁻⁵ s−1) until fracture. The neutron diffraction measurement data in the elastic region with load holding and in the plastic region up to the tensile strength sliced in 300 s intervals were used for the analysis. The in-situ DIC method was applied to measure macroscopic strain. A random black-and-white speckle pattern was painted on the specimen surface. Images for DIC analysis were taken every 1 s during the tensile test. The DIC analysis was performed using VIC-2D software. The subset size was 27 pixels, and the step size was 9 pixels.

Fig. 1. Geometry of tensile test specimen used in this study (a) and schematic illustration of experimental setups of the TAKUMI instrument (b). (Online version in color.)
The neutron diffraction measurement data were analyzed using Z-Rietveld software.32) α’ was treated as a BCC phase with a larger lattice constant than α, with broad peaks. In addition, because α’ is formed by deformation-induced transformation, the analysis was performed assuming the presence of α’ after the analysis point where the decrease in phase fraction of γ was confirmed. The phase fractions of each constituent phase were obtained by averaging the phase fractions in a direction parallel to the LD and ND (axial and transverse), which were determined from the Rietveld refinements applied by the software. The lattice spacings of several hkl peaks of each constituent phase were obtained by a single-peak-fitting method. The lattice strains of several hkl peaks (
ε
i, 11
hkl
) in the LD were estimated as follows.
|
ε
i, 11
hkl
=(
d
i
hkl
-
d
i, 0
hkl
)/
d
i, 0
hkl
| (1) |
where,
d
i
hkl
is the hkl lattice spacing during deformation and
d
i, 0
hkl
is the hkl lattice spacing before deformation. i represents α, γ, or α’, and 11 means the direction parallel to the tensile direction. Based on Hooke’s law, the phase stress can be evaluated using the average lattice strain (phase strain). The Rietveld refinement and Pawley method often determine phase strain, but it can be difficult to ignore the effects of intergranular stresses during deformation. Therefore, in this study,
ε
α, 11
211
,
ε
α', 11
211
, and
ε
γ, 11
311
were used to evaluate the phase stresses of α, α’, and γ. (211) plane of the BCC and (311) plane of the FCC structures are known to reflect the average change in macroscopic elastic strain during deformation.33,34) Originally, six normal strains in different directions were required to determine the phase stress using elastic strain. However, two normal strains, perpendicular and parallel to the tensile direction, can be used to derive a reliable phase stress in the uniaxial tensile condition. However, the grains contribute to
ε
i, 11
hkl
and
ε
i, 22
hkl
(22: direction perpendicular to the LD) are different. In this study, the phase stress was derived using the strain parallel to the LD (
ε
i, 11
hkl
). If it is difficult to use
ε
i, 22
hkl
, the phase stresses (σi, 11, i=α, γ, α’) in the LD can be obtained by the following Eqs. (2) and (3).
|
σ
i, 11
=
E
i
211
⋅
ε
i, 11
211
| (2) |
|
σ
γ, 11
=
E
γ
311
⋅
ε
γ, 11
311
| (3) |
where,
E
i
211
is the diffraction elastic constant of α and α’.
E
γ
311
is the diffraction elastic constant of γ. The diffraction elastic constants used in the analysis were obtained from the relationship between the applied true stress in the elastic region and
ε
α, 11
211
and
ε
α', 11
211
. For
E
α'
211
, the same value as for α was applied. The obtained values are summarized in Table 1.
Table 1. Applied values of
E
α
211
and
E
γ
311
.
| Steel |
E
α
211
|
E
γ
311
|
|---|
| HT660 | 166774 | 155366 |
| HT685 | 170562 | 152399 |
Although the phase stresses can be estimated from the lattice spacing of each constituent phase as described above, there is no deformation-induced α’ in the microstructure before deformation. Thus,
d
α', 0
hkl
cannot be obtained from the peak profile before the deformation. Here,
d
α', 0
hkl
was determined from the stress equilibrium approach, in which the sum of the phase stresses weighted by the phase fraction of each phase is equal to the applied true stress.30) The following equation expresses the stress equilibrium.
|
f
α
⋅
σ
α, 11
+
f
γ
⋅
σ
γ, 11
+
f
α'
⋅
σ
α', 11
=
σ
app
| (4) |
where, fi(i=α, γ, α’) is the phase fraction, and σapp is the applied true stress. fi can be obtained from peak profile analysis by the Rietveld refinement. σα, 11 and σγ, 11 are estimated from Eqs. (2) and (3). σapp can be derived from macroscopic stress-strain curves. Therefore,
d
α', 0
hkl
can be represented by combining Eqs. (1), (2), and (4) as follows.
|
d
α', 0
hkl
=
d
α'
hkl
/{
(
σ
app
-
f
α
⋅
σ
α, 11
-
f
γ
⋅
σ
γ, 11
)/
f
α'
⋅
E
α'
211
+1
}
| (5) |
d
α', 0
hkl
was calculated at each analysis point. The average value of
d
α', 0
hkl
at all analysis points was then used as the lattice spacing of α’ before tensile deformation (
d
¯
α', 0
hkl
). σα’, 11 was derived using
d
¯
α', 0
hkl
.
3. Results and Discussion
3.1. Initial Microstructure and Diffraction Pattern
Figure 2 shows the image quality (IQ) maps overlaid on the phase maps of HT660 and HT685 to obtain phase fractions. The phase fractions of HT660 and HT685 were 24.2% and 9.0%, respectively. Both steels comprised ultrafine α and γ grains less than 2 μm in diameter. Some α grains showed low IQ values. Such grains are suggested to be α’ and are considered that grains transformed owing to the lower stability of γ. HT660 is expected to be higher in phase stability of γ than HT685, as HT660 has a higher phase fraction of γ and fewer grains of low IQ values than HT685.

Fig. 2. EBSD phase maps overlaid onto their image quality maps of (a) HT660 and (b) HT685. (Online version in color.)
Figures 3(a) and 3(b) show the diffraction patterns of HT660 and HT685 before deformation obtained from LD and ND (axial and transverse), respectively. The diffraction patterns are before deformation, thus there is no deformation-induced α’. The γ phase fractions of HT660 and HT685 obtained from each diffraction pattern were 45.3% and 47.7%, respectively. Therefore, the grains of low IQ values observed in Figs. 2(a) and 2(b) are considered to be α’ resulting from polishing or exposure to the sample surface, suggesting that the grains exist as γ inside the sample. A comparison of axial and transverse diffraction patterns in each steel shows a higher peak intensity at 110-α in the axial direction, suggesting that α exhibited a rolling texture. By contrast, γ did not show a remarkable difference in the diffraction pattern between axial and transverse as in α. However, the larger 111-γ and 200-γ in the axial and 220-γ in the transverse suggest that γ had a weak rolling texture.

Fig. 3. Initial diffraction patterns for the direction parallel or perpendicular to loading direction (LD) of (a) HT660 and (b) HT685.
Figure 4(a) shows the nominal stress-nominal strain curves for HT660 and HT685. The yield stress (0.2% proof stress) was 502 MPa for HT660 and 178 MPa for HT685, with HT685 showing a considerably lower yield stress. Both steels exhibited Lüders deformation after macroscopic yielding, whereas HT685 showed an increase in nominal stress even during Lüders deformation. After Lüders deformation, several serrations were observed during plastic deformation in HT660, while no such serrations were observed in HT685. HT660 fractured with necking after reaching tensile strength. HT685 satisfied the plastic instability condition but fractured almost without necking. Figures 4(b) and 4(c) show the work hardening rate and true stress of HT660 and HT685 plotted against true strain. Both steels showed extremely high work hardening rates after Lüders deformation. In the subsequent homogeneous deformation stage, up to approximately 5% strain, HT685 showed a higher work hardening rate than HT660. HT660 showed a large fluctuation in the work hardening rate corresponding to the serration.

Fig. 4. Nominal stress vs. nominal strain curves of test steels (a) and work hardening rate and true stress vs. true strain curves of (b) HT660 and (c) HT685. (Online version in color.)
Representative results for the strain distribution (εXX) and strain rate variation (dεXX) in the LD (transverse) on the specimen surface of HT660 during deformation are shown in Figs. 5(a) and 5(b). Each figure is numbered, corresponding to the data points of the image capture position in the nominal stress-nominal strain curve shown in Fig. 5(c). After the start of Lüders deformation, the propagation of the Lüders band was confirmed as shown in (2) to (4) within Figs. 5(a) and 5(b). At the moment of serration, indicated by (5) in Fig. 5(c), there was a region of locally high strain rate, propagating in direction in the opposite to the Lüders deformation, as shown in (5) in Fig. 5(b). Here, (5) in Fig. 5(b) is the state just before propagation is no longer observed. This region propagated from one end of the specimen to the other in approximately 3 s. The region of a locally high strain rate is presumed to be the PLC band. In (6) and (7) of Fig. 5(b), regions of slightly higher strain rate were distributed throughout the specimen, but there was no indication of propagation of such regions, suggesting that the deformation was relatively uniform in the near tensile strength when work hardening had progressed. These data suggest that inhomogeneous deformation forming Lüders and PLC bands occurred in HT660.

Fig. 5. (a) strain and (b) strain rate contour maps during tensile test of HT660. (c) nominal stress vs. nominal strain curves of HT660. The numbers in (a) and (b) correspond to the numbered data points in (c). (Online version in color.)
Figures 6(a) and 6(b) show the changes in the strain distribution (εXX) and strain rate (dεXX) at the specimen surface during deformation of HT685 along the LD. Numbers in the nominal stress-nominal strain curve of HT685 shown in Fig. 6(c) was plotted corresponding to the numbers indicated in Figs. 6(a) and 6(b). After macroscopic yielding, Lüders band propagated as shown in (2) to (4) in Figs. 6(a) and 6(b). The regions of higher strain behind the Lüders front were approximately equally spaced, as indicated by the black arrows in Fig. 6(a). It is expected that the deformation occurred outside the vicinity of the Lüders front, resulting in an increase in stress during the Lüders deformation. In the range from after the propagation of the Lüders deformation to fracture, the propagation of regions with locally high strain rates was not observed in HT685 as in HT660 shown in Fig. 5(b). In some medium-Mn steels, martensitic transformation occurs locally by forming local deformation bands, such as the PLC band.35) Because the phase stability of γ in HT685 is expected to be lower than in HT660, as discussed in a later section, it is thought that deformation-induced martensitic transformation can occur throughout the parallel sections of the specimen. As a result, the formation and propagation of PLC bands and instantaneous stress drop in the nominal stress-nominal strain curve were not observed due to the difficulty of local martensitic transformation. It is assumed that HT685 exhibits inhomogeneous deformation with Lüders deformation; however, after the Lüders deformation, it exhibits uniform deformation compared to HT660.

Fig. 6. (a) strain and (b) strain rate contour maps during tensile test of HT685. (c) nominal stress vs. nominal strain curves of HT685. The numbers in (a) and (b) correspond to the numbered data points in (c). (Online version in color.)
Yield stress, work hardening rate, and deformation behavior are expected to be strongly influenced by the phase stability of retained γ against deformation and are discussed in the next section, combined with the results for changes in the phase fraction of γ.
3.3. Changes in Phase Fraction of γ during Deformation
Figures 7(a) and 7(b) show the changes in the phase fraction of γ in HT660 and HT685 plotted against the applied true strain. The changes in true stress as a function of applied true strain are also shown in each figure. The dashed-dotted line in Fig. 7(a) represents the timing of the PLC band formation in the DIC analysis. The phase fraction of γ was almost constant for both steels in the elastic region. The γ fraction decreased rapidly during Lüders deformation. The strain at which the rapid decrease in γ fraction occurred was almost consistent between HT660 (3) in Fig. 5(a) and HT685 (3) in Fig. 6(a), where the Lüders front was located near the center of the specimen parallel section. Because of the neutron-irradiated region is the center of the parallel section, suggesting that when the Lüders front approached the area, a rapid change in γ fraction started to occur. Several examples of transforming a large fraction of γ with Lüders deformation have been reported.4,21,23,24,25,27) During Lüders deformation, the phase fraction of γ decreased from 44.0% to 9.3% in HT660 and 46.7% to 12.0% in HT685. After Lüders deformation, there was no significant change in the phase fraction of γ in HT660 up to approximately 3% strain. By contrast, after 3% strain, the phase fraction of γ decreased linearly against the applied true strain and became almost zero at approximately 10% strain. Although decreases in γ fraction owing to PLC band propagation have been reported for some medium-Mn steels,35) no apparent changes in γ fraction were observed during PLC band propagation in the present study. In HT685, the phase fraction of γ decreased linearly against the applied true strain from just after Lüders deformation to approximately 6% strain and became almost zero at 6% strain. The γ fraction after Lüders deformation was lower in HT660 than in HT685, whereas γ remained in HT660 until the later stage of deformation, suggesting that the phase stability of γ against deformation is higher in HT660 than in HT685. Because of the low phase stability of γ in HT685, it is considered that the γ was transformed at relatively low applied stresses. If the deformation-induced transformation of γ triggered macroscopic yielding, it would be expected that the extremely low yield stress of HT685 resulted from the easily occurring deformation-induced transformation of γ. However, the neutron-irradiated region is located ahead of the Lüders deformation front. Therefore, the relationship between phase stability of γ and yield stress must be investigated in more detail. HT685 showed a higher work hardening rate than HT660, suggesting that it is associated with lower phase stability of γ against deformation. In HT685, with relatively low phase stability of γ, it is assumed that most of γ transformed in the early stage of deformation (approximately between Lüders deformation to a few % strain), causing stress partitioning between the deformation-induced α’ and α matrix, leading to a high work hardenability. The mechanism of this high work hardenability will be discussed in more detail by evaluating the role of each constituent phase in Section 3.5.

Fig. 7. Changes in phase fraction of γ of (a) HT660 and (b) HT685 plotted against applied true strain. (Online version in color.)
Figures 8(a) and 8(b) show the relationship between phase stress and applied true stress in HT660. Figure 8(b) is an enlarged view of the elastic and Lüders deformation regions in Fig. 8(a). In each figure, a white open circle represent the phase fraction of deformation-induced α’, and the solid black line is a true stress-true strain curve. In the elastic region, the phase stresses of α and γ increased linearly with increasing applied true strain. After yielding, the amount of the deformation-induced α’ increased with respect to the applied true strain when the Lüders deformation propagated to the neutron-irradiated region. At this moment, the phase stress of α increased, and the phase stress of γ decreased. After the propagation of macroscopic Lueders deformation, the phase stresses of α, γ, and α’ all monotonically increased with increasing applied true strain. The phase stress of α’ significantly increased compared to that of the other phases. The analysis of the phase stress of γ became difficult above 10% strain when the phase fraction of γ was nearly zero, and the values were scattered. There were no significant changes in phase stresses before and after serration caused by the PLC bands.
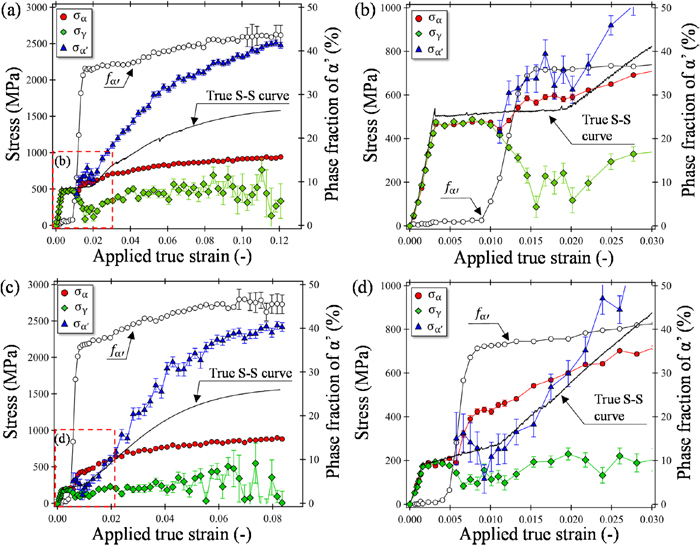
Fig. 8. Phase stresses of α, γ, and α’ of (a) HT660 and (c) HT685 with respect to applied true strain. Close-up views of (a) and (c) are shown in (b) and (d), respectively. (Online version in color.)
Figures 8(c) and 8(d) show the changes in phase stress and applied true stress in HT685 plotted against the applied true strain. Figure 8(d) is an enlarged view of the elastic and Lüders deformation regions in Fig. 8(d). In HT685, the phase stresses of α and γ increased slightly with respect to the applied true strain, in contrast to HT660, even before the Lüders deformation reached the neutron-irradiated region. When the Lüders front reached the neutron-irradiated region, the phase stress of α increased with increasing applied true strain, and the phase stress of γ decreased as in HT660. The phase stress of α’ was lower than α. The reason is discussed in Section 3.5. After macroscopic Lüders deformation, the phase stresses of α and α’ increased monotonically with respect to the applied true strain, especially the phase stress of α’ showed relatively high values. By contrast, the phase stresses of γ showed a slight increase compared to that of the other phases. The phase fraction of γ was nearly zero above 6% strain. Thus, the analysis was difficult, and the phase stress values showed a large scatter.
In HT660 and HT685, stress partitioning between α and γ occurred during Lüders deformation. During this local deformation, it was suggested that α behaves as the harder phase and γ as the softer phase. M. Zhang et al.24) performed synchrotron X-ray mapping measurements on 0.1C-10Mn steel to determine the lattice strain of γ ahead and behind Lüders front and reported that the lattice strain of γ decreases with the propagation of Lüders deformation. T. Hojo et al.25) investigated changes in lattice strains of α and γ in 0.1C-5Mn steel by in-situ observation during tension using synchrotron X-ray and revealed an increase in lattice strain of α and a decrease in lattice strain of γ during Lüders deformation. The changes in phase stress of γ during Lüders deformation in medium-Mn steels with relatively low phase stability of γ in the present study are expected to be similar to previous results. It is estimated that the contribution of γ to the strength during deformation is negligible, in contrast to low-alloy TRIP steels.30) Both HT660 and HT685, α’ showed a high phase stress compared to α, suggesting that the deformation-induced α’ contributed to the high tensile strength and work hardening rate.
3.5. The Role of Each Constituent Phase during Deformation
The stress contribution of constituent phases to the strength (
σ
i
cont
=
f
i
⋅
σ
i, 11
, i=α, γ, α'
) can be evaluated by weighting the phase stress (σi) with their phase fractions (fi). Figure 9 shows the stress contribution of each constituent phase of HT660 and HT685 plotted against the applied true strain. The area occupied by the bars of constituent phases at each analysis point represents the values of
σ
i
cont
. For HT660 shown in Fig. 9(a),
σ
α
cont
and
σ
γ
cont
showed almost the same values after the start of Lüders deformation. The
σ
α
cont
and
σ
α'
cont
increased and
σ
γ
cont
decreased with propagation of Lüders deformation through the neutron-irradiated region. It is suggested that the strength that was carried by γ was taken over by α’ when the Lüders deformation propagated. In the subsequent homogeneous deformation stage,
σ
γ
cont
increased slightly and then gradually decreased during plastic deformation, becoming almost zero after 10% strain. The
σ
α
cont
was approximately 334 MPa immediately after Lüders deformation, whereas it gradually increased with increasing applied true strain. Around the tensile strength, α was contributed to the strength of approximately 533 MPa. The
σ
α'
cont
was approximately 211 MPa just after Lüders deformation, and its value increased significantly with increasing applied true strain, showing a remarkably high value of 1030 MPa at around tensile strength. In HT685 shown in Fig. 9(b),
σ
α
cont
and
σ
γ
cont
showed almost the same values when the Lüders deformation started, whereas
σ
γ
cont
became almost zero after the Lüders deformation passed through the neutron-irradiated region. The values of
σ
α
cont
and
σ
α'
cont
increased with the passage of Lüders deformation, but the sum of these values exceeded the applied true stress. It is possible that the phase stress of α was overestimated when considering that the phase stress of α’ was low as shown in Fig. 8(d). The values of
σ
α
cont
and
σ
α'
cont
at the end of Lüders deformation were 257 MPa and 84 MPa, and around tensile strength were 485 MPa and 1031 MPa, respectively. Both HT660 and HT685, the stress contribution of γ to the strength was almost negligible after Lüders deformation. The reason may be attributed to the decrease in the phase fraction of γ owing to deformation-induced transformation and the reduction in the phase stress observed in Fig. 8. By comparing the values of
σ
α
cont
and
σ
α'
cont
of HT660 and HT685, almost no difference was found at around tensile strength. The macroscopic tensile strengths of HT660 and HT685 were almost identical, 1402 MPa and 1436 MPa, respectively, although the yield stress and work hardening behavior were different, suggesting that the stress contribution of α and α’ to the strength was comparable.

Fig. 9. Changes in fraction-weighted phase stresses of each constituent phase during tensile of (a) HT660 and (b) HT685. Those for α, γ, and α’ are colored with red, green, and blue, respectively. (Online version in color.)
It has been reported that α + α’ dual phase steels may exhibit high work hardening rate owing to the internal stress field generated by stress partitioning between the softer α matrix and harder α’.36) In HT660 and HT685, with a large amount of low phase stability of γ, the majority of γ transformed to α’ during Lüders deformation. After the propagation of Lüders deformation, it is thought that the stress partitioning between the softer α matrix and the harder deformation-induced α’ resulted in the extremely increased work hardenability. Consequently, the γ may not directly contribute to the strength but may contribute to enhanced work hardening via transforming into deformation-induced α’ in early deformation stages. By comparison of HT660 and HT685, it appears that the γ of HT685 is more unstable than that of HT660, resulting in deformation-induced α’ transformation at an early stage of deformation and a high work hardening rate just after the Lüders deformation. In addition, the γ remaining even after Lüders deformation gradually transformed to α’ with increasing strain, suggesting that γ contributed to the generation of the TRIP effect and improved ductility.
3.6. Influence of Crystallographic Orientation on the Phase Stability of γ
The changes in the relative integrated intensity in the LD of several hkl peaks of γ (
I
γ, LD
hkl
) with respect to the applied true strain was investigated.
I
γ, LD
hkl
were normalized to those obtained before deformation and to the specimen cross-section reductions during deformation. The
I
γ, LD
hkl
is difficult to estimate accurately when the phase fraction of γ decreases. Therefore,
I
γ, LD
hkl
was calculated in the range of up to 5% strain.
Figure 10(a) shows the changes in
I
γ, LD
hkl
of HT660 plotted against applied true strain. The
I
γ, LD
hkl
did not change in the range from the elastic region to before the propagation of Lüders deformation into the neutron-irradiated region. The
I
γ, LD
hkl
decreased regardless of orientation when it appeared the Lüders front had reached the neutron-irradiated region. After the propagation of Lüders deformation,
I
γ, LD
311
was slightly higher than in the other orientations. In the subsequent homogeneous deformation stage,
I
γ, LD
hkl
decreased with increasing applied true strain in each orientation. Figure 10(b) shows the changes in
I
γ, LD
hkl
of HT685 as a function of applied true strain. The
I
γ, LD
hkl
of HT685 did not change during elastic deformation and prior to arrival of the Lüders front at neutron-irradiated region as in HT660. When the Lüders deformation propagated through the neutron-irradiated region, a decrease in
I
γ, LD
hkl
occurred regardless orientation, but
I
γ, LD
311
was slightly higher than in the other orientation. In the subsequent homogeneous deformation stage,
I
γ, LD
hkl
of HT685 decreased regardless orientation with increasing applied true strain.

Fig. 10. Changes in relative integrated intensities of γ in (a) HT660 and (b) HT685 plotted against applied true strain. (Online version in color.)
Low-alloyed TRIP steels are prone to retain γ with <111> parallel to the LD (111-γ).8) S. Harjo et al.15) and R. Ueji et al.16) have pointed out that the reason for the remaining 111-γ, compared to other orientations, is thought to be due to the influence of elastic strain distribution depending on crystallographic orientation and reported that an elastically normalized Schmid factor can summarize it. In Medium-Mn steels in this study, most of γ transformed to α’ during Lüders deformation, with relatively high retained γ with <311> parallel to the LD (311-γ). However, the reason is not clear. During Lüders deformation, a deformation band appears at the side edge of the specimen and propagates to the opposite side.37) Therefore, the direction of the local principal stress may be different in the Lüders front than in uniaxial tension. It is necessary to examine not only in the LD but also in changes in the relative integrated intensity of γ in the TD and ND of several hkl peaks in order to clarify the influence of the direction of the local principal stress. The cause of the large amount of 311-γ remaining immediately after Lüders deformation is a subject for future investigation.
4. Conclusion
In this study, 0.15C-5Mn steel was annealed at 660°C and 685°C, which is in the α + γ phase region, to produce the steels with relatively low phase stability and high γ fractions. In-situ neutron diffraction measurements during tensile deformation were performed on the steels to investigate the phase stability of γ, the change in crystallographic orientation, stress partitioning behavior, and the role of each constituent phase during deformation. The results are summarized as follows.
(1) The tensile deformation of both HT660 and HT685 exhibited inhomogeneous deformation with Lüders bands followed by a homogeneous deformation stage with high work hardening rates.
(2) The γ showed low phase stability in both steels. The majority of γ transformed during Lüders deformation. After the propagation of Lüders deformation, γ transformed gradually with increasing strain, and nearly all of γ transformed to deformation-induced α’ before reaching the tensile strength.
(3) In both steels, stress partitioning between the phases occurred during Lüders deformation, and α behaved as the harder phase and γ as the softer phase. After Lüders deformation, the phase stresses of α and α’ monotonically increased with increasing strain, whereas the phase stress of γ hardly changed.
(4) Although the γ did not directly contribute to the strength, it appears that most of γ transformed to deformation-induced α’ during Lüders deformation, resulting in a high work hardening rate. It is thought that γ remaining after Lüders deformation contributed to the TRIP effect by gradually transforming during deformation.
(5) Immediately after the propagation of Lüders deformation, γ transformed regardless of orientation, but a relatively higher number of γ with <311> parallel to the LD remained. In the subsequent homogeneous deformation stage, all of the γ, regardless of orientation, transformed to deformation-induced α’ with the progress of deformation.
Acknowledgment
This study received financial support from the Japan Society for the Promotion of Science (grant No. 21K14418) and the Data Creation and Utilization Type Material Research and Development (No. JPMXP1122684766). The neutron diffraction experiments were performed at BL19 in the Materials and Life Science Experimental Facility of J-PARC (proposal No. 2019I0019).
References
- 1) R. L. Miller: Metall. Trans., 3 (1972), 905. https://doi.org/10.1007/BF02647665
- 2) S. Lee, S.-J. Lee and B. C. De Cooman: Acta Mater., 59 (2011), 7546. https://doi.org/10.1016/j.actamat.2011.08.030
- 3) T. P. Zhou, C. Y. Wang, C. Wang, W. Q. Cao and Z. J. Chen: Mater. Sci. Eng. A, 798 (2020), 140147. https://doi.org/10.1016/j.msea.2020.140147
- 4) M. Koyama, T. Yamashita, S. Morooka, T. Sawaguchi, Z. Yang, T. Hojo, T. Kawasaki and S. Harjo: ISIJ Int., 62 (2022), 2036. https://doi.org/10.2355/isijinternational.ISIJINT-2021-510
- 5) V. F. Zackay, E. R. Parker, D. Fahr and R. Bush: ASM Trans. Q., 60 (1967), 252.
- 6) I. Tamura: Tetsu-to-Hagané, 56 (1970), 429 (in Japanese). https://doi.org/10.2355/tetsutohagane1955.56.3_429
- 7) K. Sugimoto, M. Kobayashi and S. Hashimoto: Metall. Trans. A, 23 (1992), 3085. https://doi.org/10.1007/BF02646127
- 8) T. Yamashita, N. Koga and O. Umezawa: ISIJ Int., 58 (2018), 1155. https://doi.org/10.2355/isijinternational.ISIJINT-2018-033
- 9) N. Tsuchida, T. Tanaka and Y. Toji: ISIJ Int., 61 (2021), 564. https://doi.org/10.2355/isijinternational.ISIJINT-2020-378
- 10) B. C. De Cooman: Curr. Opin. Solid State Mater. Sci., 8 (2004), 285. https://doi.org/10.1016/j.cossms.2004.10.002
- 11) Y. Onuki, K. Umemura, K. Fujiwara, Y. Tanaka, T. Tomida, K. Kawano and S. Sato: Metals, 12 (2022), 957. https://doi.org/10.3390/met12060957
- 12) H. Matsuda, H. Noro, Y. Nagataki and Y. Hosoya: Mater. Sci. Forum, 638–642 (2010), 3374. https://doi.org/10.4028/www.scientific.net/MSF.638-642.3374
- 13) N. Tsuchida, T. Tanaka and Y. Toji: ISIJ Int., 60 (2020), 1349. https://doi.org/10.2355/isijinternational.ISIJINT-2019-751
- 14) S. Harjo, N. Tsuchida, J. Abe and W. Gong: Sci. Rep., 7 (2017), 15149. https://doi.org/10.1038/s41598-017-15252-5
- 15) S. Harjo, T. Kawasaki, N. Tsuchida, S. Morooka and W. Gong: ISIJ Int., 61 (2021), 648. https://doi.org/10.2355/isijinternational.ISIJINT-2020-503
- 16) R. Ueji, A. Shibata, K. Ushioda, Y. Kimura, T. Ohmura and T. Inoue: Scr. Mater., 194 (2021), 113666. https://doi.org/10.1016/j.scriptamat.2020.113666
- 17) P. J. Gibbs, E. De Moor, M. J. Merwin, B. Clausen, J. G. Speer and D. K. Matlock: Metall. Mater. Trans. A, 42 (2011), 3691. https://doi.org/10.1007/s11661-011-0687-y
- 18) S. Lee, S.-J. Lee, S. S. Kumar, K. Lee and B. C. De Cooman: Metall. Mater. Trans. A, 42 (2011), 3638. https://doi.org/10.1007/s11661-011-0636-9
- 19) M. Callahan, O. Hubert, F. Hild, A. Perlade and J.-H. Schmitt: Mater. Sci. Eng. A, 704 (2017), 391. https://doi.org/10.1016/j.msea.2017.08.042
- 20) E. De Moor, D. K. Matlock, J. G. Speer and M. J. Merwin: Scr. Mater., 64 (2011), 185. https://doi.org/10.1016/j.scriptamat.2010.09.040
- 21) X. G. Wang, L. Wang and M. X. Huang: Mater. Sci. Eng. A, 674 (2016), 59. https://doi.org/10.1016/j.msea.2016.07.054
- 22) X. G. Wang, L. Wang and M. X. Huang: Acta Mater., 124 (2017), 17. https://doi.org/10.1016/j.actamat.2016.10.069
- 23) B. Sun, Y. Ma, N. Vanderesse, R. S. Varanasi, W. Song, P. Bocher, D. Ponge and D. Raabe: Acta Mater., 178 (2019), 10. https://doi.org/10.1016/j.actamat.2019.07.043
- 24) M. Zhang, L. Li, J. Ding, Q. Wu, Y.-D. Wang, J. Almer, F. Guo and Y. Ren: Acta Mater., 141 (2017), 294. https://doi.org/10.1016/j.actamat.2017.09.030
- 25) T. Hojo, M. Koyama, B. Kumai, Y. Shibayama, A. Shiro, T. Shobu, H. Saitoh, S. Ajito and E. Akiyama: Scr. Mater., 210 (2022), 114463. https://doi.org/10.1016/j.scriptamat.2021.114463
- 26) M. Lamari, S. Y. P. Allain, G. Geandier, J.-C. Hell, A. Perlade and K. Zhu: Metals, 10 (2020), 1335. https://doi.org/10.3390/met10101335
- 27) P. J. Gibbs, B. C. De Cooman, D. W. Brown, B. Clausen, J. G. Schroth, M. J. Merwin and D. K. Matlock: Mater. Sci. Eng. A, 609 (2014), 323. https://doi.org/10.1016/j.msea.2014.03.120
- 28) W. Mao, S. Gao, W. Gong, S. Harjo, T. Kawasaki and N. Tsuji: Scr. Mater., 235 (2023), 115642. https://doi.org/10.1016/j.scriptamat.2023.115642
- 29) P. J. Jacques, Q. Furnemont, S. Godet, T. Pardoen, K. T. Conlon and F. Delannay: Philos. Mag., 86 (2006), 2371. https://doi.org/10.1080/14786430500529359
- 30) T. Yamashita, S. Morooka, S. Harjo, T. Kawasaki, N. Koga and O. Umezawa: Scr. Mater., 177 (2020), 6. https://doi.org/10.1016/j.scriptamat.2019.10.002
- 31) S. Harjo, T. Ito, K. Aizawa, H. Arima, J. Abe, A. Moriai, T. Iwahashi and T. Kamiyama: Mater. Sci. Forum, 681 (2011), 443. https://doi.org/10.4028/www.scientific.net/MSF.681.443
- 32) R. Oishi, M. Yonemura, Y. Nishimaki, S. Torii, A. Hoshikawa, T. Ishigaki, T. Morishima, K. Mori and T. Kamiyama: Nucl. Instrum. Methods Phys. Res. A, 600 (2009), 94. https://doi.org/10.1016/j.nima.2008.11.056
- 33) A. J. Allen, M. Bourke, W. I. F. David, S. Dawes, M. T. Hutchings, A. D. Krawitz and C. G. Windsor: Proceedings of ICRS2, ed. by G. Beck et al., Elsevier, London, (1989), 78. https://doi.org/10.1007/978-94-009-1143-7_10
- 34) S. Harjo, J. Abe, K. Aizawa, W. Gong and T. Iwahashi: JPS Conf. Proc., 1 (2014), 014017. https://doi.org/10.7566/JPSCP.1.014017
- 35) B. Sun, N. Vanderesse, F. Fazeli, C. Scott, J. Chen, P. Bocher, M. Jahazi and S. Yue: Scr. Mater., 133 (2017), 9. https://doi.org/10.1016/j.scriptamat.2017.01.022
- 36) S. Morooka, N. Sato, M. Ojima, S. Harjo, Y. Adachi, Y. Tomota and O. Umezawa: Int. J. Automot. Eng., 2 (2011), 131. https://doi.org/10.20485/jsaeijae.2.4_131
- 37) M. Koyama, T. Yamashita, S. Morooka, Z. Yang, R. S. Varanasi, T. Hojo, T. Kawasaki and S. Harjo: ISIJ Int., 62 (2022), 2043. https://doi.org/10.2355/isijinternational.ISIJINT-2022-098

