1. Introduction
To realize carbon neutrality in our society, while renewable energy should be used more effectively as electrical power source, the reduction of energy losses is needed, especially in the industrial sector. For automobiles and industrial machinery, since friction generated during operation leads to considerable energy loss, weight reduction and low-torque operation are strongly required. However, such demand leads to the use of more severe environment and, in some cases, causes serious problems for mechanical components. For example, it is known that when rolling bearings are used in harsh lubrication conditions, they fail prematurely at 5–20% of their rated life time due to the flaking associated with dynamic microstructural evolution, so-called white etching area, WEA.1) To avoid such fracture phenomena, it is necessary to understand the fracture mechanism of bearing steels in terms of metallography as well as mechanics.
Bearing steels are required to have very high hardness, and Cr-containing hypereutectoid steels have been widely used. This class steel has considerable amounts of undissolved carbides and retained austenite in hard martensite matrix, because partial solid-solution treatment in the austenite-carbide two-phase region is conducted. And, it has been reported that these phases have influence on white structure flaking.2,3) However, since WEA is formed within martensite matrix, for essential understanding on white structure flaking, it is necessary to investigate the hierarchical microstructure of martensite. Especially, the matrix of medium and high carbon steels is composite microstructure consisting of martensite with different morphologies, i.e. lath and butterfly martensite.4) Recently, Hayashi et al. have analyzed the martensite microstructure of a medium carbon steel by electron backscattered diffractometry (EBSD) and reported the formation of coarse plate martensite composed of a single block on prior austenite grain boundaries.5) If white structure flaking is caused by hydrogen embrittlement,6,7) coarse martensite near prior austenite grain boundaries is expected to be harmful for WEA. In this study, as fundamental research for clarifying the mechanism of white structure flaking in bearing steels, the composite martensite microstructure formed in high-carbon steel was investigated. To analyze the crystallographic and morphological characteristics of the blocks in more detail, we used Rodrigues-Frank space. He et al.8) pointed out that the Kurdumov-Sachs and Nishiyama-Wasserman orientation relationships are characteristically visualized by mapping orientation in real space to Rodrigues-Frank space. However, they did not discuss how these orientation relations are distributed in real space.
In this study, each measurement orientation in real space was mapped to Rodrigues-Frank space to visualize the characteristics of crystallographic orientation distribution in high-carbon martensite. And then, variant information obtained in R-F space was re-mapped into real space to visualize the morphological characteristics of the martensitic blocks. In particular, the characteristics of the coarse martensite blocks (coarse plate martensite) were discussed according to more strict identification of martensite variants using detailed orientation analysis in the Rodrigues-Frank space.
2. Experimental Procedure
The material used in this study is a Cr-containing high-carbon steel with the chemical composition listed in Table 1, which corresponds to SUJ2 in Japanese Industrial Standards.
Table 1. Chemical composition of the material (mass%).
| C | Si | Mn | Cr | Mo | Fe |
|---|
| 1.05 | 0.23 | 0.39 | 1.40 | 0.04 | bal. |
Specimens with volume of 20 × 20 × 40 mm3 cut from the receiving material was subjected to solid-solution treatment at 1223 K of austenite single phase region for 1.8 ks in a nitrogen atmosphere, followed by oil-quenching to make martensitic transformation. Although this type of steel is usually heated in the two-phase region of austenite and cementite, the specimens were heated in the above conditions to coarsen the grain size and remain retained austenite as the reference orientation. Samples were tempered at 443 K for 7.2 ks to simplify the analysis of the orientation of the martensite. And then, specimens of 20 × 20 × 10 mm3 cut from the central part of the as-quenched material was mechanically and chemically polished for the following experiments. Phase fraction of retained austenite was evaluated by X-ray diffractometry using an X-ray diffractometer (μ-X360, Pulstec Industrial Co., Ltd.), and hardness was measured by a Vickers hardness tester. Microstructural observation was performed using an optical microscope and a scanning electron microscope equipped with a focused ion beam system (FIB-SEM, Scios, FEI Company Japan Ltd.), and crystal orientation analysis was conducted by EBSD. EBSD patterns were captured by a camera system attached to the FIB-SEM and analyzed using the dedicated software (APEX, TSL solutions) to obtain crystal orientation information at each measurement point. The measurement conditions were as follows: acceleration voltage 15 kV, working distance 15 mm, step size 0.1 μm, and measurement area 50 × 50 μm2. When the Confidence Index (CI) value, which indicates the accuracy of crystal orientation analysis, was below the threshold value of 0.1 at a measurement point, the data was replaced by the data with the highest CI value in the first proximity as a clean-up process.
To deal with more detailed information on the crystal orientation of martensite, an analysis based on Rodrigues-Frank space8) was attempted. If a crystal is rotated from a reference orientation O to a target one P, and this crystal rotation operation is given by the rotation angle θ radian with the unit vector of the rotation axis [u, v, w], the Rodrigues-Frank vector R (R1, R2, R3) is obtained by the following formula.
|
R=(
R
1
,
R
2
,
R
3
)
=tan
θ
2
(u,v,w)
| (1) |
In the case of cubic crystal, there are 24 equivalent rotation operations for target orientation. Therefore, R-F vector with the smallest angle was selected to make the rotation operation unique. When R is shown in R-F space with R1-R2-R3 rectangular coordinate system, the rotation axis and rotation angle are displayed in the direction and length in R, respectively, so that the relative crystal orientation of the target crystal at P can be visually shown with respect to the orientation at O. In this study, R corresponding to the crystal rotation from O to P is described as RO-P. To identify the martensite variant, the R-F vectors of all measurement points in martensite was calculated from the Euler angles measured by EBSD and then displayed in R-F space. Furthermore, the crystallographic information of martensite variant identified by the above methods was reversed into the real space. These series of numerical analyses were performed using Python with the original information obtained by EBSD.
3. Results
3.1. Microstructure of As-quenched High-carbon Steel
Figure 1(a) shows an optical image of heat-treated material. The material had a composite microstructure consisting of deeply etched needle-like martensite (M) and non-etched blocky retained austenite (A). In the martensite, more deeply etched coarse needles with a length of 10 μm and a width of about 2 μm were observed. Since such coarse needle-like martensite was frequently confirmed in two-dimensional observations, its three-dimensional morphology is considered to be plate-like. The material had relatively high hardness at 688 HV, indicating that martensite is the matrix of the composite microstructure. Indeed, the retained austenite fraction measured by X-ray diffractometry was 25.0%. In addition, white cementite particles with a diameter of approximately 1.0 μm was dispersed at a relatively high density in the composite microstructure, as shown in Fig. 1(b). When cementite containing substitutional alloying elements dissolves into austenite, it is known that the dissolution may be controlled by the slow diffusion of the alloying elements,9) and in particular, the dissolution of cementite containing Cr is reported to be significantly slow.10) Based on these reports, it was concluded that the alloy cementite dissolution had not been completed and it remained with a certain volume, although the steel was quenched from the austenite single-phase region at 1223 K for the purpose of full solid-solution. The fraction of alloy cementite was measured at 1.73% by the binarization of SEM images, and it is estimated that approximately 0.95 mass% C was in solid solution on average within austenite matrix before quenching, because they grew hardly during low temperature tempering.

Fig. 1. (a) Optical and (b) SEM images of heat-treated material.
Figure 2 shows the conventional EBSD analysis results for as-quenched material. (a) is a phase map, and (b) and (c) correspond to fcc- and bcc-IPF maps superimposed on Image Quality (IQ), respectively. In these maps, the prior austenite grain boundaries determined by the orientation reconstruction program11) are indicated by white lines, and their average grain size was approximately 20 μm. As observed in Fig. 1, blocky retained austenite grains (green) and cementite particles (red) were observed in the martensite matrix (blue). The average area fractions of austenite and cementite were 16.9% and 1.65%, respectively. However, their fractions tended to be varied depending on the observation view position, suggesting the existence of micro-segregation in the material. The austenite area fraction measured by EBSD was less than that measured by X-ray diffraction, which can be attributed to the unstabilization of austenite at a sample free surface.12) However, since the difference is not large, it is thought that most of the martensite observed by EBSD had been formed on the quenching process. Then, with respect to each prior austenite grain, the retained austenite grains had an identical orientation, whereas martensite was composed of multiple variants with different orientations. The individual martensite tended to have a needle-like shape and size with a relatively wide distribution.
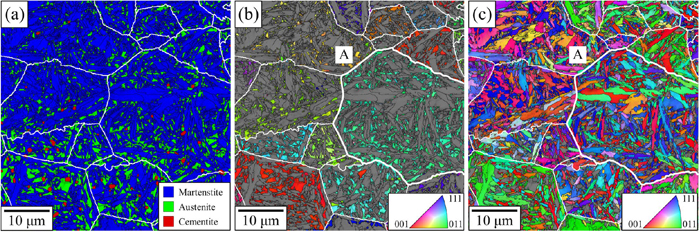
Fig. 2. EBSD-analyzed microstructure of heat-treated material. (a) phase, (b) fcc-IPF, and (c) bcc-IPF maps. (Online version in color.)
Figure 3(a) shows (001)M pole figure of martensite formed in the prior austenite grain “A” indicated in Fig. 2(c) on the standard projection of the austenite. The orientation of the prior austenite grain was determined by the average orientation of the retained austenite grains. The 24 martensite variants with an ideal Kurdjumov-Sachs orientation relationship (K-S, (111)A//(011)M, [-101]A//[-1-11]M) with respect to the austenite are indicated with white circles, and those close to (001)A are marked with KS1-KS24.13) The measured martensite orientations were close to the K-S and were dispersed with a deviation of approximately 5°, similarly to the previous reports.14) For more detailed analysis, an enlarged image near (001)A is shown in (b). In addition to the K-S, the theoretical orientation relationship of Nishiyama-Wasserman (N-W, (111)A//(011)M, [-1-12]A//[0-11]M)) and Bain ((110)A//(100)M, [001]A//[001]M) are displayed as white squares (NW1,2,3,4) and white triangle (B1), respectively. It is found that the measured orientations of martensite were distributed in the K-S but was also close to the N-W; the orientations belonging to KS8 and KS11 were distributed across NW2, making it difficult to precisely identify K-S variants based only on the information in this pole figure.

Figure 4 shows an RA-M plot of the martensite orientations referred to the prior austenite orientation with the theoretical K-S (KS1-KS24). The analyzed data is the same as that in Fig. 3. Due to cubic crystal symmetry, the martensite orientations can be plotted in the R-F space represented by the truncated hexahedron. In this case, B1-B1’, B2-B2’, and B3-B3’ located at the outer boundary on the basal axes R1, R2, and R3, respectively. This means that they have the same orientation each other, ±45° rotation about <001>A. Therefore, they represent the theoretical orientation of Bain. In this figure, orientation plots are colored blue, red, and green to emphasize the differences in the rotation axes. It is visually clear that the measured martensite orientations were roughly distributed around B1, B2, and B3 and can be classified into three Bain groups.

Fig. 4. RA-M plot showing the distribution of martensite orientations referred to the prior austenite orientation. (Online version in color.)
In order to clarify the orientation distribution from Bain variant, RB1-M plot is shown in Fig. 5(a), and the image around the origin is enlarged in (b). By using B1 as a reference, it is more obvious that the eight theoretical K-S (KS1,4,8,11,13,16,21,24) belong to the same Bain group as shown in (a). It should be noted here that the measured martensite orientations were concentrated in each of the eight K-S orientations. For example, the difference in orientation between martensite being KS8 and KS11, which was indistinct in the pole figure analysis of Fig. 3, can be more clearly separated by using R-F space, as shown in (b). In fact, the variant identification in R-F space is independent of the misorientation angle between neighboring points, allowing even for the separation of variants with continuous orientation changes. Furthermore, in R-F space, rotation operations around any axis are represented as straight lines.15) Considering this feature, it is understood that KS1-KS4, KS8-KS11, KS13-KS16, and KS21-KS24 pairs shared [011]M//[111]A, [101]M//[1-11]A, [-101]M//[11-1]A, and [01-1]M//[-111]A with each other, respectively. That is, each pair was a Close-Packed Plane group (CP group), sharing (011)M as the close-packed plane normal to these directions. Therefore, CP groups can be identifiable by these lines, and the plots were painted in four different colors. In the following sections, the martensite microstructure was investigated based on the real space distribution of K-S variants, which were strictly identified by the R-F space.

Fig. 5. RB1-M plot showing the distribution of martensite orientations referred to B1. (b) is an enlarged image around the origin. (Online version in color.)
Three Bain groups (blue, red, green) and four CP groups (yellow, green, red, blue) were separated by RA-M plots and by RBi-M (i = 1,2,3) plots and shown in Figs. 6(a) and 6(b), respectively. In each map, different K-S variants belonging to the same group are displayed with the difference in brightness, and high angle grain boundary with misorientation higher than 15° is indicated by black line. Within each austenite grain, the martensite blocks categorized in three Bain groups seem to have relatively equivalent fraction and appear to be intricately intermingled with each other (a). In contrast, blocks of the same CP group tend to be grouped together (b), suggesting the formation of packets of lath martensite. Furthermore, as indicated by the white arrow, grain boundaries between blocks pair of different Bain groups but belonging to the same CP group were observed at a high frequency, which reveals the preferential formation of twin boundary. In the previous study,16) it was pointed out that Σ3 twin boundaries such as KS1/KS2 are densely developed in high-carbon steels, which is discussed later. The variant identification using R-F space is also effective to show the boundary between blocks with small misorientation angle. For example, the misorientation angle between the variants being the same Bain group, even though they are in different CP groups, is very small, and it is often difficult to distinguish them in conventional IPF map and pole figure.17) However, the orientation analysis using R-F space made it possible to strictly distinguish these variants, and blocks composed of each variant could be drawn appropriately, as shown in the inserted image B enlarging the rectangular area surrounded by black line.

Fig. 6. Map of martensite block with individual variants identified R-F space. (a) Bain group map and (b) CP group map. (Online version in color.)
In this study, an area with an identical variant was regarded as a block by the above methods, and the size distribution of blocks was then evaluated. Since each martensite block tends to have a needle-like shape, the shape of block was approximated as an ellipse by the least-squares method, and its major axis length was evaluated as the block length. Figure 7 shows the relationship between the length and the maximum IQ value of each block. The area fractions of each block are relatively emphasized by the size of the plots. There is a clear correlation between block length and IQ, with coarser blocks having higher IQ. IQ represents the sharpness of the EBSD bands, the less strain and lattice defects, the higher the IQ.18) Hayashi et al. pointed out from TEM observations that the coarse plate martensite is composed of a single block and has few low-angle grain boundaries, unlike lath martensite, resulting in higher IQ value. When the block length was larger than 2.5 μm the IQ tended to saturate at high value. In other words, according to the microstructure name used by Hayashi et al.†, the threshold block length of 2.5 μm can be used to separate the smaller blocks as fine lath blocks and the larger ones as coarse plate blocks. The critical size of 2.5 μm corresponds to the mean spacing of the undissolved carbide particles. This may suggest that the growth of not coarse plate martensite blocks but lath martensite blocks may be inhibited by undissolved carbides.
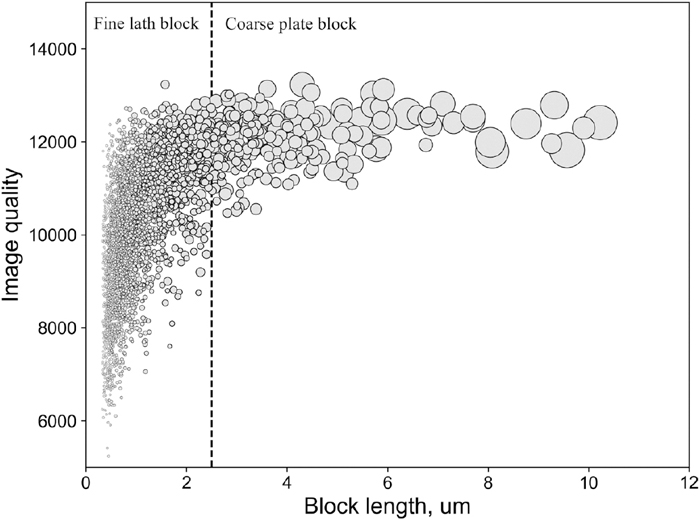
Fig. 7. Variation of EBSD-IQ as a function of martensite block length.
Figure 8(a) shows the distribution of fine lath blocks (blue) and coarse plate blocks (orange), which were divided with the block length of 2.5 μm. Here, retained austenite and undissolved carbide are displayed in gray and black. And, high-angle grain boundary with misorientation higher than 15° is indicated by black line, especially Σ3 twin boundary by light green line. The coarse plate blocks were relatively uniformly distributed in the observed field, with an area fraction of 34.7%. The fine lath blocks were formed to fill between the coarse plate blocks, which suggests that the coarse plate blocks preferred to form before the fine lath blocks. It has been reported that the morphology of martensite varies depending on the transformation temperature; lath, butterfly, lenticular, and thin plate shapes with decreasing temperature,4) but this may not always be true for the composite martensite microstructure. Comparing the location and morphology of the coarse plate blocks, they can be further classified into three types. First, there were plate-shaped blocks (Type-I CB) within each prior austenite grain. Some of this type block forms pair joined at a certain angle, making butterfly shape. As reported in the previous studies, the joint boundary of two blocks was characterized as the pair of KS1/KS6, KS1/KS16 or KS1/KS17, indicated by red lines. On the contrary, a single plate block covering the prior austenite grain boundary was observed (Type-II CB), and a plate block holding high-angle with the prior austenite grain boundary was also confirmed (Type-III CB). In particular, Type-III CB tended to grow in pairs of two plate blocks while having twin boundaries. In other words, Type-III CB is a plate block of twinned pairs that grew from the prior austenite grain boundary toward the inside of the grain. According to this classification, three types of coarse plate blocks could be separately displayed in (b). Type-I and Type-II CBs have been identified in low and medium carbon steels,5) whereas the presence of Type-III CBs has not been clearly reported yet. Therefore, this is considered as a plate martensite that prefers to form in high carbon steels. In the following sections, the crystallographic characteristics of the Type-III CB were analyzed in detail. Incidentally, in Fig. 8(b), Type-I CB also has sometimes twin boundary, so further classification of plate blocks will be required.

Fig. 8. Distribution of various types of martensite. (a) fine lath and coarse plate blocks, (b) three types of plate block. (Online version in color.)
† Martensite microstructure is usually classified by optical morphology, crystallographic habit plane, and variant pairing. However, the identification between lath and plate martensite was conducted by the block size in this study. The identification of martensite microstructure should be discussed in more detail with further investigation.
As an example, Fig. 9 is RNW-M plot showing the crystal orientation distribution of (a) Type-II CB and (b) Type-III CB, which are the blocks “C” and “D” indicated in Fig. 8(b). In these figures, theoretical N-W, NW3 and NW2, were regarded as the reference orientation. They reveal that Type-II CB had orientation with angle deviation within 1° from K-S(KS16) (a), while the orientation of Type-III CB was widely distributed between the K-S(KS11) and N-W(NW2).

In order to analyze the orientation deviation of Type-III CB more deeply, the orientation variation of twin blocks pair is represented in Fig. 10. Assuming that the coarse plate blocks nucleated at the prior austenite grain boundary and grew into the inside of the grain, the orientation variation along the white arrows in (a) was analyzed in R-F space. And the misorientation angle from the N-W is shown in (b). For the interface boundary between KS11 and KS12 blocks, the deviation angle from Σ3 is displayed with the color code. In both blocks of the twined pair, as the distance from the prior austenite grain boundary increases, the orientations continuously shift from near N-W to K-S. Although the orientation of KS11 block is close to the K-S near the prior austenite grain boundary, it might be influenced by the austenite on the opposite side of the grain boundary. Generally, when a second phase forms at a grain boundary, a variant whose habit plane is nearly parallel to the boundary preferentially nucleates to reduce the activation energy for the nucleation.19) Therefore, it is reasonable that the coarse plate block in Type-II CB forms along prior austenite grain boundaries. On the contrary, the nucleation of Type-III CB is in disadvantage in terms of the above theory, however on the other hand, the strain energy generated via martensitic transformation is expected to decrease as different variant pairs are formed. Although the lattice-invariant deformation and the corresponding shape strain in plate martensite has been unclear, Fukui et al.20,21) recently demonstrated that the elastic strain originated from Bain lattice deformation remains and generates the internal stress in the martensite of carbon steels by local strain measurement using a focused ion beam and digital image correlation. In other words, the cooperative formation of block pairs belonging to different Bain groups may be effective to reduce the elastic strain energy generated by martensitic transformation. Furthermore, the change in the crystallographic orientation relationship of the twinned pair from N-W to K-S is thought to achieve a reduction in the interfacial energy during the growth process, since the block boundary becomes near Σ3 twin boundary. Some researchers22,23) investigated the martensite variant pairing in terms of geometrical compatibility, so-called rank-1 connection, and reported that twined blocks pair is one of the candidates that can make a large area of interface with good compatibility. However, the reason why the orientation of twinned pair is close to N-W in the nucleation stage is not clear, and further analysis of the formation and growth mechanism of Type-III CB is needed.

Fig. 10. Misorientaiton profile from N-W in Type-III BB along white lines. (Online version in color.)
As a result of the above microstructural characterization based on the R-F space, the composite microstructure of martensite formed in high-carbon steel is schematically summarized in Fig. 11. The martensite is composed of coarse plate blocks and fine lath blocks. And the coarse plate blocks can be classified into three types depending on the difference in morphology and nucleation site; Type-I CB is a typical plate-shaped blocks formed within prior austenite grains and makes butterfly shape. Type-II CB is a single plate block covering the prior austenite grain boundary, whereas Type-III CB is a coarse plate block of twinned block pair growing toward the inside of the grain. It is expected that these coarse plate blocks have influence on the formation of WEA, because plastic strain may be accumulated preferentially in them during rolling fatigue. Therefore, plastic deformation behavior in the coarse plate blocks should be investigated as well.

Fig. 11. Schematic illustration of the composite microstructure of martensite formed in high-carbon steel.
