Abstract
In this study, the rising and breakup of nitrogen bubbles in high nitrogen molten steel considering different solidification pressure has been numerically simulated by the VOF model verified comparing velocity and deformation of bubbles in water. Rising process of nitrogen bubble in the molten steel is divided into three stages. In stage I, nitrogen bubble experiences an inward depression and splits into a main bubble and two daughter bubbles. In stage II, the main bubble deforms slightly, and a few discrete bubbles split from both sides of the main bubble. In stage III, the main bubble rises to the surface of molten steel, and a large number of discrete bubbles split from the main bubble. As the solidification pressure increases from 0.1 to 2 MPa, the area of main and daughter bubbles decreases. Moreover, the jet becomes stronger with the solidification pressure, which makes the daughter bubbles more prone to splitting out. The total rising time and the maximum rising velocity of the main nitrogen bubble decrease with increasing solidification pressure. This decrement weakens the disturbance of the bubbles rising on the high nitrogen molten steel in stage III, leading to a decrease in the number of discrete bubbles.
1. Introduction
During the solidification of high nitrogen steel, nitrogen bubbles are easy to form in ingots, owing to considerable differences in nitrogen solubility between the liquid and solid phases.1,2) Some of the nitrogen bubbles become captured in solidification structure, resulting in the formation of nitrogen pore defects.3) The presence of nitrogen pores defect can seriously affect the ingot performance and even lead to the scrapping of the ingot.4,5,6) When the nitrogen bubbles rise to the surface of the molten steel and are expelled, there are no nitrogen porosity defects in high nitrogen steel. The rising of nitrogen bubbles is the key to the formation of nitrogen pores.1,7) Therefore, the study of nitrogen bubble rising plays a crucial role in eliminating nitrogen porosity defects.
The process of bubble rising in molten steel is accompanied by deformation and breakup.4,8) The deformation and breakup of the bubble have been mainly studied by various methods, such as low temperature medium model and numerical simulation method.9,10,11) Maldonado’s research on water containing foaming agents and inorganic salts revealed that the velocity of the bubble during rising is inversely proportional to the aspect ratio and independent of solute type or concentration.12) Cao indicated that bubbles do not follow a straight trajectory while rising in water.13) Mosdorf observed a periodic change in the kinetic properties of the bubble during the rising.14) Xu found the magnitude of surface tension has a strong influence on the rising of bubbles in the liquid phase.15) For high nitrogen steel, pressurized metallurgy is recognized as one of the most effective methods for manufacture, including pressurized induction melting, pressurized electroslag remelting (PESR), et al.16,17,18,19) Pressure is a critical metallurgical parameter that has been shown to considerably enhance nitrogen solubility and impede the formation of nitrogen pores.1,20,21,22) Despite the extensive research on the formation process of nitrogen bubbles in high nitrogen steel ingots, the impact of solidification pressure on the rising and breakup of nitrogen bubbles in high nitrogen molten steel is still not well comprehended.
In this study, the rising process of nitrogen bubbles and the morphology of nitrogen bubbles after breakup in high nitrogen molten steel were studied by the volume of fluid method (VOF). Combined with the investigation on the effect of solidification pressure on the number and size of nitrogen bubbles, flow field and the rising velocity of main nitrogen bubble, the function of solidification pressure on nitrogen bubble deformation and breakup during the rising of the nitrogen bubbles is illuminated.
2. Model Building and Validation
The model is built based on several assumptions: (1) the gas-liquid two-phase flow operates under isothermal conditions; (2) both the gas and liquid are incompressible Newtonian flows with fixed viscosity; (3) the initial state of the liquid is assumed to be stationary; (4) the impact of solute field is neglected.
2.1. Governing Equations
Both liquid and gas are governed by the momentum equation and continuity equations and the governing equations based on the VOF method to be solved are as follows:23,24,25,26,27)
|
ρ
∂u
∂t
+ρu⋅∇u=-∇p+∇⋅μ(∇u+
∇
T
u)
+FVol+FBs+FAm+FL+FG+FB
| (1) |
Where, u is the velocity vector, ρ is the fluid density, p is the pressure, μ is the dynamic viscosity, t is the time. The forces on the bubble as it rises are shown in Fig. 1. Nitrogen bubbles are subject to surface tension (FVol), Bassett force (FBs), applied mass force (FAm), and Saffman lift force (FL), gravity (FG), buoyancy (FB). However, the gravity, additional mass force, the Bassett force and the Saffman lift force are relatively small and negligible.28) Therefore, momentum equation can be obtained by the following formulas:
|
ρ
∂u
∂t
+ρu⋅∇u=-∇p+ρg+∇⋅μ(∇u+
∇
T
u)+FVol
| (3) |
Where, g is the gravitational acceleration. The surface tension between the gas and liquid phases can be obtained by the continuous surface force model, and its specific expression is shown in Eq. (4).25,29,30)
|
F
Vol
=
∑
i<j
σ
ij
α
i
ρ
i
κ
j
∇
α
j
+
α
j
ρ
j
κ
i
∇
α
i
0.5(
ρ
i
+
ρ
j
)
| (4) |
Where i and j represent different phases, α represents the phase fraction of different phases, к is the surface curvature of different phases, and ρ is the density of different phases, σ is the surface tension coefficient between different phases.

Fig. 1. The force on the bubble during rising. (Online version in color.)
In the VOF model, the method of tracking the interface between different phases is achieved by solving the continuity equation for the volume fraction (α). For the qt phase (q takes different values to represent different phases), this equation is given as follows
where αq is the phase fraction.
2.2. Initial Conditions and Numerical Simulation Strategies
The maximum nitrogen pore defect size of 5 mm for high-nitrogen steel 19Cr14Mn0.9N, as established by previous experimental studies,1,31) suggests that any nitrogen bubbles with a diameter less than or equal to 5 mm will become trapped by the dendrites and develop into pores. Conversely, any nitrogen bubbles exceeding 5 mm in diameter will escape, preventing pore formation. Therefore, the chosen nitrogen bubble size needs to be larger than 5 mm to investigate the rising and breakup of nitrogen bubbles in molten steel. And, the radius of the nitrogen bubble is set to be 10 mm in this study. As shown in Fig. 2, a nitrogen bubble with a radius of 10 mm is initially located below a region of size 80 mm by 200 mm. A two-dimensional axisymmetric computational domain is used in the simulation. The mesh used in the calculation is a structural mesh. In order to describe the deformation and splitting of the bubble in the process of rise more accurately, a finer grid size of 0.2 mm per grid size is chosen in this paper with a total of 320000 grids (6258 grids in each bubble).

Fig. 2. (a) model meshes and conditions; (b) experimental morphology of nitrogen pores in high nitrogen steel ingot. (Online version in color.)
The model developed in this study was validated by the motion of air bubble in pure water as reported in the references 11 and 32.11,32) And the investigation into the rising mechanism of nitrogen bubbles involved the use of molten 19Cr14Mn0.9N steel. Relevant physical parameters of the liquids, including water and molten 19Cr14Mn0.9N steel, are detailed in Tables 1 and 2, respectively.
Table 1. Physical parameters of pure water.
| Parameter | Value |
|---|
| Density of water, kg·m−3 | 1052 |
| Density of air, kg·m−3 | 1.225 |
| Viscosity of water, Pa·s | 0.625 |
| Viscosity of air, Pa·s | 1.7894×10⁻⁵ |
| Surface tension of water, N·m−1 | 0.0387 |
| Surface tension of interface, N·m−1 | 0.071 |
Table 2. Physical parameters of the molten steel.
| Parameter | Value |
|---|
| Density of steel, kg·m−3 | 6901 |
| Density of nitrogen, kg·m−3 | 1.2572 |
| Viscosity of steel, Pa·s | 0.006 |
| Viscosity of nitrogen, Pa·s | 1.663×10⁻⁵ |
| Surface tension of steel, N·m−1 | 1.82 |
| Surface tension of interface, N·m−1 | 1.15 |
| Nitrogen bubble radius, mm | 10 |
No-slip boundary conditions are employed to satisfy the velocity boundary conditions at the wall shown in Fig. 2. In addition, a pressure-based method is utilized to partition and solve the governing equations of this model. The pressure-implicit method with operator splitting (PISO) was selected to solve the pressure-velocity coupling.33) A geometric reconstruction algorithm is adopted to improve the precision in describing the dynamic changes at the gas-liquid interface during the bubble rise. The residual convergence criterion used in the calculation is set to 1.0×10⁻⁵. In order to ensure high computational accuracy, a computational time step of 1.0×10⁻⁶ is employed in this study.
2.3. Verification of the Model
To evaluate the accuracy of the model, the comparison was achieved between the simulated results of the motion of air bubble in pure water by the model and the results reported by the references 11 and 32. The comparison was carried out from two perspectives: (1) the rising velocity and (2) the deformation of bubble. Firstly, the experimental results reported by Zhong and the simulation results at varying pressures are depicted in Fig. 3.32) It is evident that the rising velocity of the bubble decreased as the pressure increased for both experimental and simulation results. The relative errors in the rising velocity of the bubble were computed, as presented in Fig. 3. The relative errors, which consistently remain lower than 2%, signify the model’s reliability and high accuracy in investigating the effect of pressure on the rising velocity.

Fig. 3. Verification of the bubble rising velocity under different pressure. (Online version in color.)
Secondly, the comparison was conducted between the simulation results of the deformation of bubbles by the model and the experimental results captured by a high-speed camera, as reported by Yan.11) This comparison is shown in Fig. 4. Both the simulation results and experimental results indicate that the bubble gradually changes from a sphere to an ellipse during the rising process. In addition, it was observed that the bubbles did not rise in a straight line but rather in a spiral trajectory. To further evaluate the validity of the simulation results, the aspect ratio during bubble deformation was calculated, as shown in Fig. 4(c). it is evident that the aspect ratio of the two is approximately equal when comparing the experimental and simulation results.

Fig. 4. Deformation during the rising of a bubble: (a) results of the simulation; (b) results of the literature; (c) aspect ratio of the bubble in different positions. (Online version in color.)
In summary, through the verification of the velocity and deformation of the bubble, it can be concluded that the model used in this study has sufficient accuracy to numerically simulate the rise of nitrogen bubble in high nitrogen molten steel under solidification pressure.
3. Results and Discussion
3.1. Breakup of Nitrogen Bubble during Rising
When the nitrogen content in the molten steel is surpasses the nitrogen solubility limit, nitrogen precipitates and forms nitrogen bubbles during solidification of high nitrogen steel ingot.1) Then, the nitrogen bubbles rise and deform in the molten steel. The deformation of bubbles during rinsing is attributed to the combined influence of viscous forces, surface tension, and gravity. Given that the bubble rinsing process is a transient phenomenon, it is challenging to directly observe the interaction among these forces.9) Thus, the relative significance of the above forces is assessed by introducing dimensionless parameters such as Morton (Mo), Galilei (Ga), Eotvo (Eo), Reynolds (Re), Weber (We) numbers, etc. However, it is possible that rising bubbles do not exhibit a stable terminal velocity, and furthermore, the terminal velocity cannot be determined beforehand. Consequently, Ga and Eo numbers prove more appropriate in describing the dynamics of rising bubbles, as opposed to Re and We numbers. And the Ga and Eo numbers can be obtained by the following equation:9,10)
|
Ga=
ρ
L
g
1/2
R
3/2
μ
L
| (6) |
where ρL and μL are density and viscosity of molten steel, respectively; R is initial radius of nitrogen bubble; σ is surface tension of interface. From the definitions of Ga and Eo numbers, it can be observed that Ga number is a ratio of the gravitational force to the viscous force, and Eo number is a ratio of the gravitational force to the surface tension force. In the geometric model established in this article, the Ga and Eo numbers are calculated as 1286 and 6, respectively. This indicates that nitrogen bubbles are subjected to high gravity and relatively weak surface tension in molten steel. According to the research results of Tripathi, nitrogen bubbles will break up in this situation.
Simulation results presented in Fig. 5 illustrate the deformation and breakup of a nitrogen bubble in the molten steel at 0.1 MPa during the rising process. These demonstrates that during the rising process, nitrogen bubbles deform and split into three types of nitrogen bubbles in molten steel during rising, namely, main bubble (the biggest bubble), daughter bubble (with an area larger than discrete bubble and smaller than main bubble) and discrete bubble (with an area smaller than 1.2 mm2).

Fig. 5. Rising process of the nitrogen bubble in the molten steel at 0.1 MPa. (Online version in color.)
The deformation and breakup of nitrogen bubbles can be further studied by dividing the rising process into three stages based on the formation of daughter and discrete bubbles. These stages include daughter bubbles formation stage (stage I), a few discrete bubbles formation stage (stage II), and a large number discrete bubbles formation stage (stage III). During stage I, a substantial pressure difference exists between the upper and lower surfaces of the nitrogen bubbles before deformation. This is due to the sum of surface tension, hydrostatic pressure, and solidification pressure acting on the upper surfaces of the nitrogen bubbles being smaller than that acting on the lower surfaces. To maintain bubble stability, the surface tension acting on the lower surface of the nitrogen bubble begins to decrease until the sum of surface tension, hydrostatic pressure, and solidification pressure acting on the upper surfaces of the nitrogen bubbles is equal to that acting on the lower surfaces. The surface tension is proportional to surface curvature, as indicated by Eq. (4). Consequently, the lower surface of the bubble deforms and undergoes inward depression to reduce its surface tension,34,35) as shown in Fig. 5. It results in the formation of a jet at the bubble deformation position, as shown in Fig. 6(a). As the jet velocity increases, the jet moves horizontally, causing the formation of vortices at the ends of the inwardly depressed region of the bubble. This leads to the splitting of the nitrogen bubble into a main bubble and two daughter bubbles.36)

Fig. 6. Nitrogen bubble morphology and flow field at different stages: (a) stage I; (b) stage II; (c) stage III. (Online version in color.)
During stage II, the main bubble slightly deforms and the aspect ratio gradually increases from 3.37 to 5.09 during rising. There are still vortices at both ends of the lower surface of the main bubble, which leads to the exclusion of discrete bubbles on both sides of the main bubble, as shown in Fig. 6(b).
During stage III, as the bubble rises to the surface of the molten steel, the rising velocity of the bubble reaches the maximum value, causing a strong disturbance to the molten steel. This disturbance makes it difficult for the nitrogen bubble to maintain a relatively stable state, resulting in the splitting of a large number of dispersed bubbles on both sides of the lower surface of the main bubble,37) as shown in Fig. 6(c).
3.2. Effect of Solidification Pressure on the Breakup of Nitrogen Bubbles
The morphology and distribution of nitrogen bubbles during breakup at different solidification pressures are shown in Fig. 7. It can be noticed that with the solidification pressure increases, the size of both main bubble and daughter bubbles reduced while their number increased. The area and number of nitrogen bubbles during stage III were further quantified in Fig. 8. It indicates that as the solidification pressure increases from 0.1 MPa to 2.0 MPa, the area of main bubble decreases from 140 mm2 to 102 mm2, and the average area of the daughter nitrogen bubbles decreases from 39 mm2 to 12 mm2. This phenomenon is attributed to the change in pressure difference inside the nitrogen bubbles resulting from the increase in solidification pressure Pa. The relationship between curvature radius and pressure difference Pin−Pout can be obtained using the following equation:
|
P
in
-
P
out
=σ(κ1+κ2)
| (8) |
where Pout=Pa+Pm, refers to the pressure outside the bubble; Pin is the pressure inside the bubble; Pa is the solidification pressure; Pm is the hydrostatic pressure; κ1 and κ2 are curvatures in the orthogonal direction.38) The final morphology of nitrogen bubble in molten steel exhibits spherical cap bubble under different solidification pressures. Due to the spherical cap shape of bubbles, the lower surface curvature does not differ significantly under different solidification pressures, namely, Pin−Pout(low) does not differ significantly. It is known that pressure gradient increases with increasing solidification pressure, so the pressure difference between the lower and upper surface (ΔP) increases with increasing solidification pressure. And hence the pressure difference in the upper surface Pin−Pout(up)=Pin−Pout(low)+ΔP increases with the rise of the solidification pressure. It can be found that a large pressure difference leads to increase in the curvature, resulting in a decrement in the radius of bubbles. Thus, with the solidification pressure increases, the size of both the main nitrogen bubbles and daughter bubbles decreases.
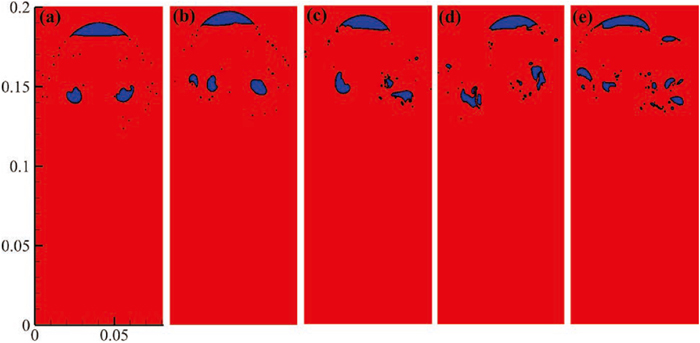
Fig. 7. The morphology and distribution of nitrogen bubbles after breakup at different solidification pressures: (a) 0.1 MPa; (b) 0.5 MPa; (c) 1.0 MPa; (d) 1.5 MPa; (e) 2.0 MPa. (Online version in color.)

Fig. 8. Area and number of nitrogen bubbles in stage III: (a) area; (b) number. (Online version in color.)
Moreover, as solidification pressure increases, the main and daughter bubbles split into several smaller daughter bubbles, as observed in Figs. 7(d) and 7(e). The formation of daughter bubbles is closely related to the jet velocity of bubble. With the increase in solidification pressure, the maximum jet velocities of bubbles under 0.1, 1 and 2 MPa are 1.316, 2.026 and 2.516 m/s, respectively, as shown in Fig. 9. This is due to the existence of the pressure difference between the lower and upper surface (ΔP), a jet is induced at the lower surface of the bubble, and the jet strengthens with the increase of the pressure difference. Therefore, the maximum jet velocity at the lower surface of the nitrogen bubbles increases with increasing solidification pressure. Additionally, the jet velocity at the lower surface of the nitrogen bubbles increases with increasing solidification pressure, indicating that increasing solidification pressure makes it more likely for bubbles to split into daughter bubbles.

Fig. 9. Velocity fields of daughter bubbles about to split under different solidification pressure: (a) 0.1 MPa; (b) 1 MPa; (c) 2 MPa. (Online version in color.)
However, as the solidification pressure increases from 0.1 MPa to 2.0 MPa, the number of the discrete nitrogen bubbles decreases from 29 to 21 in stages II and III, as shown in Fig. 8(b). The formation of discrete bubbles is closely related to the motion of the main bubble. In order to explain the effect of solidification pressure on the number of discrete bubbles, both the total time rising in the molten steel and maximum rising velocity of the main bubble as it rises to the surface at different solidification pressures is counted, as shown in Fig. 10. It can be found that rising time decreases with increasing solidification pressure from 0.1 to 2 MPa. This was attributed to the fact that increasing solidification pressure from 0.1 to 2 MPa resulted in more daughter bubbles being split out, reducing the area of the main bubble from 140.3 mm2 to 101 mm2, which in turn leads to a reduction in maximum rising velocity of the main bubble by decreasing buoyancy. Thus, it can be concluded that increasing the solidification pressure can reduce the number of discrete bubbles by weakening the disturbance of bubbles rising on the high nitrogen molten steel in stage II and III.

Fig. 10. Total time and maximum rising velocity of main bubble. (Online version in color.)
4. Conclusions
The process of nitrogen bubble formation and their morphology following breakup at varying solidification pressures has been investigated by Volume of Fluid (VOF) method. The main conclusions are as follows:
(1) During nitrogen bubble rising in molten steel, the interaction between the jet and vortex leads to the splitting of nitrogen bubbles into three distinct types: main bubble, daughter bubble, and discrete bubble.
(2) An increase in solidification pressure from 0.1 to 2 MPa results in a reduction in the area of the main and daughter bubbles. This is attributed to the rise in pressure difference between the inner and outer surfaces of the nitrogen bubbles. Moreover, an enhancement in the jet occurs with increasing solidification pressure, facilitating the separation of the daughter bubbles.
(3) With increasing solidification pressure, the total rising time and the maximum rising velocity of the main nitrogen bubble as it rises to the surface decreases, and the number of discrete bubbles decreases by weakening the disturbance of bubbles rising on the high nitrogen molten steel.
Acknowledgements
This research was sponsored by the National Natural Science Foundation of China [Grant Nos. U1960203/52325406/52374330], Science Fund for Distinguished Young Scholars of Liaoning Province [Grant No. 2023JH6/100500008], Fundamental Research Funds for the Central Universities [Grant No. N2125017],and Program of Introducing Talents of Discipline to Universities [Grant No. B21001].
References
- 1) H. B. Li, Z. Y. He, H. C. Zhu, H. Feng, Z. H. Jiang, Y. Wang, Z. W. Ni and Y. B. Dai: Metall. Mater. Trans. B, 53 (2022), 1721. https://doi.org/10.1007/s11663-022-02482-w
- 2) J. Maruyama, K. Ito, M. Ando, J. Okada and K. Ito: ISIJ Int., 60 (2020), 1375. https://doi.org/10.2355/isijinternational.ISIJINT-2019-653
- 3) K. Kubo and R. D. Pehlke: Metall. Trans. B, 16 (1985), 359. https://doi.org/10.1007/BF02679728
- 4) W. T. Lou, C. Liang and X. Y. Wang: ISIJ Int., (2023), (Advance Publication). https://doi.org/10.2355/isijinternational.ISIJINT-2023-200
- 5) Q. Zhang, D. Sun, S. Pan and M. Zhu: Int. J. Heat Mass Transfer, 146 (2020), 118838. https://doi.org/10.1016/j.ijheatmasstransfer.2019.118838
- 6) L. Chiari and M. Fujinami: ISIJ Int., 62 (2022), 832. https://doi.org/10.2355/isijinternational.ISIJINT-2021-422
- 7) Z. Y. He, H. B. Li, Z. W. Ni, H. C. Zhu, Z. H. Jiang, H. Feng and D. S. Mao: Steel Res. Int., 92 (2021), 2100197. https://doi.org/10.1002/srin.202100197
- 8) M. Ohta, T. Imura, Y. Yoshida and M. Sussman: Int. J. Multiphase Flow, 31 (2005), 223. https://doi.org/10.1016/j.ijmultiphaseflow.2004.12.001
- 9) M. K. Tripathi, K. C. Sahu and R. Govindarajan: Nat. Commun., 6 (2015), 6268. https://doi.org/10.1038/ncomms7268
- 10) M. K. Tripathi, K. C. Sahu and R. Govindarajan: Sci. Rep., 4 (2014), 4771. https://doi.org/10.1038/srep04771
- 11) X. Yan, Y. Jia, L. Wang and Y. Cao: Chem. Eng. J., 316 (2017), 553. https://doi.org/10.1016/j.cej.2017.01.137
- 12) M. Maldonado, J. J. Quinn, C. O. Gomez and J. A. Finch: Chem. Eng. Sci., 98 (2013), 7. https://doi.org/10.1016/j.ces.2013.04.050
- 13) Y. Cao, I. Mateos Canals and R. Macián-Juan: Int. J. Multiphase Flow, 129 (2020), 103320. https://doi.org/10.1016/j.ijmultiphaseflow.2020.103320
- 14) J. T. Cieslinski and R. Mosdorf: Int. J. Heat Mass Transfer, 48 (2005), 1808. https://doi.org/10.1016/j.ijheatmasstransfer.2004.12.002
- 15) Y. Xu, M. Ersson and P. G. Jönsson: Steel Res. Int., 91 (2020), 1900611. https://doi.org/10.1002/srin.201900611
- 16) H. C. Zhu, H. B. Li, Z. Y. He, H. Feng, Z. H. Jiang and T. He: ISIJ Int., 61 (2021), 1889. https://doi.org/10.2355/isijinternational.ISIJINT-2021-010
- 17) H. B. Li, Z. W. Ni, H. C. Zhu, Z. Y. He, H. Feng, S. C. Zhang, Z. H. Jiang and Y. Wang: Metall. Mater. Trans. B, 54 (2023), 1422. https://doi.org/10.1007/s11663-023-02770-z
- 18) J. W. Simmons: Mater. Sci. Eng. A, 207 (1996), 159. https://doi.org/10.1016/0921-5093(95)09991-3
- 19) L. Han, K. Pei, F. Sun, Z. Wang and Q. Zhang: ISIJ Int., 61 (2021), 902. https://doi.org/10.2355/isijinternational.ISIJINT-2020-367
- 20) H. C. Zhu, Z. H. Jiang, H. B. Li, H. Feng, S. C. Zhang, G. H. Liu, J. H. Zhu, P. B. Wang, B. B. Zhang, G. W. Fan and G. P. Li: Metall. Mater. Trans. B, 48 (2017), 2493. https://doi.org/10.1007/s11663-017-1021-x
- 21) H. C. Zhu, H. B. Li, Z. W. Ni, Z. Y. He, Z. H. Jiang, H. Feng, S. C. Zhang and D. S. Mao: Metall. Mater. Trans. B, 53 (2022), 50. https://doi.org/10.1007/s11663-021-02327-y
- 22) H. Zhu, H. Li, Z. Jiang, Z. He, H. Feng and S. Zhang: ISIJ Int., 60 (2020), 1978. https://doi.org/10.2355/isijinternational.ISIJINT-2020-010
- 23) T. M. J. Nijssen, J. A. M. Kuipers, J. V. D. Stel, A. T. Adema and K. A. Buist: ISIJ Int., 62 (2022), 1146. https://doi.org/10.2355/isijinternational.ISIJINT-2021-521
- 24) M. Owkes and O. Desjardins: J. Comput. Phys., 270 (2014), 587. https://doi.org/10.1016/j.jcp.2014.04.022
- 25) M. Bahreini, A. Ramiar and A. A. Ranjbar: Nucl. Eng. Des., 293 (2015), 238. https://doi.org/10.1016/j.nucengdes.2015.08.004
- 26) K. Kihara, N. Okada, S. Saito and K. Kawashima: ISIJ Int., 62 (2022), 1862. https://doi.org/10.2355/isijinternational.ISIJINT-2022-120
- 27) Z. Yujie, L. Mingyan, X. Yonggui and T. Can: Chem. Eng. Sci., 73 (2012), 55. https://doi.org/10.1016/j.ces.2012.01.012
- 28) L. Fang, T. Liu, Y. Huang, W. Wu, W. Feng and H. Lei: ISIJ Int., 62 (2022), 2294. https://doi.org/10.2355/isijinternational.ISIJINT-2022-242
- 29) J. U. Brackbill, D. B. Kothe and C. Zemach: J. Comput. Phys., 100 (1992), 335. https://doi.org/10.1016/0021-9991(92)90240-Y
- 30) E. Miyoshi, T. Takaki, M. Ohno and Y. Shibuta: ISIJ Int., 60 (2020), 160. https://doi.org/10.2355/isijinternational.ISIJINT-2019-305
- 31) Z. Y. He, H. B. Li, H. C. Zhu, Y. Wang, Z. W. Ni, Z. H. Jiang, H. Feng and S. C. Zhang: Metall. Mater. Trans. B, 54 (2023), 213. https://doi.org/10.1007/s11663-022-02681-5
- 32) L. Zhong, H. Zhou, L. Wang and K. Zhang: J. Northeast. Univ., Nat. Sci., 36 (2015), 388. https://xuebao.neu.edu.cn/natural/EN/10.12068/j.issn.1005-3026.2015.03.019
- 33) R. I. Issa, B. Ahmadi-Befrui, K. R. Beshay and A. D. Gosman: J. Comput. Phys., 93 (1991), 388. https://doi.org/10.1016/0021-9991(91)90191-M
- 34) R. Mei, J. F. Klausner and C. J. Lawrence: Phys. Fluids, 6 (1994), 418. https://doi.org/10.1063/1.868039
- 35) W. C. Park, J. F. Klausner and R. Mei: Exp. Fluids, 19 (1995), 167. https://doi.org/10.1007/BF00189705
- 36) C. Wang and J. Cai: Nucl. Eng. Des., 340 (2018), 219. https://doi.org/10.1016/j.nucengdes.2018.09.041
- 37) C. MartÍNez-BazÁN, J. L. MontaÑÉS and J. C. Lasheras: J. Fluid Mech., 401 (1999), 157. https://doi.org/10.1017/S0022112099006680
- 38) S. H. Yang and Z. H. Lee: Mater. Sci. Eng. A, 417 (2006), 307. https://doi.org/10.1016/j.msea.2005.11.004

