Abstract
The dependence of crack initiation sites and main factors causing hydrogen embrittlement fracture on carbide precipitation states has been investigated for tempered martensitic steels with the same tensile strength of 1450 MPa. Notched specimens charged with hydrogen were stressed until just before fracture and subsequently unloaded. The crack initiation site exhibited intergranular (IG) fracture at 21 µm ahead of the notch tip as observed by scanning electron microscopy (SEM) for 0.28% Si specimens with plate-like carbide precipitates on prior austenite (γ) grain boundaries. This crack initiation site corresponded to the vicinity of the maximum principal stress position as analyzed by a finite element method (FEM). The initiation site corresponded to the triple junction of prior γ grain boundaries as analyzed by electron backscattered diffraction (EBSD). In contrast, the crack initiation site exhibited quasi-cleavage (QC) fracture at the notch tip for 1.88% Si specimens with fine and thin carbide particles in the grains. This crack initiation site corresponded to the maximum equivalent plastic strain site obtained by FEM. Additionally, the crack initiated on the inside of prior γ grain boundaries and propagated along the {011} slip plane with higher kernel average misorientation (KAM) values as analyzed by EBSD. These findings indicate that differences in carbide precipitation states changed the crack initiation sites and fracture morphologies involved in hydrogen embrittlement depending on mechanical factors such as stress and strain and microstructural factors.
1. Introduction
In recent years, the application of high-strength steels has been promoted for the purpose of further weight reduction and safety improvement in transportation equipment such as automobiles, buildings, and structures. However, hydrogen embrittlement susceptibility increases with increasing strength of steels, and a lath-martensitic steel is particularly susceptible to hydrogen embrittlement.1,2,3,4,5) Typical fracture morphologies are intergranular (IG) fracture along prior austenite (γ) grain boundaries6,7,8,9) and quasi-cleavage (QC) fracture9,10,11,12,13,14,15,16) that occurs along the block/lath boundary or {011} slip plane of the body-centered cubic lattice, and each fracture mechanism may be different. The most important issue is to identify the crack initiation sites and clarify the main factor involved in order to elucidate the mechanism of each fracture mode. However, it is difficult to determine the crack initiation sites and then observe them directly since the phenomena from crack initiation to fracture occur instantaneously.
Factors affecting crack initiation consist of mechanical ones (stress and strain) and microstructural ones. Regarding mechanical factors, hydrogen embrittlement cracks in tempered martensitic steel with stress concentration are a stress-controlled mechanism if they occur ahead of the notch tip and are along grain boundaries without plastic deformation. In contrast, the strain-controlled mechanism is thought to originate at the notch tip and propagate through the grains with plastic deformation.17,18) It has been reported that the stress- and strain-controlled mechanisms depend on the material strength, impurities, and hydrogen content.17)
Conventionally, a slow strain rate test (SSRT)19,20) and a constant load test21) with hydrogen charging have been conducted on notched AISI4135 steel with a tensile strength of 1450 MPa class. It was reported that cracks occurred along grain boundaries ahead of the notch tip, which is the point of maximum hydrostatic stress and local hydrogen concentration. A conventional strain rate test (CSRT)22) was also reported in which crack initiation was determined by the relationship between the maximum stress and maximum accumulated hydrogen concentration, similar to SSRT results.23,24) However, the influence of carbide precipitation states in steels on crack initiation under the same strength, impurity, and hydrogen content has not been investigated yet.
Regarding microstructural factors, the relationship between crack initiation/propagation and the microstructure in as-quenched lath martensitic steel has been investigated in detail using electron backscattered diffraction (EBSD).13,25,26,27) Detailed studies have been conducted by crystallographic analyses of crack propagation paths with varying hydrogen content and strain rates. However, there have been few reports on crack initiation from the viewpoint of microstructural factors; additionally, the effects of carbide precipitation states have not been investigated.
In the present study, tempered martensitic steels with the same strength but different carbide precipitation states were prepared. They were stressed until just before hydrogen embrittlement fracture under the same hydrogen charging conditions and unloaded. Each crack initiation site was then directly observed and compared. In addition, the distribution of stress and strain near the notch tip calculated by finite element method (FEM) analysis, the substructure near the notch tip obtained by EBSD analysis, and the hydrogen embrittlement crack initiation site were correlated. Based on the results, an attempt was made to clarify the relationship between the main mechanical and microstructural factors that cause hydrogen embrittlement crack initiation.
2. Experimental
2.1. Materials
Two types of martensitic steels with different Si contents were prepared. Table 1 shows the chemical compositions of steel with a low Si content (L-Si; 0.28 mass%) and steel with a high Si content (H-Si; 1.88 mass%). To unify their tensile strength at proximately 1450 MPa, the heat treatment conditions were changed. Table 2 shows the respective quenching/tempering temperatures and tensile strengths. The H-Si steel was tempered at a higher temperature than the L-Si steel in order to obtain the same tensile strength because a higher Si content enhances solid solution strengthening and resistance to tempering softening.28,29,30,31)
Table 1. Chemical compositions of specimens (mass%).
| C | Si | Mn | P | S |
|---|
| L-Si | 0.34 | 0.28 | 0.80 | 0.008 | 0.006 |
| H-Si | 0.32 | 1.88 | 0.73 | 0.018 | 0.008 |
Table 2. Quenching temperatures, tempering temperatures, and tensile strengths of L-Si and H-Si specimens.
| Specimen | Quenching temp. [°C] | Tempering temp. [°C] | Tensile strength [MPa] |
|---|
| L-Si | 960 | 350 | 1474 |
| H-Si | 1020 | 495 | 1456 |
To compare the carbide precipitation states of both steels, mirror-polished specimens were immersed in a nital solution of 5 mass% HNO3, and the microstructures were observed using a scanning electron microscope (SEM). Figure 1 shows the microstructures of (a) L-Si steel and (b) H-Si steel specimens. For the L-Si specimen, plate-like carbides (Fe3C) with a length of about 100 to 500 nm are observed on the prior γ grain boundaries along the dashed white lines indicated by white arrows, and plate-like Fe3Cs with a length of about 50 to 400 nm are observed inside the grains enclosed by the black dashed line, as shown in Fig. 1(a). In Fig. 1(b), the plate-like Fe3Cs observed in (a) are not present on the grain boundaries along the white dashed lines for the H-Si specimen. As indicated by white arrows, only fine carbides with a length of about 50 to 100 nm are observed inside the grains.

Fig. 1. Microstructures observed by scanning electron microscopy: (a) thick plate-like carbides were observed on grain boundaries and plate-like carbides in the grains of L-Si specimens; (b) no plate-like carbides were observed on grain boundaries, but fine carbides were observed in the grains of H-Si specimens.
The hydrogen embrittlement properties of both steels were evaluated by conducting tensile tests. Figure 2 shows the geometry and dimensions of a notched specimen used in the tests. A parallel section with a gauge length of 30 mm and a diameter of 5 mm was provided in the center of a 140 mm long bar. A notch was then formed with an angle of 60°, a curvature radius of 0.22 mm, and a depth of 0.4 mm with a stress concentration factor of 2.8. The value obtained by dividing the test load by the area of the notch cross section was defined as the nominal stress.

Fig. 2. Geometry and dimensions of a notched specimen for tensile test.
The surface condition of the gauge length part of the specimens was polished using water-resistant abrasive paper (#800→#1000→#2000) to make it uniform. Hydrogen was precharged by constant current cathodic electrolysis method at a current density of 75 A/m2 in a 0.1 N NaOH + 1 g/L NH4SCN aqueous solution at 30°C for 96 h until the hydrogen concentration at the surface and center of the specimen reached a constant state.6,7,8) Tensile tests were carried out at a crosshead speed of 0.01 mm/min while charging with hydrogen under the same conditions as the precharged hydrogen in order to keep the hydrogen concentration constant during the test. The solution was changed at intervals of 48 h to prevent deterioration of the solution during hydrogen charging and to maintain a constant hydrogen charging state. The fracture surface was observed using the SEM.
The hydrogen content was analyzed by thermal desorption analysis (TDA) using a gas chromatography with a semiconductor gas sensor as the detector. After hydrogen charging, specimens were cut, washed with acetone, cooled in liquid nitrogen, and inserted into a TDA quartz tube. The heating rate was set to 100°C/h, and the temperature range was from 0 to 300°C.
2.3. Identification of Crack Initiation Site by Unloading Test
After charging hydrogen under the same conditions as in Section 2.2, tensile tests were carried out and stress was unloaded at the level just before fracture. Plate-shaped specimens with a thickness of about 1 mm were cut parallel to the tensile direction of the unloaded specimens. In order to identify the crack initiation site, mechanical polishing was performed in a sequence of waterproof abrasive paper (#800→#1000→#2000), diamond suspension (9 μm→3 μm), and colloidal silica (0.03 μm). The presence of a crack initiation site near the notch tip was examined using the SEM. Three-dimensional analyses are normally required to accurately identify crack initiation sites in round bar test pieces. However, in the present study, the crack initiation site was verified by repeating the observation after polishing in the thickness direction of the plate-shaped specimens cut from near the notch parallel to the tensile direction.
2.4. FEM Analysis
To investigate the relationship between the hydrogen embrittlement crack initiation site and the mechanical factors, FEM analysis was used to analyze the principal stress and equivalent plastic strain near the notch tip. The analysis software used was ABAQUS/CAE 6.14-5. The true stress and true strain were calculated from the nominal stress-nominal strain curves obtained in the tensile tests using smooth round bar specimens with a diameter of 5 mm. One-eighth models were created for the parallel part of the specimens shown in Fig. 2. Elastic-plastic analyses were performed using the unloaded stress immediately before fracture as a load condition for static analysis. As constraint conditions, the base and cut plane of the model were fixed, the element type was hexahedron, Poisson’s ratio was 0.3, Young’s modulus was 200 GPa, and the total number of elements was 982800. The mesh size near the notch tip was divided into about 17 μm.
2.5. Crystal Orientation Analysis by EBSD
The crystal orientations were analyzed using EBSD to clarify the relationship between the hydrogen embrittlement crack initiation site and microstructural factors. Polishing was performed under the same conditions as in Section 2.3, and analyses were performed with an acceleration voltage of 15 kV, a working distance of 17 mm, and a beam step size of 50 nm. The crack initiation sites identified by SEM were mapped on an inverse pole figure (IPF) map using orientation imaging microscope (OIM) analysis.
3. Experimental Results
3.1. Hydrogen Embrittlement Test and Fracture Mode
Figure 3 shows the nominal stress-displacement curves of notched (a) L-Si steel and (b) H-Si steel specimens obtained with and without hydrogen charging in tensile tests. The figure also shows the initial hydrogen content at the start of each tensile test. The initial hydrogen content of the L-Si steel after precharging hydrogen was 5.3 mass ppm (referred to here as simply ppm) and that of the H-Si steel was 4.5 ppm. When tensile tests were performed under the same hydrogen charging conditions, the fracture strength of the L-Si steel was 658 MPa and that of the H-Si steel was 1027 MPa. The fracture strength of both steels was markedly lowered by the influence of hydrogen. Even under the same hydrogen charging conditions, the fracture strength of the L-Si steel was about 370 MPa lower than that of the H-Si steel.

Fig. 3. Stress-displacement curves and initial hydrogen content of (a) L-Si and (b) H-Si notched specimens with/without hydrogen at a crosshead speed of 0.01 mm/min. (Online version in color.)
Figure 4 shows SEM observations of the hydrogen embrittlement fracture surfaces presented in Fig. 3. For the L-Si steel, (a) is an overall view and (c) is an enlarged view near the notch tip enclosed in the white frame in (a). QC fracture was observed to about 15 μm from the circumferential notch tip, and IG fracture was observed farther away toward the center. For the H-Si steel, (b) is an overall view and (d) is an enlarged view near the notch tip enclosed in the white frame in (b). The QC fracture extends far from the notch tip. Although omitted here, the central part of both steels had a microvoid coalescence (MVC) fracture, which is a typical ductile fracture.
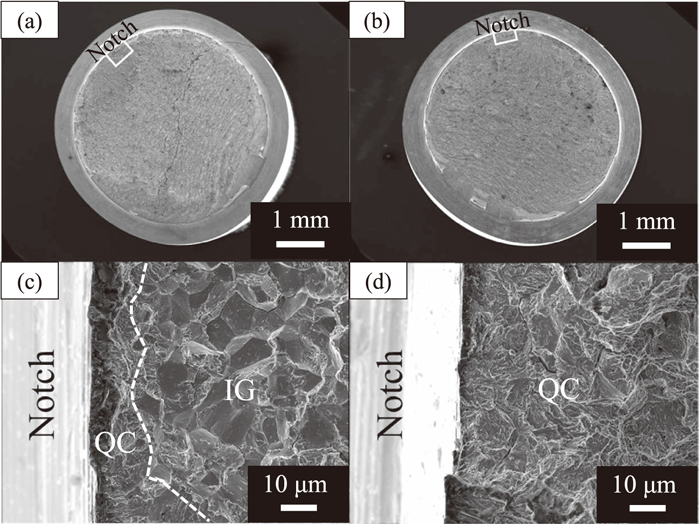
Fig. 4. Microscopic fracture surfaces near the notch tip after tensile test at a strain rate of 0.01 mm/min. (a) and (b) show overall views of L-Si and H-Si specimens, respectively. (c) and (d) show enlarged views of L-Si and H-Si specimens, respectively. (c) shows quasi-cleavage (QC) fracture at the notch tip and intergranular (IG) fracture ahead of the notch tip of the L-Si specimen corresponding to the region surrounded by the white line rectangle in (a), and (d) shows QC fracture from the notch tip of the H-Si specimen corresponding to the region surrounded by the white line rectangle in (b).
Figure 5 shows the overall nominal stress-displacement curves of (a) L-Si steel and (b) H-Si steel specimens when tensile tests were performed with precharging of hydrogen and subsequent hydrogen charging, and the load was unloaded immediately just before fracture. Enlarged views of the vicinity of the stress unloaded in the middle surrounded by black dashed lines are also shown in the figure. In Fig. 3, when the tensile test was performed with hydrogen charging, the specimen seemly fractured instantly in the elastic region. However, as shown in the enlarged view in Fig. 5, the nominal stress-displacement curve shows a slight sign of plastic deformation before fracture. In the present study, after reaching the maximum stress of 655 MPa for the L-Si steel and 931 MPa for the H-Si steel, stress was unloaded at the points where it decreased by 0.01 MPa and 0.28 MPa for the two steels, respectively.

Fig. 5. Stress-displacement curves for identifying the crack initiation sites: application of preloading until just before fracture strength with hydrogen and subsequent unloading for (a) L-Si specimen and (b) H-Si specimen. Enlarged views around the preloading stress just before fracture are shown in (a) and (b). (Online version in color.)
Figure 6 shows views of the SEM observation after cutting out regions in the vicinity of the notch tip of the specimens unloaded in Fig. 5 and polishing them. For the L-Si steel, the crack initiation site is observed in the region ahead of the tip as indicated by the white arrow in (a). In addition, in the enlarged view in (c), a crack with a length of 3 μm is observed 21 μm away from the notch tip. The notch was also observed from the side of the round bar specimen, but no crack was observed. After the EBSD analysis, the plate specimen was further polished in its thickness direction, but this crack did not move or other cracks appeared, and finally disappeared.

Fig. 6. Microscopic crack initiations near the notch tip after unloading test: (a) and (b) show overall views of the crack initiation of L-Si and H-Si specimens, respectively. (c) and (d) show enlarged views of L-Si and H-Si specimens, respectively. (c) shows that crack initiation occurred ahead of the notch tip for the L-Si specimen and (d) shows that it occurred at the notch tip for the H-Si specimen.
For the H-Si steel, the crack originated at the notch tip as indicated by the white arrow in (b), and in the enlarged view in (d), a crack that propagated up to 6 μm from the notch tip was observed. The notch was also observed from the side of the round bar specimen, and cracks were seen. Although the plate specimen continued to be polished in the plate thickness direction, this crack was always observed at the notch tip, but not ahead of it.
Figure 7 shows views of the SEM observation at the point where the crack propagated slightly from the hydrogen embrittlement crack initiation site. The total length of the crack in the L-Si steel (a) was 1130 μm and that in the H-Si steel (b) was 940 μm. Enlarged views of the red framed areas are shown in (c) and (d), respectively. As seen in the enlarged views, the crack progressed not in a straight line but in a deflected manner.

Fig. 7. Microscopic crack propagations near the notch tip after unloading test: (a) and (b) show overall views of the crack propagation in L-Si and H-Si specimens, respectively. (c) and (d) show enlarged views of L-Si and H-Si specimens, respectively. (Online version in color.)
Figure 8 shows the principal stress and equivalent plastic strain distributions of (a) L-Si steel and (b) H-Si steel specimens near the notch tip as calculated by FEM. The value input for the L-Si steel was 655 MPa, which is the unloaded stress before reaching the fracture strength when hydrogen was charged, and that for the H-Si steel was 931 MPa. It is seen in (a) that the position of the maximum principal stress in the L-Si steel was about 60 μm away from the notch tip and (b) shows that it was about 120 μm away from the notch tip in the H-Si steel. The position of the maximum equivalent plastic strain was at the notch tip for both the L-Si steel and the H-Si steel. The crack initiation sites observed in Fig. 6 are indicated by a red dashed line in the figures. The crack initiation site of the L-Si steel in (a) was near the position of the maximum principal stress. In contrast, the crack initiation site of the H-Si steel in (b) coincided with the maximum equivalent plastic strain position. Figure 9 shows the calculated results obtained with Eq. (1) for the local hydrogen concentration distribution attributed to hydrostatic stress.20,22)
|
C
H
=
C
A
exp(
-
V
H
(
σ
h
-
σ
h,min
)
RT
)
| (1) |
where CH is the accumulated hydrogen concentration near the notch tip, CA is the average hydrogen content (5.3 ppm for the L-Si steel and 4.5 ppm for the H-Si steel), VH is the partial molar volume (2×10⁻⁶ m3/mol), R is the gas constant (8.31 J/mol·K) and T is the absolute temperature (303 K in this study). The notation σh is the hydrostatic stress at the stress concentration site immediately before hydrogen embrittlement fracture, and σh,min is the hydrostatic stress at the center of the specimen at a sufficiently far distance. Similar to the maximum principal stress distribution in Fig. 8, both the L-Si steel and the H-Si steel displayed hydrogen concentration peaks far from the notch tip. The concentration of hydrogen caused by hydrostatic stress reached a maximum at approximately 70 μm from the notch tip in the L-Si steel shown in (a) and at approximately 130 μm in the H-Si steel shown in (b). As shown in (a), a crack occurred near the maximum hydrogen concentration site, whereas as shown in (b), cracks did not occur near the maximum hydrogen concentration site.

Fig. 8. Distribution of principal stress and equivalent plastic strain near the notch tip analyzed by FEM: (a) at unloaded stress of 655 MPa for L-Si specimen and (b) at unloaded stress of 931 MPa for H-Si specimen. (Online version in color.)

Fig. 9. Distribution of local hydrogen content corresponding to hydrostatic stress near the notch tip at unloaded stresses of (a) 655 MPa for L-Si specimen and (b) 931 MPa for H-Si specimen. (Online version in color.)
Figure 10 shows the combined results for the initial cracks observed in Figs. 6(c) and 6(d) on IPF maps near the notch tip of (a) L-Si and (b) H-Si steel specimens after the unloading tests, respectively. The white arrows represent the crack initiation sites, and the red dashed lines represent the prior γ grain boundaries. As shown in (a), the crack in the L-Si steel originated from the triple junction of prior γ grain boundaries away from the notch tip. In contrast, as shown in (b), the crack in the H-Si steel originated within the prior γ grain at the notch tip.

Fig. 10. Crack initiation sites observed by SEM overlaid with IPF maps analyzed by EBSD: (a) L-Si and (b) H-Si specimens obtained by the unloading test. (Online version in color.)
Figure 11 shows (a) an SEM image, (b) a trace analysis, (c) a kernel average misorientation (KAM) map, and (d) a KAM map magnifying the region in the white dashed frame in (c) near the crack initiation site in the H-Si steel. As shown in (a), the crack initiated from the notch tip or its immediate vicinity showed traces of discontinuous step growth instead of linear growth. In the trace analysis in (b), it can be confirmed that the crack propagated along the {011} plane and across the block boundaries. In the KAM map in (d), which is an enlarged view of (c), the KAM value tended to be particularly high at the locations where the cracks bent and connected as indicated by the white arrow. In contrast, no significant change in the KAM value was observed near the crack initiation site of the L-Si steel.

Fig. 11. (a) SEM image, (b) trace analysis of {011}, (c) KAM map, and (d) KAM map in an enlarged view near crack initiation site corresponding to white dashed line area in (c) of the H-Si specimen. (Online version in color.)
Figure 12 shows IPF maps of the unloaded specimen with the crack propagation shown in Fig. 7 and the areas of the corresponding fracture morphologies (IG and QC) shown in Fig. 4. For the L-Si steel, the QC fracture surface appeared at the notch tip and the IG fracture surface appeared at a position slightly away from the notch tip in Fig. 4(c), and the crack also propagated within the prior γ grains and along the prior γ grain boundaries indicated by the red dashed line slightly away from notch tip in Fig. 12(a). Similarly, for the H-Si steel (b), the QC fracture extended far from the notch tip in Fig. 4(d), and the crack propagated in the prior γ grains on the IPF map in Fig. 12(b). These results indicate that the IG fracture in the L-Si steel and the QC fracture in the H-Si steel corresponded to the crack initiation sites.
4. Discussion
Two types of tempered martensitic steels with the same strength but different carbide precipitation states showed different hydrogen embrittlement crack initiation sites even though hydrogen was charged under the same conditions. In this section, we discuss the relationship between hydrogen embrittlement crack initiation sites and major factors of the L-Si steel, in which plate-like Fe3Cs precipitated on the prior γ grain boundaries, and the H-Si steel, in which fine Fe3Cs precipitated inside the prior γ grains.
First, we discuss the hydrogen embrittlement crack initiation site and its main factors in the L-Si steel. As shown in Fig. 10(a), a crack occurred in the L-Si steel at the triple junction of prior γ grain boundaries about 20 μm away from the notch tip. From the FEM analysis results shown in Figs. 8(a) and 9(a), the crack initiation site in the L-Si steel corresponded to the position where the principal stress and hydrogen concentration were high. These results are similar to the findings of research done by Wang et al.19) in which AISI4135 steel with a notch was charged with hydrogen and subjected to tensile tests. It is concluded that crack initiation in the L-Si steel was strongly influenced by local stress and local hydrogen concentration. Toroiano32) reported that stress-induced diffusion of hydrogen accumulated near the maximum hydrostatic stress position and cracks occurred. However, the hydrogen embrittlement crack initiation site of the L-Si steel did not strictly correspond to the maximum principal stress position and local hydrogen concentration site. This is because the FEM analyses in the present study assumed a continuum, did not consider the non-uniformity of the microstructure, and could not accurately obtain the mechanical response. Lath martensitic steel undergoes an especially large change in deformation behavior depending on the prior γ grains, packets, blocks, and arrangement orientation of laths, and stress concentration occurs at prior γ grain boundaries. Therefore, it is inferred that hydrogen accumulated locally at the prior γ grain boundaries near the maximum principal stress position obtained by the FEM analyses.
McMahon17) and Novak et al.33) explained IG fracture in high-strength steels in terms of stress concentration due to dislocation pile-up on carbides precipitated on prior γ grain boundaries and hydrogen-induced decohesion. As shown in Fig. 1(a), plate-like Fe3Cs precipitated on the prior γ grain boundaries in the L-Si steel. As a result, the dislocations trapping the hydrogen slipped27,34) and could not pass through the prior γ grain boundaries. Since stress concentration and hydrogen accumulation occurred on the prior γ grain boundaries, the initial crack originated on the prior γ grain boundaries corresponding to the IG fracture surfaces. Koyama et al. published studies concerning hydrogen embrittlement crack initiation at the triple junction of γ grain boundaries. They reported that, in tensile tests of hydrogen-charged precipitation-strengthened high-Mn35) and high-Mn-TWIP36) steels, stress concentration and associated hydrogen accumulation due to elastic misfit between adjacent grains occurred at the triple junction of γ grain boundaries. Their results suggest that hydrogen embrittlement cracks initiate at the triple junction of γ grain boundaries with little plastic strain. Considering these earlier findings, the stress concentration at the triple junction of prior γ grain boundaries and the local accumulation of hydrogen presumably had a considerable effect on the initiation of hydrogen embrittlement cracks in the present study. In other words, the hydrogen embrittlement crack initiation site of the L-Si steel was determined by the combined effect of stress concentration and hydrogen accumulation attributed to dislocation accumulation at the grain boundaries, as well as by stress concentration and local hydrogen accumulation at the triple junction of prior γ grain boundaries. For this reason, it is considered that the crack initiated at the triple junction of prior γ grain boundaries, which were at a position slightly away from the notch tip where the principal stress and hydrogen concentration were high.
Next, we discuss the hydrogen embrittlement crack initiation site and its main factors in the H-Si steel. From the FEM analysis results presented in Figs. 8(b) and 9(b), the crack initiation site at or near the notch tip in the H-Si steel did not correspond to either the maximum principal stress position or the local hydrogen concentration site. Instead, it corresponded to the high equivalent plastic strain position. In addition, as shown in Figs. 10(b) and 11(b), cracks initiated in the prior γ grains at or near the notch tip and propagated along the {011} plane in the H-Si steel. The reasons why the L-Si steel exhibited a crack on the prior γ grain boundary corresponding to the IG fracture surface, whereas the H-Si steel exhibited cracks within the prior γ grain corresponding to the QC fracture surface are described as follows. Plate-like Fe3C precipitations were observed on the prior γ grain boundaries in the L-Si steel, while less Fe3C was observed on the prior γ grain boundaries in the H-Si steel but fine Fe3C precipitations were observed in the grains, as shown in Fig. 1(b). Second phase particles prevent dislocation slip motion on the basis of earlier findings. In the results of a relaxation test presented in a previous report,7) the relaxation value of the H-Si steel was reduced to approximately 1/5 of that of the L-Si steel. Since the relaxation value correlates with the distance of dislocation movement and the number of moved dislocations, the results support the idea that dislocation movement was inhibited by the finer intragranular carbides in the H-Si steel. In other words, crack initiation in the prior γ grains corresponding to the QC fracture surface in the H-Si steel was due to Fe3C refinement in the prior γ grains, which suppressed stress concentration and hydrogen accumulation by dislocation pile-up on the prior γ grain boundaries. As a result, crack initiation was probably suppressed on the prior γ grain boundaries.
The mechanism of hydrogen embrittlement crack initiation in the H-Si steel is discussed next. The crack initiation site of the H-Si steel was at or near the notch tip, corresponding to a relatively high equivalent plastic strain. In addition, as shown in Figs. 10(b) and 11(b), cracks initiated in the prior γ grains at or near the notch tip and propagated along the {011} plane. This suggests that crack initiation in H-Si steels cannot be explained by a simple interface separation mechanism. The occurrence of QC fracture along the {011} plane in lath martensitic steels implies lath or block boundary separation,10,11,37) slip plane decohesion on the {011} plane,2,38) and coalescence of microvoids on the {011} plane.39) As shown in Figs. 11(b) and 11(d), the crack originating from the notch tip or its extreme vicinity showed evidence of discontinuous, not linear, step-like growth, with significantly higher KAM values in the region crossing the block boundary and at the crack tip. Birnbaum et al.40) proposed that hydrogen induces localized plastic deformation to a specific slip plane or crack tip. Matsumoto et al.41) reported that hydrogen decreases the energy of vacancy formation and increases the activation energy of vacancy diffusion by a first-principles calculation. On the basis of these reports, QC fracture in the H-Si steel was caused by slip plane decohesion on the {011} plane, which is closely related to local plastic deformation, or by coalescence of microvoids on the {011} plane. In other words, the hydrogen embrittlement crack initiation site in the H-Si steel was determined by hydrogen-enhanced local plastic deformation and vacancy stabilization, and cracks probably initiated in the prior γ grains at the notch tip where the equivalent plastic strain was high, assuming that these conditions are relatively likely to occur.
These findings indicate that the crack initiation site of hydrogen embrittlement fracture changes depending on the carbide precipitation states. In addition, since cracks do not necessarily initiate at the maximum principal stress position and hydrogen concentration site, it is assumed that the crack initiation site is determined by not only stress but also plastic strain and microstructural factors such as the triple junction of prior γ grain boundaries.
5. Conclusions
Tempered martensitic steels with the same strength but different carbide precipitation states were unloaded at the stress immediately just before hydrogen embrittlement fracture, and the crack initiation sites were identified. As a result of attempting to clarify the main mechanical and microstructural factors that cause crack initiation, the following findings were obtained.
(1) In the case of the L-Si steel in which plate-like carbides precipitated on the prior γ grain boundaries, the crack initiation site was approximately 20 μm away from the notch tip and corresponded to intergranular fracture. In contrast, in the case of the H-Si steel in which fine carbides precipitated in prior γ grains, the crack initiation site was the notch tip where quasi-cleavage fracture occurred.
(2) To clarify the relationship between crack initiation and mechanical factors, FEM analyses were conducted at the stress level unloaded just before reaching the fracture strength with hydrogen. The results indicated that the maximum principal stress of the L-Si steel was approximately 60 μm away from the notch tip and that the maximum equivalent plastic strain was at the notch tip. The maximum principal stress of the H-Si steel was approximately 120 μm from the notch tip and the maximum equivalent plastic strain occurred at the notch tip.
(3) The crack initiation sites were superimposed on IPF maps near the notch tip to clarify the relationship between crack initiation and microstructural factors. It was found that the crack in the L-Si steel originated from the triple junction of prior γ grain boundaries approximately 20 μm away from the notch tip, whereas the crack in the H-Si steel initiated within the prior γ grains at the notch tip.
(4) The crack in the L-Si steel did not initiate exactly at the position of maximum principal stress, but rather near the position of the maximum equivalent plastic strain. Under the conditions of high strength and high hydrogen content, there are many reports that cracks generally occur as intergranular fractures at the maximum principal stress position a little away from the notch tip, but for the H-Si steel in the present study, a crack occurred at the notch tip as a quasi-cleavage fracture at the position of the maximum equivalent plastic strain.
References
- 1) S. Li, Z. Zhang, E. Akiyama, K. Tsuzaki and B. Zhang: Corros. Sci., 52 (2010), 1660. https://doi.org/10.1016/j.corsci.2010.02.005
- 2) S. J. Lee, J. A. Ronevich, G. Krauss and D. K. Matlock: ISIJ Int., 50 (2010), 294. https://doi.org/10.2355/isijinternational.50.294
- 3) X. Zhu, W. Li, H. Zhao, L. Wang and X. Jin: Int. J. Hydrog. Energy., 39 (2014), 13031. https://doi.org/10.1016/j.ijhydene.2014.06.079
- 4) J. Venezuela, F. Y. Lim, L. Liu, S. James, Q. Zhou, R. Knibbe, M. Zhang, H. Li, F. Dong, M. S. Dargusch and A. Atrens: Corros. Sci., 171 (2020), 108726. https://doi.org/10.1016/j.corsci.2020.108726
- 5) Y. Chen, Z. Xu, X. Zhang, T. Zhang, J. J. Tang, Z. Sun, Y. Sui and X. Han: Mater. Des., 199 (2021), 109404. https://doi.org/10.1016/j.matdes.2020.109404
- 6) Y. Matsumoto and K. Takai: Metall. Mater. Trans. A, 49 (2018), 490. https://doi.org/10.1007/s11661-017-4435-9
- 7) Y. Matsumoto, K. Takai, M. Ichiba, T. Suzuki, T. Okamura and S. Mizoguchi: ISIJ Int., 53 (2013), 714. https://doi.org/10.2355/isijinternational.53.714
- 8) K. Ogawa, Y. Matsumoto, H. Suzuki and K. Takai: ISIJ Int., 59 (2019), 1705. https://doi.org/10.2355/isijinternational.ISIJINT-2019-130
- 9) T. Chiba, T. Chida, T. Omura, D. Hirakami and K. Takai: Scr. Mater., 223 (2023), 115072. https://doi.org/10.1016/j.scriptamat.2022.115072
- 10) Y. H. Kim and J. W. Morris, Jr.: Metall. Trans. A, 14 (1983), 1883. https://doi.org/10.1007/BF02645559
- 11) A. Nagao, C. D. Smith, M. Dadfarnia, P. Sofronis and I. M. Robertson: Acta Mater., 60 (2012), 5182. https://doi.org/10.1016/j.actamat.2012.06.040
- 12) T. Doshida, H. Suzuki, K. Takai, N. Oshima and T. Hirade: ISIJ Int., 52 (2012), 198. https://doi.org/10.2355/isijinternational.52.198
- 13) A. Shibata, H. Takahashi and N. Tsuji: ISIJ Int., 52 (2012), 208. https://doi.org/10.2355/isijinternational.52.208
- 14) A. Shibata, T. Murata, H. Takahashi, T. Matsuoka and N. Tsuji: Metall. Mater. Trans. A, 46 (2015), 5685. https://doi.org/10.1007/s11661-015-3176-x
- 15) Y. Matsumoto and K. Takai: Metall. Mater. Trans. A, 48 (2017), 666. https://doi.org/10.1007/s11661-016-3885-9
- 16) T. Chen, T. Chiba, M. Koyama, E. Akiyama and K. Takai: Metall. Mater. Trans. A, 53 (2022), 1645. https://doi.org/10.1007/s11661-022-06608-2
- 17) C. J. McMahon, Jr.: Eng. Fract. Mech., 68 (2001), 773. https://doi.org/10.1016/S0013-7944(00)00124-7
- 18) Y. Takeda and C. J. McMahon, Jr.: Metall. Trans. A, 12 (1981), 1255. https://doi.org/10.1007/BF02642339
- 19) M. Wang, E. Akiyama and K. Tsuzaki: Mater. Sci. Eng. A, 398 (2005), 37. https://doi.org/10.1016/j.msea.2005.03.008
- 20) M. Wang, E. Akiyama and K. Tsuzaki: Corros. Sci., 49 (2007), 4081. https://doi.org/10.1016/j.corsci.2007.03.038
- 21) M. Wang, E. Akiyama and K. Tsuzaki: Corros. Sci., 48 (2006), 2189. https://doi.org/10.1016/j.corsci.2005.07.010
- 22) Y. Hagihara: ISIJ Int., 52 (2012), 292. https://doi.org/10.2355/isijinternational.52.292
- 23) M. Wang, E. Akiyama and K. Tsuzaki: Scr. Mater., 53 (2005), 713. https://doi.org/10.1016/j.scriptamat.2005.05.014
- 24) M. Wang, E. Akiyama and K. Tsuzaki: Scr. Mater., 52 (2005), 403. https://doi.org/10.1016/j.scriptamat.2004.10.023
- 25) A. Shibata, T. Matsuoka, A. Ueno and N. Tsuji: Int. J. Fract., 205 (2017), 73. https://doi.org/10.1007/s10704-017-0182-6
- 26) A. Shibata, T. Yonemura, Y. Momotani, M.-h. Park, S. Takagi, Y. Madi, J. Besson and N. Tsuji: Acta Mater., 210 (2021), 116828. https://doi.org/10.1016/j.actamat.2021.116828
- 27) Y. Momotani, A. Shibata, D. Terada and N. Tsuji: Int. J. Hydrog. Energy., 42 (2017), 3371. https://doi.org/10.1016/j.ijhydene.2016.09.188
- 28) W. S. Owen: Trans. ASM, 46 (1954), 812.
- 29) R. M. Hobbs, G. W. Lorimer and N. Rideley: J. Iron Steel. Inst., 210 (1972), 757.
- 30) W. J. Nam and H. C. Choi: Mater. Sci. Technol., 15 (1999), 527. https://doi.org/10.1179/026708399101506238
- 31) T. Nishimura: J. Jpn. Soc. Heat Treat., 20 (1980), 342 (in Japanese).
- 32) A. R. Troiano: Trans. Am. Soc. Met., 53 (1960), 54.
- 33) P. Novak, R. Yuan, B. P. Somerday, P. Sofronis and R. O. Ritchie: J. Mech. Phys. Solids, 58 (2010), 206. https://doi.org/10.1016/j.jmps.2009.10.005
- 34) H. Shoda, H. Suzuki, K. Takai and Y. Hagihara: ISIJ Int., 50 (2010), 115. https://doi.org/10.2355/isijinternational.50.115
- 35) M. Koyama, H. Springer, S. V. Merzlikin, K. Tsuzaki, E. Akiyama and D. Raabe: Int. J. Hydrog. Energy, 39 (2014), 4634. https://doi.org/10.1016/j.ijhydene.2013.12.171
- 36) M. Koyama, E. Akiyama, K. Tsuzaki and D. Raabe: Acta Mater., 61 (2013), 4607. https://doi.org/10.1016/j.actamat.2013.04.030
- 37) A. Nagao, M. Dadfarnia, B. P. Somerday, P. Sofronis and R. O. Ritchie: J. Mech. Phys. Solids, 112 (2018), 403. https://doi.org/10.1016/j.jmps.2017.12.016
- 38) J. P. Hirth: Metall. Trans. A, 11 (1980), 861. https://doi.org/10.1007/BF02654700
- 39) T. Neeraj, R. Srinivasan and J. Li: Acta Mater., 60 (2012), 5160. https://doi.org/10.1016/j.actamat.2012.06.014
- 40) H. K. Birnbaum and P. Sofronis: Mater. Sci. Eng. A, 176 (1994), 191. https://doi.org/10.1016/0921-5093(94)90975-X
- 41) R. Matsumoto, N. Nishiguchi, S. Taketomi and N. Miyazaki: Zairyo J. Soc. Mater. Sci. Jpn., 63 (2014), 182. https://doi.org/10.2472/jsms.63.182


