Regular Article
In-situ Laser Ultrasonics Measurements of Ferrite Formation during Stepped Cooling of A 0.1C-2Mn Dual Phase Steel
2024 Volume 64 Issue 5 Pages 817-825

Details
2024 Volume 64 Issue 5 Pages 817-825
Dual-phase (DP) steels are advanced high-strength steels used in automotive design. To achieve optimal mechanical properties the control of phase transformations during processing is paramount, e.g. for hot-rolled DP steels a desired ferrite fraction is required to form during run-out table cooling. Thus, sensor technologies such as laser ultrasonics (LUS) are of considerable interest that can in-situ monitor ferrite formation. In this study, the ferrite formation kinetics in a laboratory DP steel were measured by LUS during stepped cooling treatments which were designed to simulate the cooling paths on the run-out table in hot strip mills. LUS measurements were first validated with well-established dilatometry measurements during continuous cooling. For the stepped cooling tests, the fractions transformed obtained from the ultrasonic velocity changes agree with the ferrite phase fractions as characterized by ex-situ metallography. Further, the velocity changes are described by the JMAK approach using parameters that are consistent for the austenite-to-ferrite transformation in low-carbon steels.
Advanced high strength steels (AHSS) have been increasingly used in the automotive industry owing to their high strength in combination with high ductility and crashworthiness, which allows car manufacturers to produce thinner parts and, in turn, decrease fuel consumption.1) Among the AHSS, the dual phase (DP) steel group has been widely used in vehicles because of its optimized properties that can be achieved through phase transformations.2)
Producing DP steels through hot rolling results in a ferrite-martensite microstructure, which is formed from the austenite decomposition during the so-called “stepped cooling” process3) on a run-out table. The strength of DP steels increases with the martensite fraction whereas the softer ferrite phase promotes their ductility. Thus, the volume fraction of ferrite/martensite determines the mechanical properties of DP steels such that the microstructure evolution during stepped cooling has to be carefully controlled. Thus, process monitoring techniques that can provide information directly related to the microstructure evolution are of significant interest.
Owing to its non-contact nature, laser ultrasonics (LUS) has been gaining attention as an in-situ monitoring technique in steel manufacturing lines.4,5,6,7) Laser ultrasonics has been reported to successfully measure phase transformations in steels during continuous cooling, as benchmarked with conventional techniques including dilatometry.8,9,10,11)
Dubois et al.12) performed laser ultrasonic measurements during continuous heating and cooling in the temperature range of 500–1000°C for carbon steel samples. They observed a reproducible hysteresis in the temperature dependence of ultrasonic longitudinal velocity, which was attributed to the combined effects of the phase transformation and of the ferromagnetic-paramagnetic transition. Furthermore, in steels with sufficient alloying content, the velocity behavior during cooling shows clearly the start and end of phase transformation, since the transformation occurred below the Curie temperature. Krüger and Damm9) compared laser ultrasonic measurements with dilatometry during the monitoring of austenite decomposition in low carbon steels. They observed a similar temperature dependence of the ultrasound velocity as Dubois et al.,12) and proposed applying the lever rule to determine the fraction transformed from the velocity measurements, provided the velocities of the constituent phases are sufficiently different.
Several phase transformation studies have been conducted using laser ultrasonics on advanced high strength steels, including transformation-induced plasticity (TRIP) steels. Krüger et al.13) reported a very good correlation between the ultrasonic velocity on TRIP steel samples, having different chemical compositions, and the retained austenite fraction measured by X-ray diffraction. They also monitored the ultrasonic velocity during isothermal bainitic transformation at 300°C, in which discrepancies in transformation kinetics as compared to dilatometry measurements were rationalized based on the sensitivity of the dilatometric technique to the carbon enrichment of austenite. However, no metallographic characterization was provided in this work. Militzer et al.8,10) investigated the microstructure evolution during thermal cycles for the heat affected zone (HAZ) in line pipe steels. They also reported a non-linear variation of ultrasonic velocity in ferrite near the Curie temperature corresponding to the magnetic transition as well as monitoring the transformation from ferrite to austenite below the Curie temperature whereas for higher temperatures phase transformation is not associated with a sufficiently large velocity change. Moreover, Garcin et al.8) simulated HAZ dual torch welding cycle in an API-X80 steel (0.06wt.%C-1.65wt.%Mn-0.24wt.%Mo-0.034wt.%Nb-0.012wt.%Ti-0.005wt%N), monitoring laser ultrasonic velocity and dilatometry simultaneously onto the same cross-section. The transformation temperatures from the two techniques agreed within approximately 10°C. In the same study, LUS measurements were also carried out during intercritical annealing treatments of a cold-rolled DP600 steel. However, during annealing at 770°C, i.e. above the magnetic transition temperature, the velocity change has not provided any quantitative measure of austenite formation whereas dilatometry has shown an increase of the austenite fraction. Further, Horn et al.11) applied Krüger et al.’s13) ultrasonic velocity technique to investigate phase transformation kinetics at different quenching rates on state-of-art hot stamping steels containing complex phases in different carburized conditions. The effect of the carburization on the phase transformation kinetics was captured by laser ultrasonic measurements and supported by the corresponding hardness measurements. However, a quantification of the respective phase fractions by metallography was not undertaken.
Only a few studies have been conducted for steels to validate the quantitative relationship between the fraction transformed from LUS and the phase fraction using post-mortem characterization, whereas some studies have been reported for titanium alloys.14,15) The primary goal of the present study is to assess the in-situ monitoring capability of LUS for ferrite formation in hot-rolled DP steels during laboratory simulation of stepped run-out table cooling including validation of the LUS measurements with ex-situ metallography.
The steel used in this study was cast as ingots and hot rolled into plates with the size of 750×130×25 mm at Nippon Steel Corp. (Chiyoda city, Tokyo, Japan). Its chemical composition is summarized in Table 1. The Ae3 temperature as calculated with Thermo-Calc using the TCFE7 database is also reported in Table 1.
| C | Si | Mn | P | S | Al | N | Ae3 |
|---|---|---|---|---|---|---|---|
| 0.096 | 0.48 | 1.97 | 0.0091 | 0.0015 | 0.030 | 0.0015 | 821°C |
Sheet specimens of 60×10×3 mm were machined from the hot rolled plates for heat treatments and laser ultrasonic measurements. To avoid being affected by the macrosegregation of Manganese in the centre portion of the plate,16) the specimens were extracted from one fourth of the plate thickness. The longitudinal direction of the specimens is perpendicular to the plate rolling direction (Fig. 1).

A Gleeble® 3500 thermo-mechanical simulator (Dynamic System Inc., Poestenkill, NY, USA) equipped with a laser ultrasonics for metallurgy (LUMet) sensor (Tecnar Automation Ltee, Saint-Bruno-de-Montarville, Canada) was used for the heat treatments. The principles of the LUMet technique are discussed in detail by Rodrigues and Militzer.14) Prior to the tests, a pair of K-type thermocouples was spot-welded onto the centre of the specimens to monitor the temperature. To minimize surface oxidation, the treatments were conducted under vacuum at a pressure of 0.002 Pa.
Thermal treatments were designed to study the kinetics of austenite decomposition at both continuous and step cooling. The continuous cooling transformation (CCT) tests were conducted to compare the phase transformation kinetics measured with dilatometry and the LUMet technique. The samples were heated at 50°C/s to 950°C and isothermally held for 120 s prior to controlled cooling to room temperature at rates of 3 and 10°C/s to capture the austenite to ferrite phase transformation. The cooling rate of 3°C/s was attained under vacuum, whereas the 10°C/s cooling was achieved with helium gas. The LUMet system was set to acquire ultrasound signals at a sampling frequency of 50 Hz during heating and 5 Hz during cooling.
The stepped cooling transformation tests were designed to simulate the cooling path to produce hot rolled dual phase steels on the run-out table of a hot strip mill. As in the CCT tests, the samples were heated at 50°C/s to 950°C, where they were isothermally held for 120 s. Then, the samples were cooled down to the target temperatures at a rate of 10°C/s without helium, to achieve uniform cooling within the sample. In cases where the transformation started during cooling the 10°C/s cooling rate was, however, not maintained due to the heat of transformation. The specimens were isothermally held for specific holding times, followed by helium quenching. Two sets of stepped cooling transformation tests were conducted. For the first set, the samples were isothermally held at different target temperatures of 700, 675 and 650°C for 600 s (Fig. 2(a)), i.e. within the 720–650°C temperature range where polygonal ferrite is expected to form during stepped cooling.3,17,18,19,20) For the second set, the samples were isothermally held at 650°C for 10, 20, 60 and 600 s and quenched-in (Fig. 2(b)). Here, laser ultrasonic pulses were acquired during cooling only until the isothermal holding was completed. The sampling frequency for the initial cooling and isothermal holdings were 5 Hz and 1 Hz, respectively. To obtain a reference velocity for ferrite, three ultrasonic velocity measurements were performed during heating and averaged to give the ferrite reference curve for both the CCT and stepped cooling tests.

A contact dilatometer was placed at the mid-length of the sample, i.e. on the same cross-section where the thermocouple is spot-welded, to measure the macroscopic volume change during CCT tests. The relative dilatometer change is obtained by normalizing the change in width with respect to the initial width of 10 mm. The lever rule, as per the ASTM 1033-18 standard,20) was then used to calculate the fraction transformed from the dilatometry data. Experimental thermal expansion coefficients (CTE) were compared against reported literature CTE values, i.e. 22.5×10⁻⁶°C−1 and 14.8×10⁻⁶°C−1 for austenite and ferrite, respectively, in low carbon steel.22) Tests with CTE values within a ± 10% margin were deemed valid.
The ultrasound velocities obtained from the LUMet measurements were computed using the CTOME analysis software23) employing the so-called two-echo technique (TET), in which two echoes of the same waveform are employed for the calculation. Here, the 2nd and 3rd echoes were used such that the longitudinal ultrasonic velocity (Vl) is given by:
| (1) |
where h is the sample thickness and t is the time delay between the 2nd and 3rd echoes. The sample thickness is measured with a digital caliper at room temperature prior to the test and corrected for thermal expansion during the velocity processing in CTOME.
For ex-situ characterization, the tested specimens were sectioned at the mid-length, i.e. where the thermocouples were spot welded, hot mounted and manually grinded, polished and etched with 2% Nital solution. Optical microscopy was conducted on a Nikon EPIPHOT 300 series inverted optical microscope. The manual point counting method as per the ASTM E562-89 standard,24) was applied using a square grid superimposed on the micrographs to quantify the transformation products. A minimum of 9 micrographs each containing 330 grid points was quantified for each sample to ensure statistics of measurements.
Figure 3 shows the ultrasound velocity measured during heating and cooling. During heating the velocity decreases non-linearly as the temperature approaches 740°C, above which the relationship between ultrasound velocity and temperature becomes linear. This characteristic change in the velocity-temperature curve has been reported in previous studies12,13) and is attributed to the Curie temperature, i.e. the temperature for the transition from ferromagnetism to paramagnetism in ferrite. The Curie temperature in pure iron is reported to be 770°C.25) Using the equation proposed by Nishizawa et al.26) which takes into account the atomic fraction of alloying elements, the Curie temperature calculated for the studied steel is 740°C, which is consistent with the temperature where the prominent ultrasonic velocity inflection is observed. It should be noted from Fig. 3 that there is no visible velocity change for the ferrite to austenite transformation above the Curie temperature.

During cooling, the velocity increases linearly with decreasing temperature until the austenite decomposition temperature is reached. At the cooling rate of 3°C/s, the velocity starts to increase faster around 680°C, whereas at 10°C/s this occurs at about 650°C. The solid black heating curve reflects ferrite during heating whereas the dashed line is the low temperature extrapolation of the fully austenite velocity at higher temperatures. Then, the cooling curves can be considered as the mixture of these two phases and the lever rule can be applied to determine the fraction transformed.
Figure 4 shows the fraction transformed as a function of temperature in the specimens cooled at 3 and 10°C/s, computed from both dilatometry and ultrasound velocity measurements. Since the transformation temperatures are much lower than the Curie temperature, the phase transformation kinetics can be captured with LUMet in the present steel. The phase transformation kinetics obtained from both techniques are in sufficient agreement such that the dilatometry tests validate the LUMet measurements. Unlike in the present study, Krüger and Daam9) observed pronounced discrepancies between laser ultrasonics and dilatometry when both measurements were not performed simultaneously. This has been justified based on sample-to-sample differences, as well as smaller differences in thermal cycles and measured temperatures.

Figure 5 shows the ultrasound velocity measurements during stepped cooling. Here, the ultrasound velocity was measured up to the end of the isothermal holdings at 650, 675 and 700°C. During initial cooling down to the target holding temperatures, the velocity increases linearly as the temperature decreases. For the 650°C holding, the velocity deviates from the straight FCC-velocity line extrapolated from higher temperatures before reaching the holding temperature. This indicates that the phase transformation has already started prior to reaching 650°C. During the isothermal holdings the ultrasound velocity increases with time, which reflects the ferrite formation.

Figure 6 displays the fraction transformed obtained by the ultrasound velocity during the isothermal portion of the stepped cooling transformation tests. The transformation rates as plotted in the logarithm of time follow a sigmoidal shape, which suggests diffusional nucleation and growth of the product phase. As observed, the transformation kinetics is faster, and the fraction transformed reaches a higher value as the holding temperature decreases. The phase transformation start times, which were quantified at 5% transformed, are about 3 and 2 s for 700 and 675°C, respectively. For 650°C holding, 10% transformed was already achieved when the temperature reached the target.

Based on the dilatometry measurements during the CCT tests (see Fig. 4), 10% transformed is achieved around 600°C at the cooling rate of 10°C/s, which is inconsistent with the results for the 650°C holding condition. This may be attributed to whether helium gas is used for the initial cooling. In the CCT tests at 10°C/s, helium was continuously blown on the surface where the thermocouple was attached to, whereas no gas was used for the initial cooling of the stepped cooling transformation tests. In the former case, there may be a potential temperature gradient through the sample’s thickness. This can cause an apparent lower temperature of the transformation in both volumetric measurements by LUMet and dilatometry. The stepped cooling tests were performed without gas to minimize through thickness temperature gradients. Then, the measured ultrasonic velocity and the fraction transformed obtained from these measurements, are representative at the measured temperature for the average properties of the material over a volume created by the laser spot.
It is also noted from Fig. 6 that lower holding temperatures lead to higher fractions of ferrite formed, i.e. 0.76, 0.59 and 0.56 transformed fractions at 650, 675 and 700°C. Furthermore, data scatter increases with holding time, as a consequence of increasing surface damage caused by the laser ablation.
Figure 7 depicts the fraction transformed obtained by the LUMet technique for the second set of step cooling tests, i.e. at a holding temperature of 650°C and different holding times. These transformation kinetics curves confirm the reproducibility of the LUMet measurements. The fractions transformed at the end of each interrupted isothermal holding are 0.44, 0.58, 0.69 and 0.76 for 10, 20, 60 and 600 s, respectively.

Figure 8 shows the optical micrographs for the first set of stepped cooling transformation tests. The microstructures consist of light grey regions, which are considered as the proeutectoid ferrite, and dark grey regions, which formed during quenching after isothermal holding and are assumed to be martensite. Typically, the area fraction of ferrite gets larger with decreasing holding temperature, which is experimentally confirmed by the LUMet results shown in Fig. 6. The area fraction of ferrite has been further measured from the optical micrographs (summarized in Table 2) by using the point counting method. Here, the sampling (statistical) uncertainty is expressed as the 95% confidence interval.

| Temperature (°C) | Time (s) | Area fraction (Ave ± 95%CI) |
|---|---|---|
| 700 | 600 | 0.56 ± 0.05 |
| 675 | 600 | 0.70 ± 0.03 |
| 650 | 600 | 0.78 ± 0.04 |
| 650 | 60 | 0.73 ± 0.03 |
| 650 | 20 | 0.53 ± 0.04 |
| 650 | 10 | 0.47 ± 0.03 |
It is also noticed in Fig. 8 that at 700 and 675°C holdings, banded microstructures are observed where the ferrite grows along the horizontal direction which corresponds to the rolling direction. On the other hand, at the 650°C holding, the ferrite banding is not clearly visible anymore.
It is well established that the bands in ferrite/pearlite microstructures are strongly related to the micro-segregation of alloying elements, here Mn, that originates from the solidification process.27) The alloying elements are rejected from the δ-ferrite dendrites, leading to high solute content in the inter-dendritic regions, which is retained during the transformation from δ-ferrite to γ-austenite. The Mn distribution provides the basis for microstructural banding. One of the mechanisms to explain the banded microstructure formation is based on the effect of alloying elements on the carbon activity in austenite.28) The regions in austenite with different amounts of Mn will play a role in the nucleation sites for ferrite formation. In other words, the subsequent ferritic phase transformation during cooling will be influenced by this composition heterogeneity; ferrite will prefer to form in the low Mn regions whereas pearlite and/or martensite will likely form in the high Mn regions.
In the present study, the more distinct banded microstructure can be observed for higher holding temperatures. Since the driving force for phase transformation is smaller at higher temperatures, only the region with lower content of alloying elements, i.e. here Mn, can transform into ferrite, resulting in banded microstructures that are for example observed at the 700°C holding. In case of higher driving force corresponding to lower isothermal holding temperatures, ferrite nucleation can also occur in the regions with higher C and Mn contents such that the carbon diffusion distances are shorter, leading to finer non-banded microstructures as observed for the 650°C holding.
Figure 9 shows the optical micrographs for the stepped cooling transformation tests with a holding temperature of 650°C. It can be observed that the area of the proeutectoid ferrite increases with holding time. Ferrite nucleates along the prior austenite grain boundaries and the ferrite films get thicker with time. Further, there is indeed no indication of preferred regions for ferrite formation for these shorter holding times at 650°C that otherwise would lead to banded structures.

Figure 10 displays a comparison between the fraction transformed obtained from metallography (X-axis) and from LUMet (Y-axis). Here, the error bars for the LUMet measurements correspond to the standard deviation, which was calculated by taking the last few seconds of treatment (varying from 10 s to 100 s) using all the repeat tests. The fractions transformed measured with LUMet and metallography have accuracies as large as ± 0.03 and ± 0.05, respectively. An overall lower accuracy is achieved by metallography likely due to challenges in properly identifying the ferrite phase from the etched specimens and/or microstructure heterogeneity from image to image. Even so, Fig. 10 suggests a reasonable agreement between LUMet and metallographic fractions. Thus, the ultrasonic velocity technique can be an option to measure the proeutectoid ferrite fraction in dual phase steels during runout table cooling.

Analysis of the transformation kinetics was made using the Jonhson-Mehl-Avrami-Kolmogorov (JMAK) theory to describe the ferrite fraction transformed as a function of time.29,30,31,32) By adapting the JMAK equation for isothermal conditions, the austenite-ferrite (γ → α) phase transformation kinetics can be modeled using:
| (2) |
where fα is the fraction transformed after a given holding time t, k is the reaction rate parameter, n is the JMAK exponent, τ is the incubation time,
| (3) |
where Vi is the instantaneous velocity and Vs is velocity at the onset of the isothermal holding, is considered to be directly correlated to the transformation kinetics. Therefore, by using the maximum velocity change ΔVmax for each holding condition, the normalized velocity change
| (4) |
was here assumed to be the normalized fraction, y.
Equation (2) can be rearranged into a linear form in which the slope n and the intercept ln(k) can be found by plotting ln(ln(1/(1−y)))against ln(t−τ), as shown in Fig. 11. Here, the normalized fractions considered in the fit were taken from 0.10 to 0.90. Since the transformation starts essentially immediately when reaching the holding temperature in all conditions, τ was assumed to be zero.

Table 3 summarizes the JMAK exponent and the rate parameter for each holding temperature. These JMAK exponents obtained from the fits are within the reasonable exponent ranges of ferrite transformation in low carbon steels.33,34,35,36) Here, as the JMAK exponent is nearly the same in all three conditions, a representative average value was determined as 0.87. By using this average value, the rate parameter k can be expressed as a function of temperature with a fit that follows
| (5) |
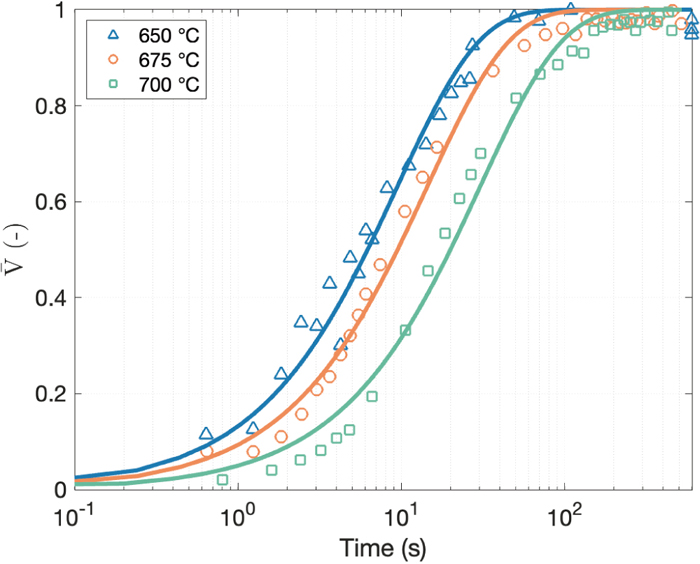
Figure 12 shows the kfit calculated by Eq. (5) for the three investigated temperatures. It is seen that k increases with decreasing temperature, i.e. with increasing undercooling, suggesting that the transformations take place in the temperature region above the nose of the time–temperature–transformation (TTT) diagram. By substituting the average JMAK exponents, and the temperature-related rate parameters into Eq. (2), the JMAK transformation kinetics can be calculated for each holding temperature. Figure 13 displays the comparison between the normalized fraction measured by the laser ultrasonic technique and the fraction calculated with the JMAK model. As can be seen, the JMAK approach is suitable to describe the ultrasound velocity evolution in the present steel. This indirectly supports that the application of the current ultrasound velocity technique for the real-time monitoring of the phase transformation kinetics is possible as it successfully captures the well-known rate parameter change with temperature regarding phase transformation.34,37)
| Temp. (°C) | n | k (s−n) | kfit (s−0.87) |
|---|---|---|---|
| 700 | 0.86 | 0.052 | 0.047 |
| 675 | 0.89 | 0.093 | 0.089 |
| 650 | 0.87 | 0.145 | 0.145 |

In this study, LUMet was used to record the austenite to ferrite phase transformation kinetics during stepped cooling in a laboratory DP steel. The important results found are summarized as follows:
* For the investigated conditions the change of laser ultrasonic velocity can be correlated with a law of mixtures, i.e., it scales linearly with the fraction transformed.
* Phase transformation kinetics measured from ultrasonic velocity and from dilatometry during continuous cooling transformation tests are in agreement within 5°C of transformation temperatures, which is within the experimental uncertainty.
* The fraction transformed measured from LUMet during stepped cooling agrees well with the ferrite phase fraction of the dual phase microstructures obtained from metallography. Depending on the heat treatment, banded dual phase microstructures were observed. Banding, however, has a negligible impact on the LUMet measured fraction transformed.
* The evolution of the ferrite fraction during isothermal holding can be described by the JMAK approach. The JMAK exponent and the rate parameters are consistent with literature data for the austenite-to-ferrite transformation.
* Overall, the presented study confirms the potential of laser ultrasonics to in situ record ferrite formation during runout table cooling of DP steels.
This research has been partly funded by The Natural Sciences and Engineering Research Council of Canada (NSERC) and the steel studied has been provided by Nippon Steel Corporation.