Abstract
This report describes surface water temperature measurements obtained by an
autonomous observing instrument “UpTempO” as a part of RV
Mirai Arctic cruise in 2014, MR14-05. The UpTempO is a drifting
buoy consisting of an underwater thermistor chain, carrying 16 thermistors
and 3 pressure sensors, and a surface floating unit for Iridium satellite
communication with sensors of sea surface temperature and sea level
pressure. Three UpTempOs have been deployed from RV Mirai in the
ice-free Chuckhi Plateau. UpTempOs have successfully collected the
near-surface temperature data to reveal seasonal change of surface layer
heat content during a transition from late summer to mid-winter. The past
Mirai expeditions, aiming to reveal the yearlong air-sea heat
exchange in the Arctic, has faced difficulties to continue the observation
after the surface freezing onsets since RV Mirai is not designed to
sufficiently resist pressures from surrounding ice floes. Then, deploying
the autonomous instrument such as UpTempO from the ship could make it
possible to carry out the prolonged observation even the freezing onset
onward.
1. Introduction
The Arctic ice cover has experienced an extreme reduction over the last few
decades (Comiso, 2008; Parkinson and Cavalieri, 2002). The Arctic
sea-ice extent reached a record minimum in September 2012 displacing the
same month in 2007. This diminished ice condition in the Arctic Ocean
could massively influence the global climate system by causing the enhanced
atmospheric disturbances (Honda et al., 2009; Inoue and Hori,
2011), propagating towards the lower latitudes as planetary waves, since
the air-water heat exchanges can be promoted.
In the polar seas, there has been common difficulties in executing
scientific observations, especially collecting under-ice hydrographical
data because it requires many research staff, technical facilities and
operational platforms such as ships with ice-breaking ability, submarines
and sea-floor moorings (e.g. Surface Heat Budget of the Arctic (SHEBA)).
Currently, non-manned hydrographical observation using autonomous observing
systems, which are mostly installed on perennial ice floes and communicate
via an Iridium satellite, are partly replacing the ship-based in situ observation in the Arctic (e.g. Krishfield et al., 2005;
Richter-Menge et al., 2006).
The JAMSTEC Arctic research team has investigated the atmospheric and
oceanographic changes in the use of autonomous observing instruments:
JAMSTEC Compact Arctic Drifter (J-CAD) for 2000-2005 (Kikuchi et al., 2002) and Polar Ocean
Profiling System (POPS) for 2006-2013 (Kikuchi et al., 2007;
Kawaguchi et al., 2012) as a part of the North Pole Environmental
Observatory Program (NPEO; principal investigator, James Morison of U.
Washington). During MR14-05, the western Arctic summer expedition of the RV
Mirai, we have deployed a new type of autonomous observing
instrument “UpTempO”, carrying an under-water thermistor chain, in the
ice-free Chukchi Plateau.
This article describes the observation of upper water temperature and heat
content using the UpTempO buoys. Section 2 gives the detailed description of
UpTempO and MR14-05. In Section 3, the observed temperature from UpTempOs
and their trajectories are illustrated. In Section 4, a brief conclusion and
future works will be noted.
2. Methods
2.1 UpTempO
UpTempO (product name: Marlin Iridium SVP- BTC/RTC/GPS Ice Buoy, manufactured
by Marlin-Yug) (Fig. 1) is an autonomous instrument capable of automation
operation on ice and in water. The buoy executes measurements of barometric
pressure, sea surface temperature, and temperature profile down to the depth
of 60 m. The wire line has 3 ocean pressure sensors at 20, 40, and 60 m,
and 16 thermistors at vertical intervals of 2.5 m over 2.5-20 m depth and
5 m over 20-60 m. The under-water thermistors are 0.1℃ in accuracy and
0.01℃ in resolution. The data sampling and transmission through Iridium
satellite system are made every an hour.

The UpTempO buoy project is led by Mike Steele and Ignatius Rigor of Polar
Science Center, University of Washington. They aim to reveal how the
magnitude of ocean surface warming is accelerating in the pan Arctic region
as sea ice thins and retreats in the recent summers. Nearly real-time data
and detailed information of UpTempO is available from http://psc.apl.washington.edu/UpTempO/UpTempO.php (web & data manager: Wendy Ermond).
2.2 MR14-05
MR14-05 is an Arctic summer expedition based on RV Mirai with a scientific theme of “The Predictability Study of the Arctic Cyclones”
(Inoue, 2014). The entire observation period was between August 31 and
October 10, 2014. As a main program during this cruise, we carried out
a fixed-point-observation (FPO) at location of (74.75°N, 162.0°W) in the
Northwind Abyssal Plain (the east of Chukchi Plateau) in the ice-free
Arctic (Fig. 2), where 147 radiosonde launches, 97
conductivity-temperature-depth (CTD) casts, 177 microstructure measurements
were carried out.
Three UpTempOs were deployed during the FPO program, referred to as UpT13,
14, and 15 for their identification. All buoys were placed into surface
water from Mirai's stern deck. The deployment of UpT13, 14 and 15 was made respectively at location of (74-22.75°N, 163-57.46°W),
(74-33.02°N, 163-30.14°W) and (74-54.74°N, 163-34.98°W) and at time
of 01:06Z on 6th, 10:32Z on 14th, and 16:32Z on 14th September 2014
(Fig. 3a).
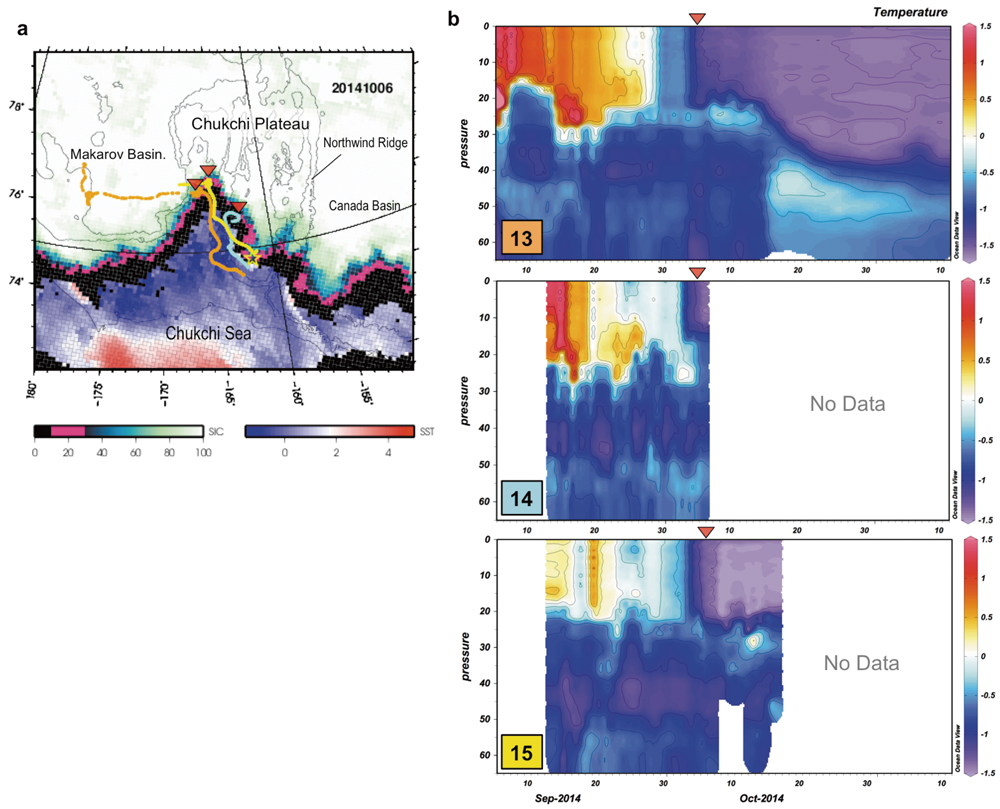
As of the late February in 2015, UpT13 has been only buoy that is reporting
the seamless data. Meanwhile, other two UpTempOs (UpT14 and 15) terminated
its data sending following the surface freezing onset, at which almost
simultaneously all of the instruments entered the marginal ice zone (Fig. 3b). This probably means that the spherical-shaped surface floats have
either underlain the ice floes or been breached by lateral pressure from
surrounding ice floes. To prevent this fault, we will attempt to replace the
spherical full into conical-shaped one in the future opportunity because the
lateral ice pressure may less affect it.
3. Preliminary Results
This section describes the preliminarily upper water temperature recorded by
the UpTempOs between early September and mid-November when the seasonal
change in surface heat content is the most dramatic.
Initially, from early September to mid-September, the sea water is the
warmest at depths shallower than 20-30 m, underneath which it is colder
with the lowest temperatures of -1.3 - -1.2℃ at 30-40 m depth (Fig. 3b). In the near-surface warm layer, UpT13 and 14 show the maximum
temperature being about 1.3-1.5℃, while UpT15 shows temperatures no
warmer than 0.2℃, implying there is a horizontal surface front structure
between the deployment positions of UpT14 and UpT15 (Fig. 3b). Therefore,
the total heat content within the 20 m surface layer, an accumulation of
temperature deviation from the freezing point, is about 1.5-2.4×10⁸ J m-2. According to the shipboard meteorological observation, the sum of net shortwave, longwave, latent, and sensible heat fluxes near the water surface was approximately 50-60 W m-2 (air cools the water) on average for 5-26th September. With this surface flux, it takes roughly
a month to release the overall heat content within a surface mixed layer
(SML) to the air.
Unfortunately, we cannot determine the exact depth of SML since the present
type of UpTempOs carries no conductivity sensor. Instead, with
hydrographical profiles obtained by an expendable CTD observation at nearly
the same position as UpT14 was, the SML depth was calculated at about 18-22 m on 6th September, where the maximum stratification is mainly
responsible for a salinity gradient ranging 27.4-29.5 psu over vertically
10 m; this halocline depth gives a good agreement with the maximum gradient
in UpTempO's vertical temperature profile.
In the surface layer within 20 m depth, temperature continues to decrease
until the mid-October when it gets to almost the freezing point of -1.6℃
(Fig. 3b). Prior to the late September, the thermistor chain of UpT13 and
14 shows that there is a vertical temperature inversion - the colder water
(~ 10 m depth) overlies the warmer water in the deeper
SML. In this period, we guess the surface heat flux due to the atmospheric
cooling deprives the oceanic heat mostly from the thin boundary layer, and
there is surely insignificant heat supply from the layer underneath the
SML (i.e. no catastrophic mixing eroding the SML base). In fact, the
ship-based microstructure measurement at the FPO station depicts that the
deeper SML is relatively quiet from the mid- to late September, where the
buoyant Reynolds number is generally less than 20 (Yamazaki, 1990). After
the freezing temperature achieved, temperature profile becomes nearly
homogeneous and gradually deepened down to ~ 35-40 m depth
by 25th October. This suggests that the buoyancy-driven convective
motion, accompanying sea-ice formation in the surface water, actively eroded
the SML base (e.g., Kikuchi et al. 2004; Peralta-Ferriz and Woodgate, 2015). After that, it persists at the nearly freezing temperature.
The all buoys travelled towards northwest along the local bathymetry (Fig. 3a). The traveling speed was approximately between 10 to 30 cm s-1.
This can be considered that the travelling of the UpTempOs was influenced by
the westward flow of Beaufort Gyre (BG), located to the north of the Alaskan
continental shelf (McPhee 2013; Brugler et al. 2014; Nishino et al. 2011). Considering initially 0.2-1.3℃ warm SML (1.8-2.9 kelvin above
the freezing), the near-surface current may produce a lateral heat flux
of 1.5-7.2 × 10⁷ W per width towards the central Chukchi Plateau in the early September. Indeed, the obvious delay of surface freezing was
observed in the BG's downstream region including the west of Chukchi
Plateau, (75-76.5°N, 163-166°W), where the buoys actually went through
(Fig. 3a). This consequence may be applied to that in the other recent
summers; e.g. surface velocity profiler's trajectories in October
2013 (deployed off the Barrow Canyon during MR13-06) similarly indicated
the delay of ice formation along the pathway of the BG's westward current
(Kawaguchi and Nishino, 2014). Similarly, based on their mooring array
across the Beaufort shelf-break and -slope, Brugler et al. (2014) show that
the eastward boundary current transporting the warm Chukchi summer water has
dramatically decreased between 2002 and 2011. They argue that the warm
Chukchi water instead exits the Barrow Canyon entering the Canada Basin and
then is transported towards the Chukchi Plateau by the BG westward jet.
4. Conclusion and Future Works
Upper water temperature observation was performed using the UpTempO buoys
during MR14-05 in collaboration with Polar Science Center of U.
Washington. During the cruise, three UpTempOs were deployed in the east part
of ice-free Chukchi Plateau. The UpTempOs have successfully collected the
data to show how upper water temperature is changing during a transition
between late summer to mid-winter including the surface freezing event.
In the past Mirai expeditions we have had difficulties retrieving the hydrographic data in the ice-covered Arctic Ocean especially once the
surface water starts to freeze. Hence, it is rather rare to obtain the
year-round temperature data in the seasonally open water region near the
central Arctic, which describes the surface water being cooled by the air
and frozen. In this sense, utilizing the autonomous observing instrument
would be a very effective means to gain a better understanding about the
yearlong air-ice-ocean coupling system in terms of heat in the western
Arctic Ocean. Thus, in future on-site examinations, the combination of the
ship-based manned observation and the use of autonomous instrument would
give a particular advantage and progress in this scientific field.
Acknowledgments
We wish to thank the captain, officers, and crew of the RV Mirai, which was operated by Global Ocean Development Inc. The MR14-05 cruise was
principally directed by J. Inoue of NIPR as a chief scientist. The UpTempO's
temperature data and webpage are managed by W. Ermond of U. Washington. The
AMSR-2 data in Fig. 3a are archived and provided by the ADS team of National Institute of Polar Research.
References
-
Brugler, E.T.
,
R.S. Pickart
,
G.W.K. Moore
,
S. Roberts
.,
T.J. Weingartner
, and
H. Statscewich
(2014), Seasonal to internannual variability of the Pacific water boundary current in the Beaufort Sea, Progress in Oceanogr., 127, 1-20.
-
Comiso, J.C.
,
C.L. Parkinson
,
R. Gersten
, and
L. Stock
(2008), Accelerated decline in the Arctic sea ice cover, Geophys. Res. Lett., 35, L01703, doi:10.1029/2007GL031972.
-
Honda, M.
,
J. Inoue
, and
S. Yamane
(2009), Influence of low Arctic sea-ice minima on anomalously cold Eurasian winters, Geophys. Res. Lett., 36, L08707, doi:10.1029/2008GL037079.
-
Inoue, J.
, and
M.E. Hori
(2011), Arctic cyclogenesis at the marginal ice zone: A contributory mechanism for the temperature amplification?, Geophys. Res. Lett., 38, L12502, doi:10.1029/2011GL047696.
-
Inoue, J.
(2014), R/V Mirai Crusie Report MR14-05, JAMSTEC, <http://www.godac.jamstec.go.jp/catalog/data/doc_catalog/media/MR14-05_all.pdf>.
-
Kawaguchi, Y.
,
J.K. Hutchings
,
T. Kikuchi
,
J.H. Morison
, and
R.A. Krishfield
(2012), Anomalous sea-ice reduction in the Eurasian Basin of the Arctic Ocean during summer 2010, Polar Science, 6, 39-53.
-
Kawaguchi, Y.
, and
S. Nishino
(2014), An observational study of ocean currents and an eddy in the Arctic Ocean using drifting buoys with drogues at selected depth-trial experiments during RV Mirai Arctic cruse in 2013, JAMSTEC Rep. Res. Dev., 18, 29-39.
-
Kikuchi, T.
,
J. Inoue
, and
D. Langevin
(2007), Argo-type profiling float observations under the Arctic multiyear ice, Deep-Sea Res. I, 54, 1675-1686.
-
Kikuchi, T.
,
K. Hatakeyama
,
K. Shimada
,
T. Takizawa
, and
J. Morison
(2002), Oceanographic observation under the multi-year ice of the Arctic Ocean using J-CAD, Proceedings of the 17th International Symposium on Okhotsk Sea and Sea Ice.
-
Kikuchi, T.
,
K. Hatakeyama
, and
J.H. Morison
(2004), Distribution of convective lower halocline water in the eastern Arctic Ocean, J. Geophys. Res., 109, C120301.
-
Krishfield, R.A.
, and
D.K. Perovich
(2005), Spatial and temporal variability of oceanic heat flux to the Arctic ice pack, J. Geophys. Res., 110, C07021, doi:10.1029/2004JC002293.
-
McPhee, M.
(2013), Intensification of geostrophic currents in the Canada basin, Arctic Ocean, J. Climate, 26, 3130-3138, doi:10.1175/JCLI-D-12-00289.1
-
Nishino, S.
,
T. Kikuchi
,
M. Yamamoto-Kawai
,
Y. Kawaguchi
,
T. Hirawake
, and
M. Itoh
(2011), Enhancement/reduction of biological pump depends on ocean circulation in the sea-ice reduction regions of the Arctic Ocean, J. Oceanogr., 67, 305-314, DOI 10.1007/s10872-011-0030-7.
-
Peralta-Ferriz, C.
, and
R.A. Woodgate
(2015), Seasonal and interannual
variability of pan-Arctic surface mixed layer properties from 1979 to 2012
from hydrographic data, and the dominance of stratification for multiyear
mixed layer depth shoaling, Progress Oceanogr., in press.
-
Richter-Menge, J.A.
,
D.K. Perovich
,
B.C. Elder
,
K. Claffey
,
I. Rigor
, and
M. Ortmeyer
(2006), Ice mass-balanced buoys: a tool for measuring and attributing changes in the thickness of the Arctic sea-ice cover, Ann. Glaciol., 44, 205-210.
-
Parkinson, C.L.
, and
D.J. Cavalieri
(2002), A 21 year record of Arctic
sea ice extents and their regional, seasonal and monthly variability and
trends, Ann. Glaciol., 34, 441-446.
-
Yamazaki, H.
(1990), Stratified turbulence near a critical dissipation rate, J. Phys. Oceanogr., 20, 1396-1583.
