Abstract
In order to determine magnetic mineral distributions in nearshore marine
sediments off southwestern Chile, chemical analysis of bottom waters and
rock magnetic characterization of surface sediments were performed. The
samples analyzed are terrigenous and calcareous sediments recovered with a
multiple corer at five stations. Calcareous sediments occur at stations with
highly dissolved oxygen catchment in the bottom waters.
Concentration-dependent magnetic parameters of calcareous sediment samples
show relatively low values, and their magnetic grain sizes are coarse.
Higher values of concentration-dependent magnetic parameters are recognized,
and fine grain magnetic minerals are distributed in silty and sandy clay
sediments. Magnetic mineralogy of the sediment samples reflects not only
lithology but also redox conditions in the overlying bottom waters.
Thermo-magnetometry results suggest that magnetite (Fe3O4), hematite (αFe2O3), (titano)maghemite (γFe2O3), and goethite (αFeOOH) are common in sediment samples at all stations. Higher coercivities and total organic carbon (TOC)
values are also observed at oxic stations, suggesting the presence of
goethite and (titano)maghemite. In general, higher TOC contents in sediments
lead anoxic conditions due to organic matter decomposition, therefore
goethite and (titano)maghemite are unstable. Despite higher TOC contents in
this sediment sample, such magnetic minerals can present. This implies that
the magnetic minerals are kept in oxic conditions.
1. Introduction
Rock magnetic properties of nearshore marine sediments have been used as
proxies of detrital mineral supply changes (e.g., Bloemendal et al., 1992;
Walden et al., 1999; Zhang et al., 2008; Liu et al., 2012). Nearshore marine
sediments generally have high sedimentation rates because of larger
terrigenous sediment inputs, and are expected to preserve as high-resolution
records of paleo-environmental and paleoclimate variations (e.g., Bloemendal et al., 1992; Evans and Heller, 2003; Maher 2011; Liu et al., 2012).
However, magnetic minerals can dissolve and/or form, depending on redox
conditions within sediments (e.g., Berner 1980; Karlin and Levi, 1983, 1985, Henshaw and Merrill, 1980; Canfield and Berner, 1987; Leslie et al., 1990a, b; Karlin, 1990; Roberts and Turner, 1993; Liu et al., 2004; Garming et al., 2005; Rey et al., 2005; Kawamura et al., 2008; 2012; Rowan et al., 2009; Liu et al., 2012). In order to interpret paleomagnetic records from nearshore
sediments, understanding of magnetic mineral assemblages is required, and
what are reflected and recorded to them is essential.
The studied nearshore sediments are from the southeastern Pacific Ocean
along the southwestern part of Chile, which is characterized by a complex
system of fjords and channels (Figure 1). Strong poleward winds cause heavy
precipitation. Ice melting and rainfall greatly enhance the supply of
terrigenous sediments to the area. Fresh water is lighter than saltwater and
remains at sea surface, which causes surface salt water to sink. As a
result, the Subantarctic Mode Waters (the precursor of the Antarctic
Intermediate Water) forms along the coast of southern Chile, which has a
large impact on ocean circulation (e.g., Warren and Wunsch, 1981; Downes et al., 2009). Nearshore sediments in this study area are generally rapidly
deposited, and are expected to be good archives of paleo-environmental
changes. The aim of this study is to understand how magnetic minerals
assemblages and the grain sizes of magnetic minerals are affected by the
redox state of overlying bottom waters along the southwestern coast of
Chile. This study reports the analytical results of bottom water and
sediments, which are taken from various redox states at five stations.
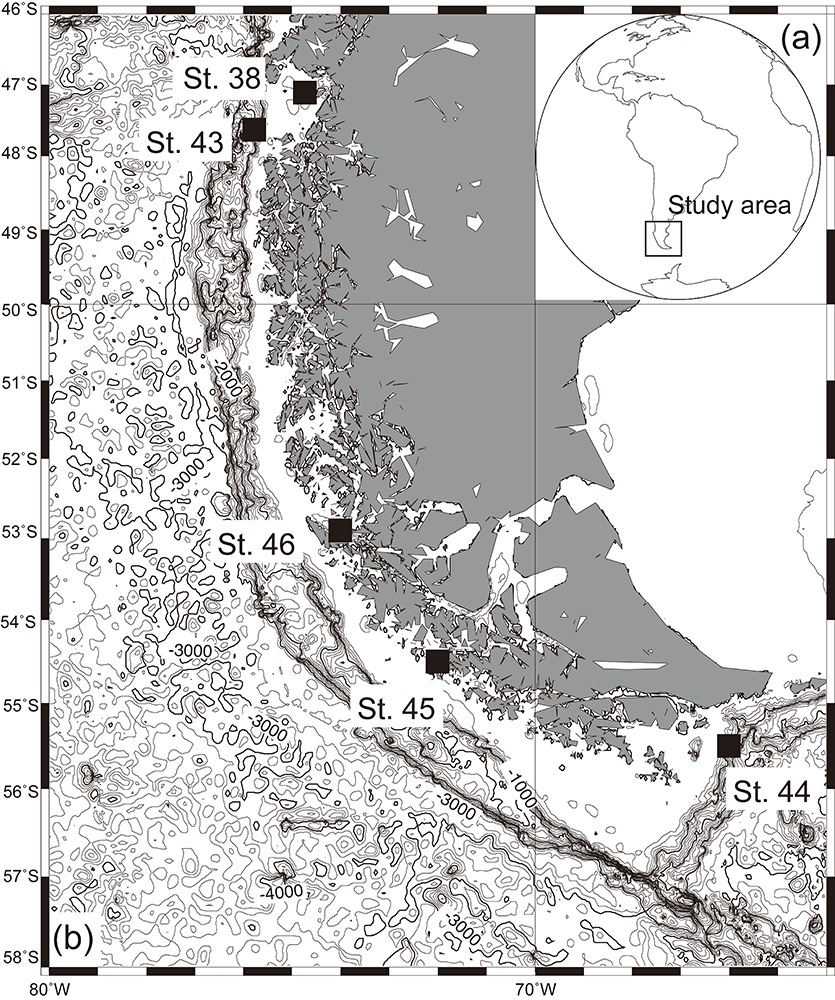
2. Study area and samples
Samples were collected at five stations in the south Pacific bays offshore
southwestern Chile during the MR08-06 cruise of the R/V Mirai
(Japan Agency for Marine-Earth Science and Technology) in March, 2009
(Figure 1; Table 1). A multiple corer (Rigo Co., Ltd.) was used to sample
the sediment-water interface. The recovered sediments consist of terrigenous
and calcareous silty clay, sandy clay, and/or sand
(Table 1; Harada, 2008).
3. Methods
3.1 Chemical analyses of bottom waters
Dissolved oxygen (DO) of bottom waters was measured directly with a DO meter
(Horiba Co., Ltd., OM-51-2) onboard immediately after recovering of the
multiple cores. Dissolved iron in bottom waters was prepared for analysis
according to Achterberg et al. (2001). Bottom water just above the
sediment-water interface was taken from the cores using a plastic syringe.
The water samples were passed through a filter (pore diameter of 0.45 $\mu$m), and the samples 30 mL were stored in Teflon bottles. The water
samples were treated with 1 mL of special grade nitric acid (1 mol/L concentration), and pH was kept below 1 at room temperature. The concentration of dissolved iron (DI) was measured with a flameless graphite
furnace atomic adsorption spectrometer (Shimadzu Co., Ltd., AA-6800) at the
Japan Coast Guard Academy (JCGA). The samples were diluted 6-10 times for
the measurements. Standard samples were made by diluting an iron standard
solution
(Nakarai Tesque Co., Ltd.) to 0.05-0.1 nmol/L using pure water, and
by adding 400 $\mu$L of special grade nitric acid. DI
measurements were
carried out seven times per sample, and the averages were calculated.
3.2 Total organic carbon (TOC) and total nitrogen (TN) in the sediments
Concentrations of total organic carbon (TOC) and total nitrogen (TN) in the
sediments were analyzed using a CHNS (carbon, hydrogen, nitrogen, and
sulfur) analyzer (vario EL III, Elementar Co. Ltd.) at JCGA. Dried and
powdered sediment samples of approximately 20 mg were used. TOC/TN ratios
represent the sources of organic materials in the sediments, and its high
value indicates that
the sediments are rich in organic materials of detrital
origin (e.g., Emerson and Hedges, 1988).
3.3 Rock magnetic analyses
Wet samples were taken from the top of five multiple cores using 6.7 cm3 plastic cubic boxes (Natsuhara Giken). The cube samples were used
to measure the low-field magnetic susceptibility $(\chi )$, natural remanent
magnetization (NRM), anhysteretic remanent magnetization (ARM), and
isothermal remanent magnetization (IRM) at Kyoto University. $\chi $ was
measured with a Kappabridge KLY-3S magnetic susceptibility meter. NRMs and
ARMs were measured with a 2-G Enterprises model 760 superconducting rock
magnetometer. ARMs were imparted to samples using a steady direct current
(DC) bias field of 0.1 mT in a peak alternating field (AF) of 100 mT. $\chi$ARM was calculated by dividing the ARM by the value of the steady bias
field (Banerjee et al., 1981). A saturation IRM (SIRM) was imparted in a 2.5
T inducing field and an IRM was induced with a backfield of 0.3 T along one
sample axis. These IRMs were measured with a spinner magnetometer
(Natsuhara-Giken SMM-85). The hard IRM (HIRM) and S-0.3 T
were calculated according to the definitions of Bloemendal et al. (1992):
|
\[
\text{HIRM} = (\text{SIRM} + \text{IRM}_{-0.3\, \text{T}})/2,\ \text{and}
\]
\[
\text{S}_{-0.3\, \text{T}} = (1 - \text{IRM}_{-0.3\, \text{T}}/\text{SIRM})/2.
\]
| |
All cube samples were dried in an oven at 40℃ after the
measurements. Each mass-specific rock magnetic parameter was calculated
using the weight of the dried cubic sample.
In order to determine magnetic minerals in the samples, thermal
demagnetization of composite IRMs (Lowrie, 1990) were conducted. The dried
powder samples (ca 50 mg) were packed in a small quartz cup (5 mm in
diameter and 10 mm in height). A magnetic field of 2.5 T was applied along
the vertical direction of the cup, and then fields of 0.3 T and 0.07 T were
applied successively along the two remaining perpendicular axes using a
pulse magnetizer (Magnetic Measurements Ltd. model MMPM-9). A magnetic field
of 0.07 T was used to detect magnetite and greigite (e.g., Oda and Torii, 2004). The remanent magnetization was measured with a 2-G Enterprises 760R
magnetometer at Kyoto University. Low-temperature magnetometry was conducted
using a Quantum Designs magnetic property measurement system (MPMS-XL5) at
the Center for Advanced Marine Core Research, Kochi University.
Approximately 50 mg chips were taken from the dried samples and were packed
in a capsule. An IRM was imparted to the samples at 5 K in a 2.5 T field,
and the remanent intensities were measured from 5 K to 300 K in a zero-field
at 2 K intervals.
Hysteresis loop measurements and direct-current demagnetization (DCD)
of a saturation remanent magnetization (Mrs) were performed on 10-30 mg
sediment chips with an alternating gradient magnetometer (AGM, Model
2900-02, Princeton Measurements Corporation) at Kyoto University. Five
sediment chips per station were measured. The maximum applied field was 1.0
T and the field increment was 2 mT during hysteresis and DCD measurements.
Coercivity (Hc), saturation magnetization (Ms), and saturation
remanent magnetization (Mrs) were determined from the hysteresis
measurements. The coercivity of remanence (Hcr) was determined from DCD
results.
First-order reversal curve (FORC) measurements were conducted using an
alternating gradient magnetometer (AGM, Princeton MicroMag 2900). The field
spacing between measurements was set to 1 mT. A total of 193 FORCs were
measured, with Hc between 0 mT and 80 mT, and Hu between -50 mT and 50 mT.
The software ''FORCinel ver. 2.03'' of Richard Harrison
(https://wserv4.esc.cam.ac.uk/nanopaleomag/) was used for data processing,
and a smoothing factor of 3 was adopted (Harrison and Feinberg, 2008).
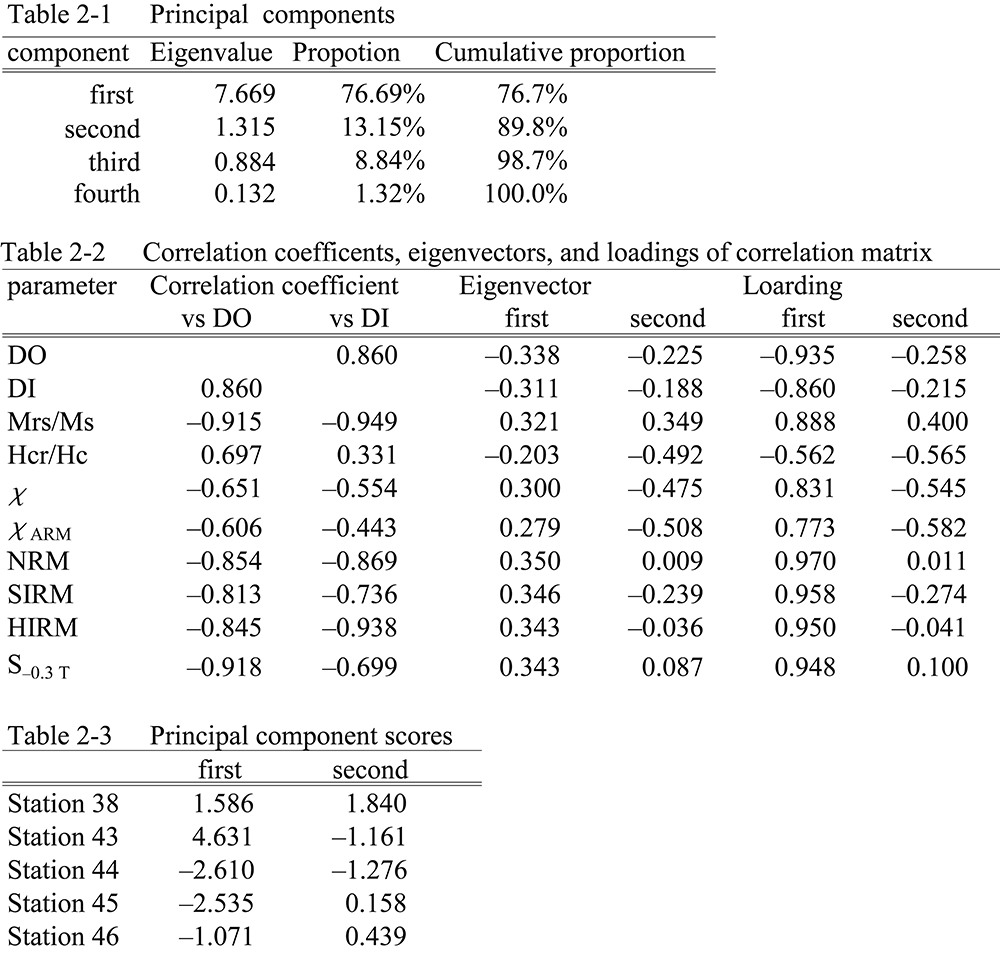
3.4 Principal component analysis
In order to clarify the relationship between redox conditions in bottom
waters and magnetic properties of the sediment samples, principal component
analysis was performed on a matrix of correlation coefficients among values
of DO, DI and rock magnetic parameters shown in Figure 2. The software
''Excel Statistics for Windows'' (Social Survey Research Information Co.,
Ltd.) was used. Results are listed in Table 2.
4. Results
4.1 DI and DO in bottom waters
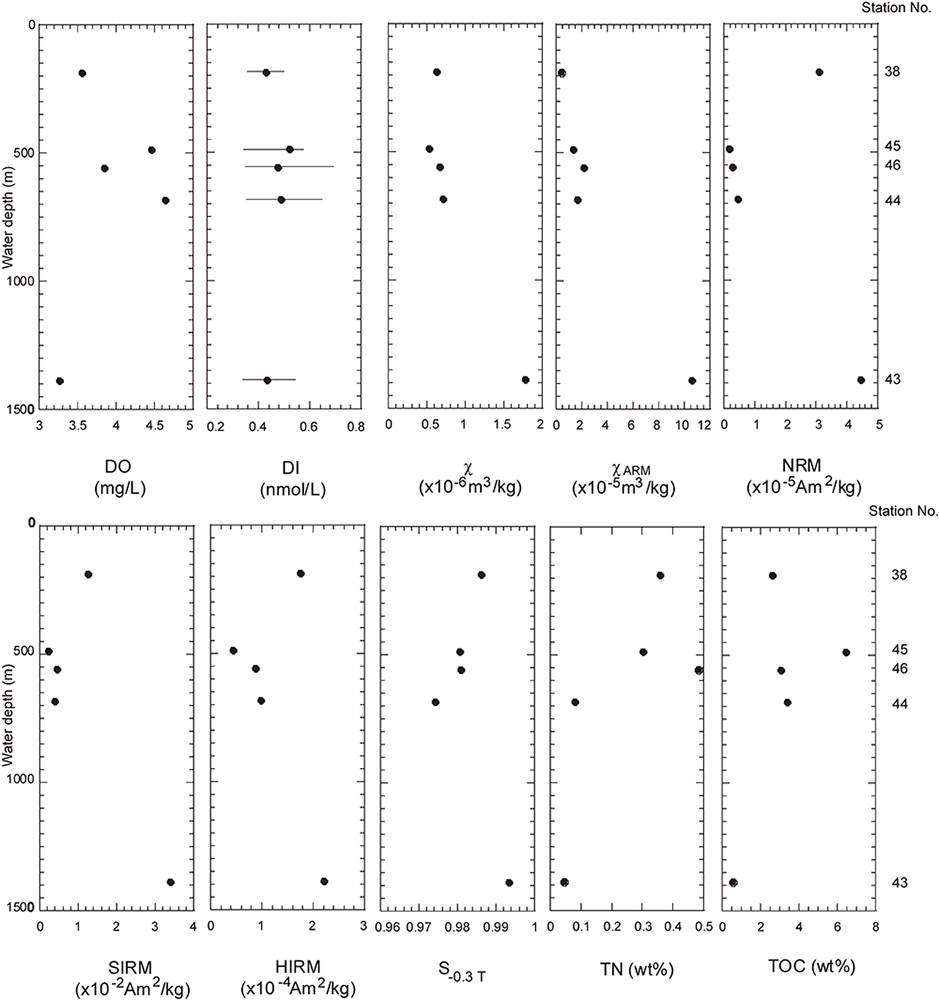
DI and DO values of bottom waters are shown with water depths of the five
stations in Figure 2. DO values are relatively low at stations 38 and 43,
while high values are found at stations 44, 45, and 46. The physical
structure of the water column in this area was investigated using a
conductivity temperature depth profiler (Harada, 2008), and
vertical profiles of DO values were measured at all stations in this study.
DO values of bottom waters at the five stations of Harada (2008) are
coincident with our data. DI averages did not vary significantly among the
stations. However, variations in DI are similar to DO. This means that the
concentration of iron hydroxides in suspended solids (<0.45 $\mu$m in
diameter) are highly to be present in the relatively oxic bottom waters
(e.g., Aston and Chester, 1973).
4.2 TN and TOC in the sediment samples
TN and TOC values are listed in Table 1 and Figure 2. The lowest values of TN and TOC are
recognized at station 43. TOC values are low at stations 38 and 43, which
consists of silty clay and sandy clay with nannofossils and are under
relatively anoxic bottom waters. TOC contents of the sediment samples from
stations 44, 45, and 46 indicate relative high values, and are consisted of
foraminiferal and/or calcareous clayey sand. TOC/TN ratio shows high values
at stations 44 and 45. It means that terrestrial organic matters are
abundant in the sediment samples.
4.3 Rock magnetic parameters
Rock magnetic parameters are shown in Figure 2. The concentration-dependent
rock magnetic parameters, such as $\chi $, $\chi$ARM, and SIRM, have
the highest values at station 43. A sample from station 38 shows the second
highest values except for $\chi$ARM. Samples from the other stations
(44, 45 and 46) have relatively low values, which consist of calcareous
sands with foraminifera. NRM values show a similar pattern to SIRM values.
HIRM variation resembles those of $\chi $ and SIRM; higher HIRM values occur
at stations 38 and 43. S-0.3 T variation is similar to those of the
concentration-dependent magnetic parameters. S-0.3 T is higher at
stations 38 and 43 than the other stations, which suggests that the
proportion of low coercivity magnetic minerals is high at these stations.
The minimum value of S-0.3 T is observed at station 44 with high DO
and DI values in bottom waters, whereas samples from stations 38 and 43 with
relatively lower DO and DI values in bottom waters show relatively higher
S-0.3 T values.
Thermal demagnetization results of composite IRMs for samples from all
stations are shown in Figure 3. Soft (<0.07 T), and medium (0.07-0.3 T)
components are demagnetized completely at around 580℃, which is
the Curie point of magnetite, for samples from stations 38, 44, 45, and 46
(Figure 3). Slight thermal decay of the hard components (<2.5 T) is observed
at around 675℃, which is the Curie point of hematite, in all samples.
An inflection in demagnetization curves at around 300℃ is
recognized in samples from all stations (Figure 3). Authigenic greigite
(e.g., Roberts et al., 2011) is not expected to form under an oxic water
column. The inflection suggests the presence of (titano)maghemite (e.g.,
Özdemir and Banerjee, 1984; Ishikawa and Frost, 2002). A decrease at
around 620℃ is shown in all samples (Figure 2), which also
suggests the presence of maghemite (e.g., Heider et al., 1992). The
remanent magnetization intensities of the hard component decreases at
120℃ in stations 38 and 43 samples (Figures 3a and 3b), which
corresponds to the Néel temperature of goethite (e.g., Bocquet and Kennedy, 1992; Özdemir and Dunlop, 1996). The intensity of the high
coercivity component is higher at station 44 than the other stations (Figure 3c).

Results of low-temperature magnetometry are show in Figure 4. The IRM
warming curves for all samples show clear decreases at around 120 K (Figure 4), which represents the Verwey transition of magnetite (Verwey, 1939). The
decline from 5 K to 50 K in the station 44 sample suggests the presence of
goethite (e.g., Liu et al., 2006) or it is attributable to paramagnetic
minerals.

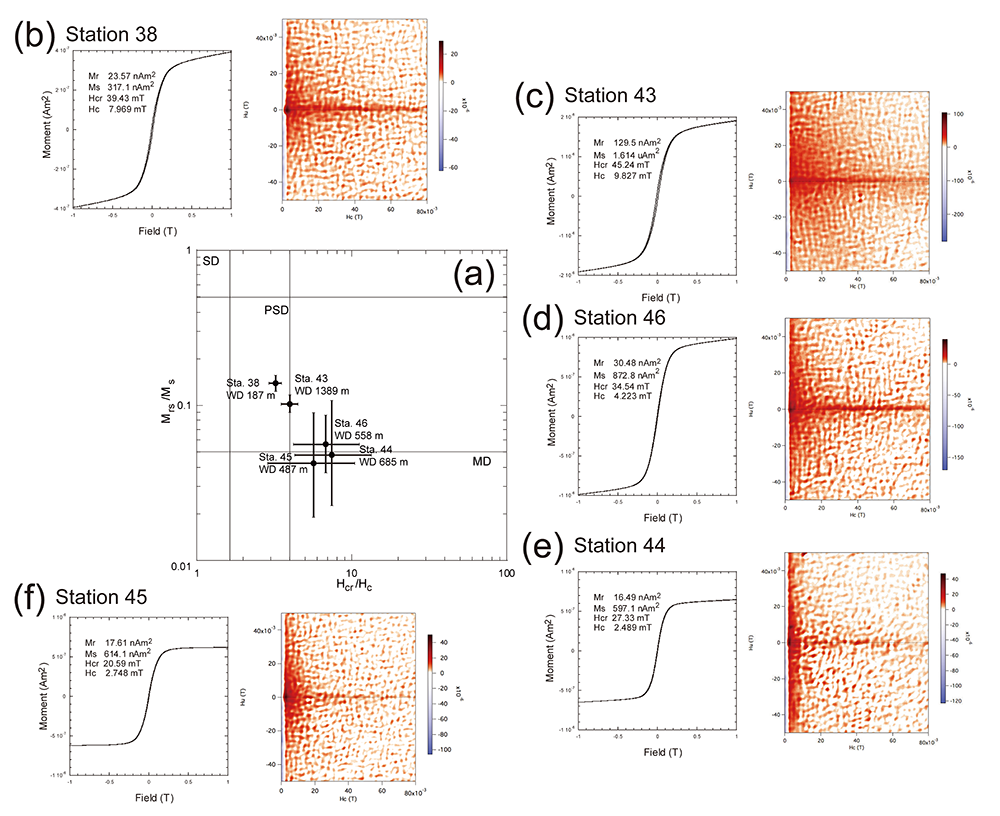
Magnetic grain size dependent parameters (Mrs/Ms and Hcr/Hc) are shown as a Day plot (Day et al., 1977) in
Figure 5. Most samples from stations 38 and 43, which have low DO values of
bottom water and consist of sandy or silty clays with nannofossils, are
located in or around the pseudo-single domain (PSD) region (Figure 5). Data
for samples from stations 44, 45, and 46, which consist of foraminiferal or
calcareous clayey sands (Table 1), plot in or around the multi domain (MD)
region of the Day plot. FORC diagrams of the sediment samples are also shown
in Figure 5. A component that spread to Hu-axis direction and low Hc values,
which is attributable to MD were recognized in all samples. Especially the
MD component was dominant in station 44 sample. A ridge along the horizontal
axis is recognized at stations 38, 43, and 46 samples (Figures 5b, 5c, and 5d), while the ridge is vague in stations 44 and 45 sediment samples (Figure 5e and 5f). It means that non-interacting SD magnetic minerals may be
included in the samples in stations 38, 43, and 46 samples.
According to correlation coefficients and coefficients of determination
(Table 2), DI shows higher positive relationship with DO, and
Mrs/Ms, NRM, SIRM, HIRM, and S-0.3 T have relatively
higher negative relationship with DO. The result of the principal component
analysis indicates that eigenvalues of the first component with the
proportion of 76.7% are relatively high in DO with negative sign and in
NRM, SIRM, HIRM and S-0.3 T with positive one (Tables 2-1 and 2-2). The
scores of the first component for the five stations decrease with increasing
DO values (Tables 1 and 2-3). It may be inferred that the first component is
a factor representing the negative correlation between DO and the rock
magnetic parameters with higher eigenvalue. The second principal component
with the proportion of 13.2% shows a higher positive eigenvalue in
Mrs/Ms, and higher negative ones in Hcr/Hc, $\chi$, and $\chi $ARM. The meaning of the second component is obscure.
5. Discussion
Variations in magnetic concentration-depended parameters seem to correspond
to lithology. The lithology at the five stations is listed in Table 1. At
stations 44 and 45 (foraminiferal sand) and station 46 (calcareous clayey
sand), the concentration-dependent parameters ($\chi$, SIRM, and HIRM) have low values. At stations 38 and 43 (silty clay and sandy clay with
nannofossils), these parameters have high values (Figure 2). The rough
lithological difference is recognized among the stations. Calcareous grains
are diamagnetic and has a weak negative response to an applied magnetic
field (e.g., Thompson and Oldfield, 1986). Ferromagnetic minerals in the
sediments at stations 44, 45, and 46 would be diluted by such diamagnetic
materials and/or non-magnetic minerals, thus the concentration of
ferromagnetic mineral is low.
Compositions of magnetic minerals in the sediment samples are locally
different. Magnetite, maghemite, and hematite are common at the all stations
(Figures 3 and 4). The decline of the hard components at around 80-120℃ in
thermal demagnetization indicative of goethite is observed at stations 38
and 43. S-0.3 T values are relatively high at stations 38 and 43,
which are also characterized by relatively low DO values in the bottom
water. On the other hand, S-0.3 T of stations 44, 45, and 46 are low,
where DO values are relatively high. Maghemite is known as an iron oxide
distributed under an oxic environment, and has higher coercivity than
magnetite (e.g., Walden et al., 1999; Laurent et al., 2008). The highest DO
value is observed at station 44, and which has the lowest S-0.3 T
value (Figure 2). Hard IRM component of station 44 decreases at around 300℃
(Figure 3c). It is suggested that maghemite is aboundant in station 44
sample. As shown in the Day plot and FORC diagrams (Figure 5), magnetic
grain-size dependent parameters (Mrs/Ms and Hcr/Hc) indicate that the magnetic grain-size is finer at stations 38 and 43 than at
the other stations (Figure 4).The results indicate that oxic bottom water
significantly affect to magnetic mineralogy and grain sizes of the
sediments. It is known that various substances are transported and cycled in
the sediment-water interface (e.g., Berner, 1980). It is inferred that
oxygen in overlying bottom water also is transported to the sediments.
TOC contents in the samples from stations 38, 44, 45, and 46 are 2.61-6.43
wt% (Table 1), and they are high for marine sediments. A large amount of
oxygen is consumed for organic matter decompositions, and the sedimentary
environment at the station is possibly in an anoxic condition. In general,
goethite and maghemite are not stable under such sedimentary environment and
dissolve. In spite of the high TOC, goethite and maghemite are present in
the studied samples. It is, therefore, possible that differences in the
magnetic mineral assemblages in this study area are related to oxic
conditions in bottom waters, although the differences may have also been
influenced by the supply of sedimentary materials (Table 1).
The highest negative correlation is recognized in the relationship between
DO and S-0.3 T (Tables 1 and 2). The composition of magnetic
minerals are known to reflect redox condition factors which are TOC and/or
DO contents in bottom and/or interstitial water (e.g., Berner 1980; Henshaw and Merill, 1980; Canfield and Berner, 1987; Hilton, 1987; Leslie et al., 1990a, b; Karlin, 1990; Roberts and Turner, 1993; Lui et al., 2004; Garming et al., 2005; Rey et al., 2005; Kawamura et al., 2008, 2012; Rowan et al., 2009; Liu et al., 2012). We suggest that the magnetic mineral assemblage can
also be influenced by DO content in bottom waters in this study area. It is
implied that the difference in the magnetic mineral assemblages corresponds
to the redox condition and reflect the oxidation degree in bottom water in
this study area.
6. Conclusions
In order to describe the magnetic mineral distribution in nearshore
sediments, rock magnetic analysis of nearshore sediments was performed at
five stations off Chile. DO and DI concentrations in bottom waters were also
measured at each station. The intensities of concentration-dependent rock
magnetic parameters ($\chi $, $\chi $ARM, SIRM, and HIRM) and magnetic grain size indicators correspond to lithological variations. Results of
thermo-magnetometory indicate that magnetite, hematite, (titano)maghemite,
and goethite are common in the samples. Maghemite is recognized in the
sample which has low S-0.3 T and highest TOC content at most oxic
station. Hcr/Hc and Mrs/Ms ratios of the stations plot mostly in the MD region on the Day plot. Higher TOC generally causes anoxic
conditions in sediments. However, our results imply that high coercivity
magnetic mineral like maghemite is kept under oxic conditions of bottom
water in this study area.
Acknowledgments
We are grateful to Dr. Naomi Harada at JAMSTEC for sample preparations. We
thank Dr. Toshiya Kanamatsu, Dr. Takashi Miyazaki, and an anonymous reviewer
for valuable comments that helped to improve our manuscript. Funding for
this research was partially provided to N.K. by the Nippon foundation. This
study was performed under the cooperative research program of Center for
Advanced Marine Core Research (CMCR), Kochi University (accept No. 15A007)
with the support of JAMSTEC.
References
-
Achterberg, E.
,
T. Holland
,
A. Bowie
,
R. Fauzi
,
C. Mantoura
,
P. J. Worsfold
(2001), Determination of iron in seawater, Anal. Chim. Acta, 442, 1-14.
-
Aston, S. R.
and
R. Chester
(1973), The influence of suspended particles on the precipitation of iron in natural waters, Estuarine. Coastal Mar. Sci., 1, 225-231.
-
Banerjee, S. K.
,
J. King
, and
J. Marvin
(1981), A rapid method for magnetic granulometry with applications to environmental studies, Geophys. Res. Lett., 8, 333-336, doi:10.1029/GL008i004p00333.
-
Berner, R. A.
(1980), Early Diagenesis: A Theoretical Approach, Princeton University Press, 241 pp.
-
Bloemendal, J.
,
J. W. King
,
F. R. Hall
, and
S.-J. Doh
(1992), Rock magnetism of late Neogene and Pleistocene deep-sea sediments: Relationship to sediment source, diagenetic processes, and sediment lithology, J. Geophys. Res., 97, 4361-4375.
-
Bocquet, S.
and
S.J. Kennedy
(1992), The Néel temperature of fine particle goethite, J. Magn. Magn. Mat. 109, 260-264.
-
Canfield, D. E.
and
R. A. Berner
(1987), Dissolution and pyritization of
magnetite in anoxic marine sediments, Geochim. Cosmochim. Acta,
51, 645-659.
-
Downes, S. M.
,
N. L. Bindoff
, and
S. R. Rintoul
(2009), Impacts of climate
change on the subduction of mode and intermediate water Masses in the
Southern Ocean, J. Climate, 22, 3289-3302.
-
Day, R.
,
M. Fuller
, and
V. A. Schmidt
(1977), Hysteresis properties of titanomagnetites: Grain-size and compositional dependence, Phys. Earth Planet. Inter., 13, 260-267,
doi:10.1016/0031-9201(77)90108-X.
-
Emerson, S
. and
J. I. Hedges
(1988), Processes controlling the organic
carbon content of open ocean sediments, Paleoceanography,
3, 621-634.
-
Evans, M. E.
and
F. Heller
(2003), Environmental Magnetism: Principles and
Applications of Enviromagnetics, Elsevier Science, 299 pp.
-
Garming, J. F. L.
,
U. Bleil
, and
N. Riedinger
(2005), Alteration of magnetic
mineralogy at the sulfate-methane transition: Analysis of sediments from
the Argentine continental slope, Phys. Earth Planet. Inter., 151, 290-308.
-
Harada, N.
(2008), R/V Mirai Cruise Report MR08-06 (Leg 2 and Leg 3) March 14-April 8, Japan Agency for Marine-Earth Science and Technology, 141 pp.
-
Harrison, R. J.
and
J. M. Feinberg
(2008), FORCinel: An improved algorithm
for calculating first-order reversal curve distributions using locally
weighted regression smoothing, Geochem. Geophys. Geosyst., 9, doi:10.1029/2008GC001987.
-
Heider, F.
,
C. Geiss
,
D. J. Dunlop
, and
H. Inokuchi
(1992), Rock-magnetic
investigation of basalts from the southern Kerguelen Plateau (Leg 120),
Proc. of ODP, Sci. Res., 120, 79-87.
-
Henshaw, P. C., Jr.
, and
R. T. Merrill
(1980), Magnetic and chemical changes
in marine sediments, Rev. Geophys., 18, 483-504.
-
Hilton, J.
(1987), A simple model for the interpretation of magnetic records in lacustrine and ocean sediments, Quat. Res., 27, 160-166.
-
Ishikawa, N.
and
G. M. Frost
(2002), Magnetic properties of sediments from
Ocean Drilling Program sites 1109, 1115, and 1118 (Leg 180), Woodlark Basin (Papua New Guinea), Earth Planets Space, 54, 883-897.
-
Karlin, R.
and
S. Levi
(1983), Diagenesis of magnetic minerals in recent
haemipelagic sediments, Nature, 303, 327-330.
-
Karlin, R.
and
S. Levi
(1985), Geochemical and sedimentological control of the magnetic properties of hemipelagic sediments, J. Geophys. Res., 90, 10373-10392.
-
Karlin, R.
(1990), Magnetite diagenesis in marine sediments from the Oregon continental margin, J. Geophys. Res., 95, 4405-4419.
-
Kawamura, N.
,
K. Kawamura
, and
N. Ishikawa
(2008), Rock magnetic and
geochemical analyses of surface sediment characteristics in deep ocean
environments: A case study across the Ryukyu Trench, Earth Planets Space, 60, 179-189.
-
Kawamura, N.
,
N. Ishikawa
, and
M. Torii
(2012), Diagenetic alteration of
magnetic minerals in Labrador Sea sediments (IODP Sites U1305, U1306, and
U1307), Geochem. Geophys. Geosyst., 13, Q08013, doi:10.1029/2012GC004213.
-
Laurent, S.
,
D. Forge
,
M. Port
,
A. Roch
,
C. Robic
,
L. V. Elst
, and
R. N. Muller
(2008), Magnetic iron oxide nanoparticles: synthesis, stabilization, vectorization, physicochemical characterizations, and biological
applications, Chem. Rev., 108, 2064-2110.
-
Leslie, B. W.
,
D. E. Hammond
,
W. M. Berelson
, and
S. P. Lund
(1990a), Diagenesis in anoxic sediments from the California continental borderland and its influence on iron, sulfur, and magnetic behavior, J. Geophys. Res., 95, 4453-4470.
-
Leslie, B. W.
,
S. P. Lund
, and
D. E. Hammond
(1990b), Rock magnetic evidence for the dissolution and authigenic growth of magnetic minerals within anoxic marine sediments of the California continental borderland, J. Geophys. Res., 95, 4437-4452.
-
Liu, J.
,
R. X. Zhu
,
A. P. Roberts
,
S. Q. Li
, and
J. H. Chang
(2004), High-resolution analysis of early diagenetic effects on magnetic minerals in post-middle-Holocene continental shelf sediments from the Korea Strait, J. Geophys. Res., 109, B03103, doi:10.1029/2003JB002813.
-
Liu, Q.
,
Y. Yu
,
J. Torrent
,
A. P. Roberts
,
Y. Pan
, and
R. Zhu
(2006), Characteristic low-temperature magnetic properties of aluminous goethite [α-(Fe,Al)OOH] explained, J. Geophys. Res., 111, B12S34.
-
Liu, Q.
,
A. P. Roberts
,
J. C. Larrasoaña
,
S. K. Banerjee
,
Y. Guyodo
,
L. Tauxe
, and
F. Oldfield
(2012), Environmental magnetism: Principles and
applications, Rev. Geophys., 50, RG4002, doi:10.1029/2012RG000393.
-
Lowrie, W.
(1990), Identification of ferromagnetic minerals in a rock by coercivity and unblocking temperature properties, Geophys. Res. Lett., 17, 159-162.
-
Maher, B. A.
(2011), The magnetic properties of Quaternary aeolian dusts and sediments, and their palaeoclimatic significance, Aeolian Res., 3, 87-144, doi:10.1016/j.aeolia.2011.01.005.
-
Oda, H
. and
M. Torii
(2004), Sea-level change and remagnetization of
continental shelf sediments off New Jersey (ODP Leg 174A): magnetite and greigite diagenesis, Geophys. J. Int., 156, 443-458.
-
Özdemir, Ö.
and
S. K. Banerjee
(1984), High temperature stability of maghemite (γ-Fe2O3), Geophys. Res. Lett., 11, 161-164, doi:10.1029/GL011i003p00161.
-
Özdemir, Ö.
and
D. J. Dunlop
(1996), Thermoremanence and Néel temperature of goethite, Geophys. Res. Lett., 23, 921-924.
-
Rey, D.
,
K. J. Mohamed
,
A. Bernabeu
,
B. Rubio
, and
F. Vilas
(2005), Early diagenesis of magnetic minerals in marine transitional environments: Geochemical signatures of hydrodynamic forcing, Mar. Geol., 215, 215-236.
-
Roberts, A. P.
and
G. M. Turner
(1993), Diagenetic formation of
ferrimagnetic iron sulphide minerals in rapidly deposited marine sediments,
South Island, New Zealand, Earth Planet. Sci. Lett., 115, 257-273.
-
Roberts, A. P.
,
L. Chang
,
C. J. Rowan
,
C.-S. Horng
, and
F. Florindo
(2011), Magnetic properties of sedimentary greigite (Fe3S4): An update, Rev. Geophys., 49, RG1002, doi:10.1029/2010RG000336.
-
Rowan, C. J.
,
A. P. Roberts
, and
T. Broadbent
(2009), Reductive diagenesis,
magnetite dissolution, greigite growth and paleomagnetic smoothing in marine
sediments: A new view, Earth Planet. Sci. Lett., 277, 223-235.
-
Thompson, R.
and
F. Oldfield
(1986), Environmental Magnetism, Allen & Unwin (Publishers) Ltd., 227 pp.
-
Verwey, E. J. W.
(1939), Electronic conduction of magnetite
(Fe3O4) and its transition point at low temperatures,
Nature, 144, 327-328, doi:10.1038/144327b0.
-
Walden, J.
,
F. Oldfield
, and
J. Smith
(eds.)
(1999), Environmental
magnetism: A practical guide, Quaternary Research Association, 243 pp.
-
Warren, A.
and
C. Wunsch
(eds.)
(1981), Evolution of physical oceanography:
Scientific surveys in honor of Henry Stommel, MIT Press, 623 pp.
-
Zhang, W.G.
,
Y. Xing
,
L.Z. Yu
,
H. Feng
, and
M. Lu
(2008), Distinguishing
sediments from the Yangtze and Yellow Rivers, China: A mineral magnetic
approach, Holocene, 18, 1139-1145.