Abstract
An analytical method for determining the stable isotope ratios of Ba was
developed by using thermal ionization mass spectrometry (TIMS) and the
130Ba–135Ba double-spike total evaporation method (DS-TEV). We
determined the isotope ratios of the 130Ba–135Ba double spike to
be 134Ba/130Ba = 0.076623, 135Ba/130Ba = 1.081975,
and 137Ba/130Ba = 0.209356 by using the intercept values of the
mass-dependent fractionation lines and mixing line.
The measured repeatability of δ137/134Ba of the National
Institute of Standards and Technology (NIST) Standard Reference
Material (SRM) 3104a was ±0.018‰ (2SD: 2 standard
deviations, n = 7) based on the double-spike total evaporation method
using thermal ionization mass spectrometry (DS-TEV-TIMS). The repeatability
is comparable to or better than the best repeatability of Ba isotope ratios
ever reported.
1. Introduction
Ba has seven stable isotopes: 130Ba (0.106% isotope abundance),
132Ba (0.101%), 134Ba (2.417%), 135Ba (6.592%),
136Ba (7.854%), 137Ba (11.232%), and 138Ba (71.698%;
de Laeter et al., 2003). Owing to their usefulness as nontraditional stable
isotopes with heavy atomic mass, stable isotope ratios of Ba continue to
receive attention in various research fields of earth science. The high
sensitivity of stable Ba isotope ratios from various geochemical processes
such as diffusion, adsorption, dissolution, and precipitation at low
temperature has been advantageous in marine geochemical research focusing on
the oceanic Ba cycle (Lu et al., 2017, and references therein). The
breakthrough study of von Allmen et al. (2010) has dramatically improved the
analytical precision of Ba isotope ratios since 2010 (Lu et al., 2017, and
references therein). However, a lack of accepted reference materials has
created limitations in the analysis of stable Ba isotopes (van Zuilen et al., 2016; Lu et al., 2017), which has led to difficulties in using absolute
isotope ratios and interlaboratory data comparisons based on relative
isotope ratios such as the $\delta$-notation. Von Allmen et al. (2010) and
Miyazaki et al. (2014) suggested the use of BaCO3 issued by
International Atomic Energy Agency (IAEA-CO-9) as international reference
material. However, this standard is no longer available. Instead, a Ba
standard solution issued by the National Institute of Standard and
Technology (NIST), SRM 3104a, has recently been proposed as an alternative
reference material (van Zuilen et al., 2016). Therefore, precise
determination of the Ba isotope ratios of NIST SRM 3104a is required.
Thermal ionization mass spectrometry (TIMS) is a standard technique used for
high-precision analysis of stable Ba isotopes, although many laboratories
use multiple-collector-inductively coupled plasma-mass spectrometry
(MC-ICP-MS). To maximize the advantage of TIMS, the accurate correction of
mass-dependent mass fractionation (MDF) occurring in the mass spectrometer
is required because internal mass fractionation correction using a canonical
stable isotope ratio, which is used in the studies on mass-independent mass
fractionation (MIF) especially for the isotope analysis of radiogenic
origin, is not applicable for stable isotope analysis.
The double-spike (DS) method is widely used for correction of MDF in Ba
isotope analyses (e.g., von Allmen et al., 2010; Miyazaki et al., 2014; van Zuilen et al., 2016). To accomplish high-precision DS-TIMS, sample
evaporation from the ion source filament should follow the MDF law, which
usually is an exponential law. However, unusual mass fractionation occurs
during sample evaporation, most likely owing to isotopically heterogeneous
sample domains on the filament (Upadhyay et al., 2008; Andreasen and Sharma, 2009). The total evaporation method (TEV) is useful for overcoming this
problem. The influence of unusual mass fractionation can be minimized by the
TEV technique, where a sample on the filament completely evaporates and all
emitted ion beams are acquired by the collectors (e.g., Suzuki et al., 2004;
Fukami et al., 2017, and references therein). During the actual TEV-TIMS
analysis, the signal acquisition of a sample is incomplete because of the
background noise for which an acquisition threshold is set. In practice,
tiny amounts of sample evaporation before and after TEV signal acquisition
are not measured owing to the threshold, which results in small error in
determination of the isotope ratios. Therefore, additional examination and
refinement of MDF are necessary.
In this study, we thoroughly examine and report the DS method in combination
with the TEV method (DS-TEV) for analysis of stable Ba isotope ratios. Ba
isotope ratios of the NIST SRM 3104a standard using the DS-TEV-TIMS
technique are also reported.
2. Experimental
2.1 Reagents, spike, and isotope standard materials
TAMAPURE®-AA grade ultrapure water and TAMAPURE®-AA-10 grade (<10 ppt impurities) 68% HNO3 (Tama Chemical Co.,
Ltd., Kawasaki, Japan) were used without additional purification. The
TAMAPURE®-AA grade ultra-pure water was used only to dilute
the double-spike standard. Deionized water was purified via a two-bottle
Teflon® still from Milli-Q® water
(Millipore® Molsheim, France). The 130Ba-enriched spike
(Batch No.230901, enrichment 35.84% ± 0.007%, carbonate) and
135Ba-enriched spike (Batch No.142890, enrichment 93.38% ± 0.02%, carbonate) were obtained from Oak Ridge National Laboratory
(ORNL), USA. The 130Ba- and 135Ba-enriched spikes were separately
dissolved in 0.5 M HNO3. Subsequently, the 130Ba and 135Ba
spike solutions were mixed and diluted to approximately 1 mg/L. The Ba
reference material (SRM3104a, Ba standard solution (6.994 ± 0.0017 mg/g in 1% nitric acid), Lot No.140909) from NIST was diluted to 0.01 mg/g using 1% HNO3.
2.2 Mass spectrometry and data reduction
The Ba isotope ratios were determined by using a Thermo Finnigan TRITON
TI® thermal ionization mass spectrometer equipped with nine
Faraday cup collectors at the Department of Solid Earth Geochemistry (DSEG),
Japan Agency for Marine-Earth Science and Technology (JAMSTEC). An
accelerating voltage of 10 kV was used for the Ba isotope analysis. The
Faraday collectors were set to simultaneously detect the following isotopes:
130Ba (Low 3), 132Ba (Low 2), 134Ba (Low 1), 135Ba
(Center), 136Ba (High 1), 137Ba (High 2), 139La (High 3), and
140Ce (High 4). All Faraday collectors were connected to the amplifiers
by using a 1011$\Omega$ resistor. The stability of this acquisition
system was tested by Miyazaki et al. (2009). The relative efficiencies of
the Faraday collectors known, as the cups factors of this TIMS (Miyazaki et
al., 2016), were not used in this study because their effect was negligible
during the analytical period. Additional cup factor correction should be
necessary when the cups are deteriorated (e.g., Miyazaki et al., 2016).
A double Re filament was used as the ion source. Prior to sample loading,
both the evaporation and ionization filaments were degassed in a vacuum for
45 min at 4.6 A. Approximately 100 ng Ba was dissolved in 2 $\mu$L of 2%
HNO3, and the solution was loaded onto the center of the Re evaporation
filament for the standard, double-spike, and mixed samples. A current of 0.6 A was continuously applied during the loading until the solution evaporated.
Using the TRITON TI®, we combined the method files in a
sequence file to measure several samples in one sequential run, and we
modified the measurement file protocols for Pb isotopes described by
Miyazaki et al. (2009). Table1 shows the four method files
included in one sequence file: (1) gain calibration, (2) baseline
measurement, (3) filament heating and sample measurement, and (4) blank
measurement for baseline drift correction. According to this method, the
gain calibration and baseline measurements were conducted prior to heating
the filaments. The baseline was measured for 15 min. To monitor the baseline
drift during data acquisition, one blank sample measurement was performed at
the end of the analytical sequence by measuring the signal intensity of each
Faraday collector without heating the ion source filaments. The raw
intensity data were used for necessary offline corrections (Miyazaki et al.,
2009).
Table 1.
Combination of the method files for fully automated
DS-TEV-TIMS measurement for one sample on the filament, modified from
Miyazaki et al. (2009).
| Method File | Operation | Acquired data | Time |
|---|
| 1 | Gain calibration | Gain data (stored in operating computer) | $\approx$ 15min |
| 2 | Baseline measurement | Baseline data (stored in operating computer) | $\approx$ 15min |
| 3-1 | Filament heating (Until pilot beam reach 10 mV), Focusing, and peak centering | | $\approx$ 15min |
| 3-2 | Sample measurement by TEV | Raw intensity data of sample (used for off-line calculation) | Max 35 min |
| 4 | Blank measurement for baseline drift correction | Raw intensity data without ion beam (used for off-line calculation) | $\approx$ 15min |
The ionization and evaporation filaments were automatically heated by the
filament heating program in the sample measurement method file (Method file
3-1 in Table1). Using this program, the ionization filament was
first heated to 2.8 A at a rate of 0.56 A/min. Then, the evaporation
filament was heated to 0.5 A at a rate of 0.1 A/min. After the ionization
and evaporation filaments reached 2.8 A and 0.5 A, the current of the
evaporation filament was increased at a rate of 0.05 A/min until the beam
intensity of the pilot mass reached 5 mV. The highest abundance isotope peak
was chosen for the pilot monitor mass to avoid excess heating during lens
tuning. We avoided 138Ba owing to its extremely high abundance.
Instead, 137Ba was used for unspiked runs and 135Ba was used for
spiked and mixture runs because 135Ba had the highest abundance in the
latter samples. The ion lenses were then optimized to focus 1 min later. The
electric current of the evaporation filament was increased again at a rate
of 0.05 A/min until the beam intensity of the pilot mass reached 10 mV. Peak
centering was performed 1 min later, and the data acquisition was started.
During data acquisition, the electric current of the evaporation filament
was increased at ~5 mA/cycle unless the pilot beam intensity
exceeded 4200 mV. The integration time was 1.05 s/cycle. The data
acquisition was terminated when the pilot beam intensity decayed below 5 mV,
which was set as the noise threshold. The raw beam intensity data of all
cycles were summed for each isotope; these summed intensities were used to
calculate the isotope ratios.
In this study, we assumed that the MDF followed an exponential law. The
three-dimensional data reduction procedure of Siebert et al. (2001) was
applied. The 134Ba/130Ba, 135Ba/130Ba, and
137Ba/130Ba ratios determined by using the summed intensity data
were used for regression calculations in an Excel spreadsheet to obtain the
corrected 134Ba/130Ba, 135Ba/130Ba, and
137Ba/130Ba ratios by the DS method. For the regression
calculations, the measured isotope ratios of the unspiked sample (standard
in this study) and the DS-spiked sample were used. The 137Ba/134Ba
ratio was calculated to determine the $\delta$137/134Ba value based on
the following equation: $\delta$137/134Ba = [(137Ba/134Basample)/(137Ba/134Bastandard)-1] × 1000. The strong 138Ba signal (71.7% isotopic abundance)
was not measured in this study to avoid any damage of the designated Faraday
cup, although $\delta$138/134Ba has been used in many studies. The
$\delta$138/134Ba value can be calculated from the $\delta$137/134Ba value when MIF is not present in the analyzed samples.
The tailing of the strongest 138Ba signal (no Faraday cup assignment)
was not detected by the neighboring higher mass side Faraday cup (High 3:
139La). The mass peaks show totally symmetry shape by the TIMS, tailing
from 138Ba on the low mass side Faraday (High 2: 137Ba) should
also be negligible.
3. DS calibration
3.1 DS calibration methods in previous studies
For high-precision DS isotope analysis with minimized propagated errors,
optimized conditions such as the choice of isotopes and mixing ratio of two
spikes were simulated by the model proposed by Rudge et al. (2009). We
applied 130Ba and 135Ba as the DS spikes and prepared a
130Ba–135Ba DS solution based on the simulation. The isotope
ratios used for the 130Ba–135Ba DS were calculated from the
weight and atomic abundance data supplied by the ORNL, where
134Ba/130Ba = 0.076432, 135Ba/130Ba = 1.040925, and
137Ba/130Ba = 0.208963 (Table2). Notably, small but
inevitable errors that occur during weighing and diluting as well as
additional errors are inherited from ORNL reference atomic abundance values,
all of which affect the isotope ratios of the 130Ba–135Ba DS
solution. Therefore, calibration is required to determine accurate isotope
ratios of the DS solution. In the case of stable Ba isotopes, such
calibration is difficult owing to the lack of a standard material with
well-characterized isotope ratios (Miyazaki et al., 2014).

Several calibration methods can be used to overcome the aforementioned
problem. For example, von Allmen et al. (2010) and van Zuilen et al. (2016)
calibrated their 130Ba–135Ba DS solution by applying the
fractionation factor of the 142Nd/144Nd ratio of an Nd standard to
their analytical protocols using MC-ICP-MS. This external mass fractionation
calibration is not applicable to TIMS because the evaporation and ionization
conditions for Ba and Nd differ such that emission of stable ion beams under
a given filament temperature is difficult. Even with MC-ICP-MS, the mass
bias determined by using the 142Nd/144Nd ratio is different from
that based on the 137Ba/135Ba ratio because of the space charge
effect at the ion sampling interface (Hirata, 1996) or non-mass-dependent
fractionation of Nd isotopes (Newman, 2012), as pointed out by Miyazaki et
al. (2014).
Therefore, Miyazaki et al. (2014) developed a new DS calibration method that
does not depend on the use of standard material with well-known isotope
ratios. They revealed that a precise Ba isotope ratio measurement can be
achieved only by using the correct DS isotope ratios when unknown samples
with different spike/sample ratios are measured with the standard bracketing
method and MC-ICP-MS. They conducted several measurements using IAEA-CO-9
with different spike/sample ratios (0.11–0.33) as the samples and IAEA-CO-9
with a fixed spike/standard ratio (0.175) as the bracketing standard, and
they iteratively determined the correct 130Ba–135Ba DS isotope
ratios to achieve an invariant value for all measured $\delta$137/134Ba values. The initial assumption of their calibration method
is that the true DS isotope ratio plots on the mixing line of the two
spikes.
Van Zuilen et al. (2016) also reported a DS calibration method using TIMS in
which they calibrated 132Ba–136Ba DS, also without using material
with known isotope ratios. In contrast to the mixing line method by Miyazaki et al. (2014), they measured the pure DS solution and artificially altered
the DS Ba isotope ratios along the MDF line using an exponential law to
determine the average values of $\delta$137/134Ba and $\delta$138/134Ba of the target NIST SRM 3104a becoming 0‰.
In this study, we adopted both the mixing line method of Miyazaki et al.
(2014) and the MDF line method of van Zuilen et al. (2016), and we used
TEV-TIMS to calibrate the 130Ba–135Ba DS solution.
3.2 DS calibration methods by TEV-TIMS
The isotope ratio measurements in TEV-TIMS is almost free from the influence
of MDF owing to the acquisition of all ions emitted from the sample on the
filament (e.g., Suzuki et al., 2004; Fukami et al., 2017). Therefore,
TEV-TIMS is suitable for precise determination of isotope ratios of any DS
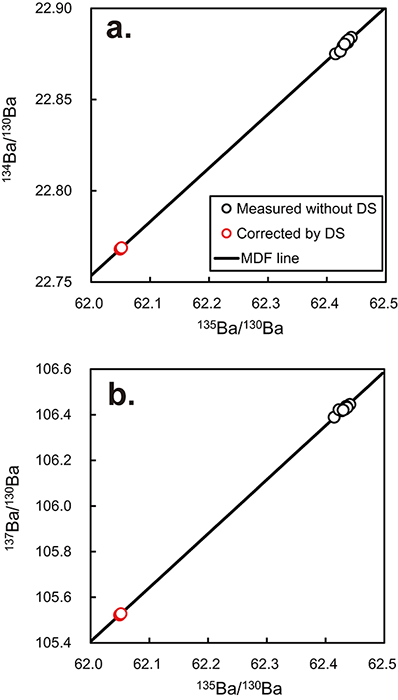
solution. However, the actual measurements of the 130Ba–135Ba DS
solution by TEV-TIMS showed MDF (Table2, Fig.1), whereas
significant MIF was not observed. As shown in Fig.1, all data
points were on the MDF line. The origin of MDF is unknown and may be
attributed to MDF occurrence during sample loading or filament heating.
Alternatively, it may have been caused by the effect of the noise threshold
cutoff or the collision of ions with remnant gases in the flight tube.
Regardless of its source, however, additional MDF correction is necessary.

If the measured isotope ratios of the DS solution are affected by MDF alone,
the MDF line calculated from the datapoints should cross the mixing line
between the two spikes, and the coordinates of the intercept should show the
correct isotope ratios of the DS solution (Fig.1). However, the
calculated MDF did not cross at the exact coordinates in three
two-dimensional isotope spaces (Fig.1). This result occurred
because of the correlation errors in MDF regression lines and the mixing
line owing to a common denominator with three numerator isotopes such as
137Ba/130Ba–135Ba/130Ba,
134Ba/130Ba–135Ba/130Ba, or
137Ba/130Ba–134Ba/130Ba (Fig.1). Instead of
determining each intercept coordinates by linear regressions using all data,
we iteratively determined the best fit solutions for each measured isotope
MDF data. We applied an Excel spreadsheet and calculated 12 intercept values
for 134Ba/130Ba, 135Ba/130Ba, and 137Ba/130Ba,
which were averaged to obtain the isotope ratios of the spike solution.
Using this method, we calibrated the 130Ba–135Ba DS solution. The
calibrated isotope ratios were 134Ba/130Ba = 0.076623 ± 0.000002, 135Ba/130Ba = 1.081975 ± 0.000102, and
137Ba/130Ba = 0.209356 ± 0.000001 (2SD: two-standard
deviation, n = 12) (Table2, Fig.1).
The errors of the atomic abundances provided by the ORNL for the two spikes
were not considered. We used a fixed line as mixing line; therefore, it was
necessary to estimate the degree to which the calibrated isotope ratios were
influenced by the initial errors of the atomic abundances listed in
Table2. We simply estimated the effects of the errors by applying
the maximum and minimum atomic abundances of the error ranges. The maximum
effect is shown by 135Ba/130Ba = 1.081233–1.082718,
corresponding to an error of ± 686 ppm. According to the simulation by
Miyazaki et al. (2014), the atomic abundance error of ± 686 ppm
(135Ba/130Ba ratio of spike) affects the $\delta$137/134Ba
values within ±0.01‰ for measurements using a
spike/sample ratio of 0.03–0.28 in sample run if the spike/standard ratio
of the bracketing mixture is fixed to 0.178. The resultant error is smaller
than the achievable repeatability and laboratory biases of ~
0.02‰ for stable Ba isotope analyses (Miyazaki et al.,
2014). Therefore, we ignored the atomic abundance errors of the two ORNL
spikes in this study.
4. Stable Ba isotope analysis of NIST SRM 3104a
To evaluate the TEV-DS-TIMS method for determining the stable Ba isotope
ratios, we analyzed NIST standard SRM 3104a. The typical profiles of the
135Ba beam signal intensity and the electric current of the evaporation
filament are shown in Fig.2a. The beam intensity increased rapidly
and was maintained at the preset intensity of 4200 mV. The increment of the
filament current was automatically adjusted to maintain the preset beam
intensity. Subsequently, the intensity rapidly decreased and rose again,
leading to two peaks showing aftergrowth. The beam intensity finally
returned to zero, indicating full consumption of the loaded sample.
Aftergrowth was observed in almost all measurements conducted in this study.
The first drop in beam intensity prior to aftergrowth commonly occurred when
the electric current of the evaporation filament was 1.0–1.5 A. Although
the cause of this reproducible profile is unclear, it might not relate to
differences in chemical form, such as the nitric or hydrochloric form,
because all Ba standard and spike solutions were diluted by nitric acid
only. For further evaluation, the signal profile was divided into four
segments of A, B, C, and D (Fig.2) at 0.155 V intensity. It should
be noted that this value corresponds with the lowest intensity between the
first drop and the aftergrowth (Fig.2).
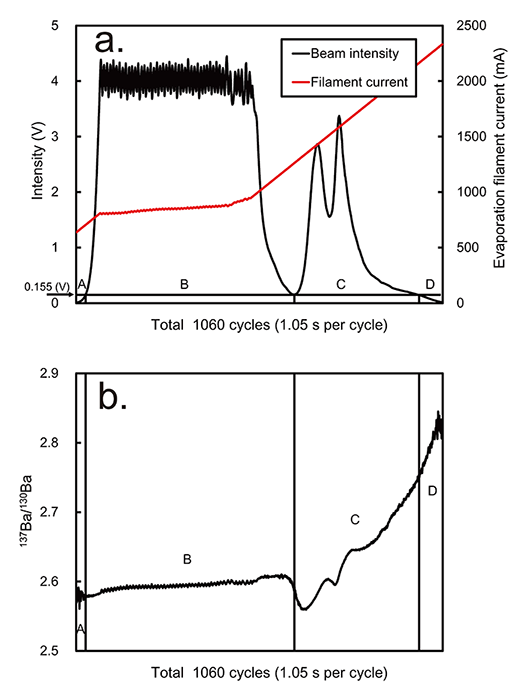
Fig.3 shows the plots of the 137Ba/130Ba and
135Ba/130Ba ratios from all 1060 cycles of 1.05 s acquisition in
one measurement; Fig.2 shows the same sample. Although the data
from the first A (lighter isotope ratio) and last D (heavier isotope ratio)
segments were scattered because of the low beam intensity, all of the other
data including the B and C segments were plotted along the MDF line.
Therefore, the scatter data in the A and D segments can be omitted by
applying the threshold. It is obvious that all Ba ions emitted from the
evaporation filament were derived from the same sample throughout the run.
The effect of Ba impurity emitted from the degassed Re filaments was
negligible because only 12000 cps of 138Ba, an equivalent of <0.2 mV in
the Faraday collector, was detected at filament currents of 4.2 A for
ionization and ~2.5 A for evaporation.
The range of fractionation observed in segment C was wide and overlapped the
range of the B segment. Lower isotope ratios relative to those in segment B
were found in segment C, showing so-called reverse fractionation
(Fig.2b, Fig.3) caused by ion mixing fed from strongly
fractionated and weakly fractionated reservoirs on the same filament
(Upadhyay et al., 2008; Andreasen and Sharma, 2009). Essentially, the data from
the reverse fractionation region might not be shown on the MDF line but
could appear on the mixing line between the two less- and more-fractionated
reservoirs, although the data from the reverse fractionation region looks on
the same MDF line (Fig.3). Applying the total evaporation method
can eliminate the non-MDF effect from the reverse fractionation if
persistent.

Table3 and Fig.4 show the results of the measurements of
the NIST SRM 3104a standard solution by TEV-TIMS with and without DS
correction. Following simulations by Rudge et al. (2009) and Miyazaki et al.
(2014), a spike/standard ratio of 0.175 was applied to prepare the mixed
solution to minimize errors. The average isotope ratios of the unspiked runs
(134Ba/130Ba = 22.8802, 135Ba/130Ba = 62.4301, and
137Ba/130Ba = 106.4235) were used as the sample ratios of an
unspiked run to calculate the corrected isotope ratios of each spiked run.
If the Ba isotope ratios of sample are affected only by MDF, correction is
possible by using a spiked run only (mixture run only). In this case, an
optimal MDF factor should have been determined. We used Ba isotope ratios
determined by an unspiked NIST SRM 3104a to obtain the optimal MDF factor.
As expected, the isotope ratios from DS correction showed lower isotope
ratios (Fig.4) with smaller deviation than those from measurements
without DS correction. If we calculate the errors of the $\delta$-notation
using the average 137Ba/134Ba ratios from DS correction as
reference values, the deviations of the $\delta$137/134Ba values are
±0.018‰ (2SD, n = 7) for DS-corrected and
±0.165‰ (2SD, n = 8) for uncorrected results,
where 2SD contains error ranges of ±0.001‰ and
±0.012‰, respectively, owing to the small value
of n. Clearly, the repeatability of $\delta$137/134Ba is far
better using DS correction and is comparable to or even better than that of
the best values reported in previous studies. For example, Miyazaki et al.
(2014) reported ±0.032‰ (2SD, n = 42) for
$\delta$137/134Ba of the Fluka (Aldrich) standard solution, and
Nan et al. (2015) reported ±0.047‰ (2SD, n = 36) for $\delta$137/134Ba of the NIST SRM 3104a standard
solution.
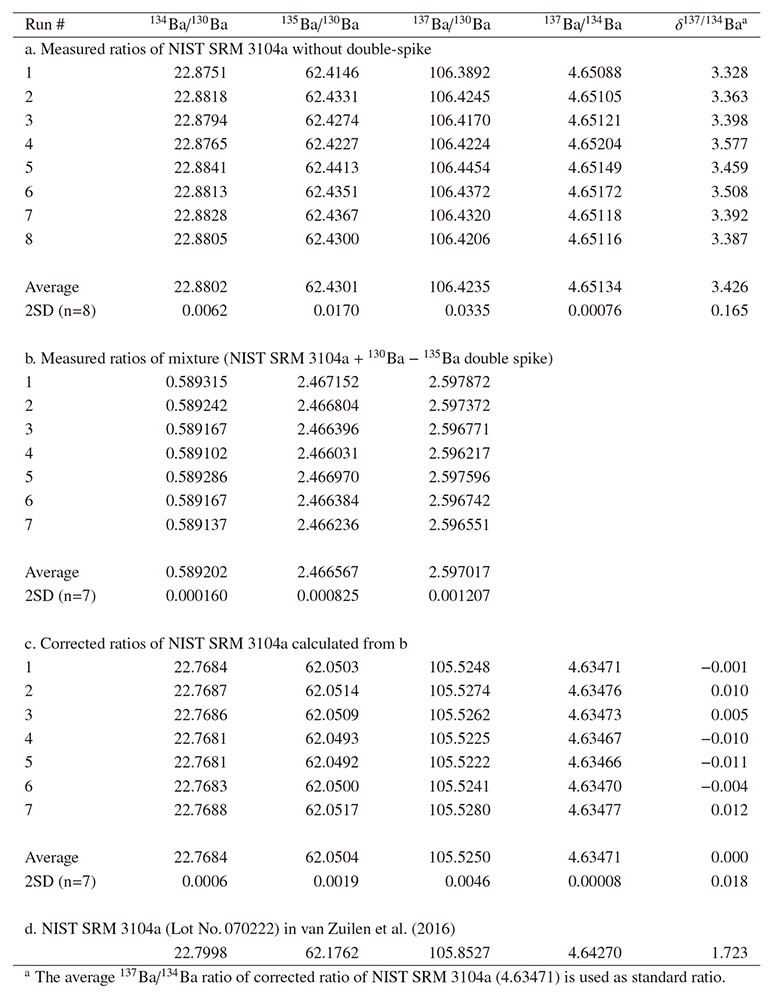
The isotope ratios for NIST SRM 3104a (Lot No.070222) are only available
from van Zuilen et al. (2016) (Table3). Their isotope ratios
differ from ours beyond the variation observed in natural samples (e.g.,
seawater; Cao et al., 2016). A comparison based on our NIST SRM 3104a ratio
as reference revealed that their $\delta$137/134Ba value is
1.723‰ . Such large variation was observed only in the
experimental study by van Zuilen et al. (2016), who reported a maximum
difference of 2.15‰ for $\delta$137/134Ba
owing to diffusion. This clearly indicates the importance of an
international, isotopically homogeneous Ba reference material for the
$\delta$-notation. The NIST SRM 3104a standard has been proposed as $\delta$-zero reference material for stable Ba isotope analysis (van Zuilen et al.,
2016). However, the same NIST SRM 3104a standard (Lot No.140909) used in
this study was newly released in February 2016. Its certified Ba
concentration differs from that of the previous lot, with 10.014 ± 0.036mg/g for Lot No.070222 (van Zuilen et al., 2016) versus 6.994 ± 0.0017 mg/g for Lot No.140909 used in this study. At this stage, it is not
clear that the different $\delta$137/134Ba values reported from
van Zuilen et al. (2016) were caused by different analytical method because
the standard from a different production lot could have different Ba isotope
composition. In fact, NIST SRM 3104a is not the standard for Ba isotope
ratios but for Ba concentration, as van Zuilen et al. (2016) suggested the
necessity of tests for different lots of NIST SRM 3104a.
5. Conclusion
We developed a precise analytical method for determining stable Ba isotope
ratios using DS-TEV-TIMS. In this method, the DS was used for MDF correction
in the TIMS instrument. The DS solution created from ORNL spikes was
calibrated without using a Ba standard by instead determining the
relationship between the MDF lines of the DS solution and the mixing lines
between the two Ba spikes. The repeatability of the $\delta$137/134Ba
ratios based on repeated analyses of a standard solution was approximately
twice that reported in previous studies.
Acknowledgments
The authors thank W. Zhang, H. Higuchi, and M. Kanazawa of JAMSTEC for their
support with the laboratory work and Q. Chang for useful discussion. In
addition, the authors thank two anonymous reviewers for their constructive
comments and H. Kumagai for his constructive comments and editorial
handling. T.M. was funded by a JSPS KAKENHI grant JP15K05357.
References
-
Andreasen, R.
and
M. Sharma
(2009), Fractionation and mixing in a thermal
ionization mass spectrometer source: Implications and limitations for
high-precision Nd isotope analyses, Int. J. Mass Spectrom.,
285, 49-57, doi:10.1016/j.ijms.2009.04.004.
-
Cao, Z.
,
C. Siebert
,
E.C. Hathorne
,
M. Dai
, and
M. Frank
(2016),
Constraining the oceanic barium cycle with stable barium isotopes,
Earth Planet. Sci. Lett., 434, 1-9,
doi:/10.1016/j.epsl.2015.11.017.
-
de Laeter, J.R.
,
J.K. Bohlke
,
P. De Bievre
,
H. Hidaka
,
H.S. Peiser
,
K.J.R. Rosman
, and
P.D.P. Taylor
(2003), Atomic weights of the elements.
Review 2000 (IUPAC Technical Report), Pure Appl. Chem.,
75, 683-800, doi: 10.1351/pac200375060683.
-
Fukami, Y.
,
M. Tobita
,
T. Yokoyama
,
T. Usui
, and
R. Moriwaki
(2017), Precise
isotope analysis of sub-nanogram lead by total evaporation thermal
ionization mass spectrometry (TE-TIMS) coupled with a 204Pb-207Pb
double spike method, J. Anal. At. Spectrom., 32, 848-857,
doi:10.1039/C6JA00455E.
-
Hirata, T.
(1996), Lead isotope analyses of NIST Standard Reference
Materials using multiple collector inductively coupled plasma mass
spectrometry coupled with a modified external correction method for mass
discrimination effect, Analyst, 121, 1407-1411,
doi:10.1039/AN9962101407.
-
Lu, D.
,
T. Zhang
,
X. Yang
,
P. Su
,
Q. Liu
, and
G. Jiang
(2017), Recent
advances in the analysis of non-traditional stable isotopes by
multi-collector inductively coupled plasma mass spectrometry, J. Anal. At. Spectrom., 32, 1848-1861, doi:10.1039/C7JA00260B.
-
Miyazaki, T.
,
N. Kanazawa
,
T. Takahashi
,
Y. Hirahara
,
B.S. Vaglarov
,
Q. Chang
,
J.-I. Kimura
, and
Y. Tatsumi
(2009), Precise Pb isotope analysis of
igneous rocks using fully-automated double spike thermal ionization mass
spectrometry (FA -DS- TIMS), JAMSTEC Rep. Res. Dev., Special Issue,
73-80, doi:10.5918/jamstecr.2009.73
-
Miyazaki, T.
,
J.-I. Kimura
, and
Q. Chang
(2014), Analysis of stable isotope
ratios of Ba by double-spike standard-sample bracketing using
multiple-collector inductively coupled plasma mass spectrometry, J. Anal. At. Spectrom., 29, 483-490, doi:10.1039/c3ja50311a.
-
Miyazaki, T.
,
B.S. Vaglarov
, and
J.-I. Kimura
(2016), Determination of
relative Faraday cup efficiency factor using exponential law mass
fractionation model for multiple collector thermal ionization mass
spectrometry, Geochem. J., 50, 445-447,
doi:10.2343/geochemj.2.0439.
-
Nan, X.
,
F. Wu
,
Z. Zhang
,
Z. Hou
,
F. Huang
, and
H. Yu
(2015), High-precision
barium isotope measurements by MC-ICP-MS, J. Anal. At. Spectrom.,
30, 2307-2315, doi:10.1039/C5JA00166H.
-
Newman, K.
(2012), Effects of the sampling interface in MC-ICP-MS: Relative
elemental sensitivities and non-linear mass dependent fractionation of Nd
isotopes, J. Anal. At. Spectrom., 27, 63-70,
doi:10.1039/C1JA10222B.
-
Rudge, J.F.
,
B.C. Reynolds
, and
B. Bourdon
(2009), The double spike toolbox,
Chem. Geol., 265, 420-431,
doi:10.1016/j.chemgeo.2009.05.010.
-
Siebert, C.
,
T.F. Nagler
, and
J.D. Kramers
(2001), Determination of
molybdenum isotope fractionation by double-spike multicollector inductively
coupled plasma mass spectrometry, Geochem., Geophys., Geosyst.,
2, 2000GC00124, doi:10.1029/2000GC000124.
-
Suzuki, K.
,
Y. Miyata
, and
N. Kanazawa
(2004), Precise Re isotope ratio
measurements by negative thermal ionization mass spectrometry (NTI-MS) using
total evaporation technique, Int. J. Mass Spectrom., 235,
97-101, doi:10.1016/j.ijms.2004.04.006.
-
Upadhyay, D.
,
E.E. Scherer
, and
K. Mezger
(2008), Fractionation and mixing
of Nd isotopes during thermal ionization mass spectrometry: implications for
high precision 142Nd/144Nd analyses, J. Anal. At. Spectrom., 23, 561-568, doi:10.1039/B715585A.
-
van Zuilen, K.
,
T.F. Nägler
, and
T.D. Bullen
(2016), Barium Isotope
Compositions of Geological Reference Materials, Geostand. Geoanal. Res., 40, 543-558, doi:10.1111/ggr.12122.
-
von Allmen, K.
,
M.E. Böttcher
,
E. Samankassou
, and
T.F. Nägler
(2010), Barium isotope fractionation in the global barium cycle: First
evidence from barium minerals and precipitation experiments, Chem. Geol., 277, 70-77, doi:10.1016/j.chemgeo.2010.07.011.