Abstract
To determine whether the short-term assessment of pulse rate variability (PRV) is a surrogate for that of heart rate variability (HRV) in an elderly population under resting conditions, we collected photoplethysmography (PPG) and electrocardiography (ECG) signals simultaneously, and analyzed their association and agreement with HRV and PRV components. We divided the elderly population into three groups, namely, those younger than 70 years (< 70 yrs), those older than 70 years and younger than 80 years (70–79 yrs), and those older than 80 years (≥ 80 yrs), and we found that PRV was more underestimated than HRV with increasing age, although the PRV components highly correlated with the HRV components in the three groups. Thus, PRV can be used to examine the autonomic nervous system (ANS) function in elderly populations. However, the interpretation of results should consider the effect of aging, particularly in those older than 80 years.
Introduction
The determination of heart rate variability (HRV) derived from electrocardiography (ECG) signals has been used as a noninvasive technique to examine the autonomic nervous system (ANS) function.1),2) In addition, pulse rate variability (PRV) is also used as an alternative modality for HRV, particularly in situations wherein ECG is not available or cannot be performed owing to electrical artifacts.3) The components of this variability highly correlate with HRV components in a young or adult population,4),5) whereas previous studies showed that PRV is not a surrogate for HRV in standing healthy subjects and in patients with low HRV.6),7). Recently, the link between aging and ANS function in rats, mice, and humans has been reported,8)–12) and thus we examined whether the frequency domain components of PRV derived from photoplethysmography (PPG) signals are surrogates for HRV derived from ECG signals in elderly populations under resting conditions.
Materials and Methods
In this study, 73 outpatients [23 male and 50 female subjects; 78.7 years old ± 8.4 standard deviation (SD)] receiving medical care at Hyogo Prefectural Rehabilitation Center at Nishi-harima in Japan were included. This study was approved by the ethics committee of the institution.
The examinations were performed in the supine position during spontaneous breathing. Lead II ECG signals and PPG signals were collected simultaneously for 150 s with one electrode on the right wrist (negative) and two on the left leg (positive and ground) for ECG, and the PPG sensor on the fingertip of the left hand for PPG. The frequency domains of HRV derived from ECG were analyzed by the maximum entropy method (MEM) (Reflex Meijin, CROSSWELL, Yokohama, Japan). Acceleration plethysmogram (APG) was obtained from the second derivative of a PPG signal, and the frequency domains of PRV, based on APG, were analyzed by the fast Fourier transform (FFT) method (Pulse Analyzer Plus TAS9, YKC Corporation, Tokyo, Japan). The sampling frequency for all recordings was 1,000 Hz. The low-frequency (LF) power (0.04–0.15 Hz), high-frequency (HF) power (0.15–0.4 Hz), and the ratio of LF to HF (L/H ratio) were calculated in accordance with standards for the spectral analysis of HRV.2) The association between HRV and PRV components was evaluated using Pearson’s correlation coefficient, Spearman’s rank correlation coefficient, and the Bland–Altman plot,13) as appropriate. The difference between the slopes of regression curves among the groups was evaluated by regression analysis, and statistical significance (p value) was corrected by the Bonferroni method.
Results
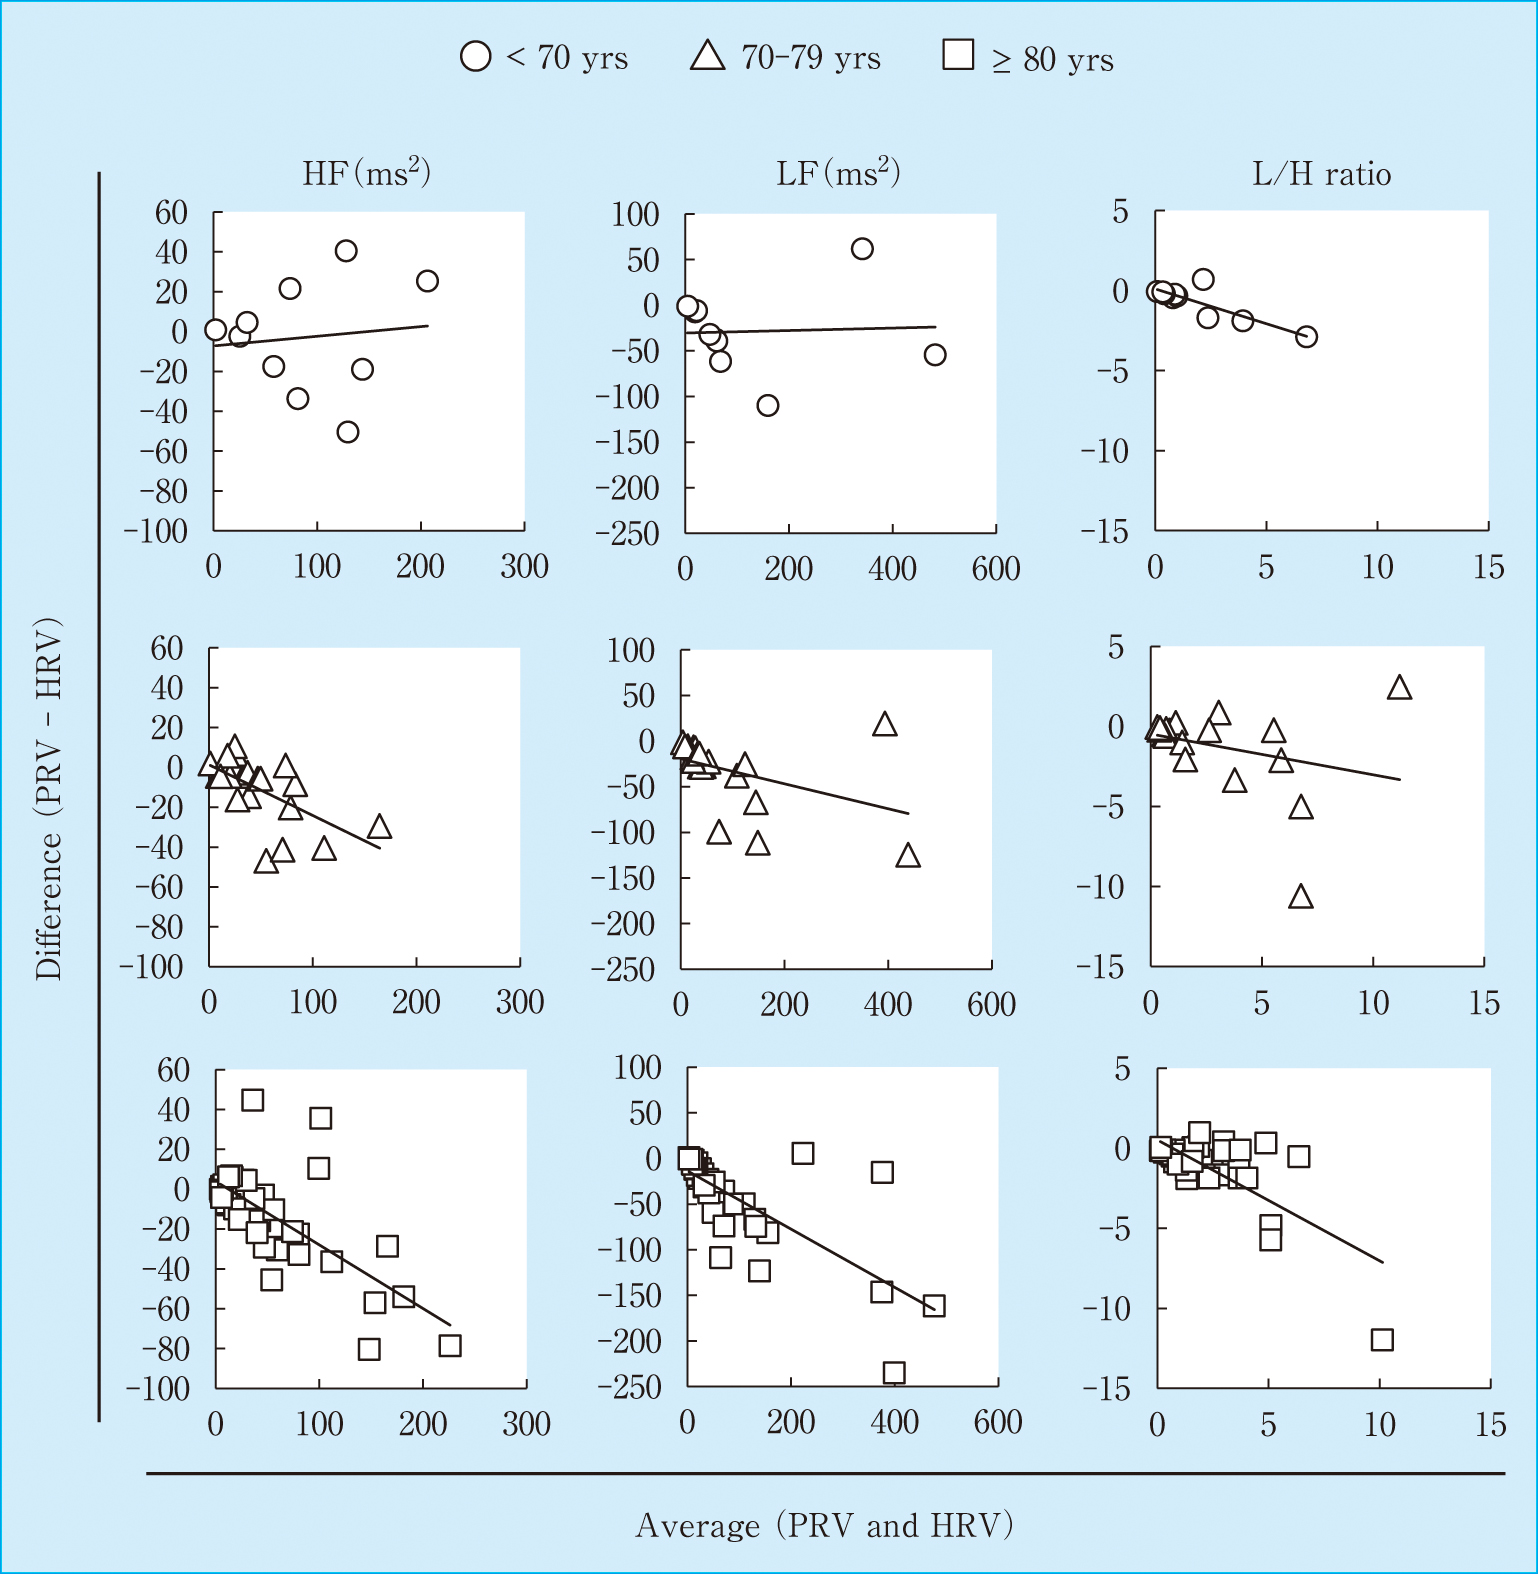
In the elderly population (mean age, 78.7 years, n = 73), the correlation coefficients (r) for HR, LF, and HF, and the L/H ratio were 0.999 (95% confidence interval, 95% CI: 0.997–0.999), 0.943 (0.911–0.964), 0.930 (0.891–0.956), and 0.897 (0.840–0.934), respectively. The mean differences in HR, LF, HF, and L/H ratio were −0.51 (lower and upper limits of agreement: −1.23, 0.22), −36.1 (−126.5, 54.4), −10.9 (−56.4, 34.5), and −1.0 (−5.26, 3.19), respectively. These results suggest that PRV can be a surrogate for HRV in the elderly population. Thus, to examine the effect of aging on frequency components in PRV, we next divided the participants into three groups, namely, those younger than 70 years old (< 70 yrs), those older than 70 years and younger than 80 years (70–79 yrs), and those older than 80 years (≥ 80 yrs) (Table 1). When we compared with the ratio of PRV to HRV components, LF, HF, and L/H tended to gradually decrease with age (Table 2). Furthermore, the slopes of regression curves in all the components gradually decreased with age (Figure 1). In particular, the slopes of regression curves in HF (y = 0.6897x + 5.5114) and LF (y = 0.6983x − 9.0331) components in the ≥ 80 yrs group were lower than those in the < 70 yrs (y = 0.9506x + 1.4551, p = 0.021, pcorr = 0.063) and 70–79 yrs groups (y = 0.8384x − 14.867, p = 0.032, pcorr = 0.096). Interestingly, Bland–Altman plot analysis revealed that the slopes of HF (y = −0.3192x + 3.9808) and LF (y = −0.3193x − 13.627) components in the ≥ 80 yrs group were significantly higher than those in the < 70 yrs group (y = 0.0483x − 7.2394, p = 0.005, pcorr = 0.015 and y = 0.0134x − 30.397, p = 0.0007, pcorr = 0.0021, respectively). In addition, those of LF (y = −0.3193x − 13.627) and L/H ratio (y = −0.7556x + 0.5159) in the ≥ 80 yrs group were also higher than those in the 70–79 yrs group (y = −0.1366x − 19.581, p = 0.027, pcorr = 0.081 and y = −0.255x − 0.4714, p = 0.017, pcorr = 0.051, respectively) (Figure 2). These results suggest that the frequency components derived from PRV were more underestimated than those derived from HRV depending on age.
Table 1
Patient profile
| Group |
< 70 yrs old
(N = 10) |
70–79 yrs old
(N = 21) |
> 80 yrs old
(N = 42) |
| Mean age |
62.3 ± 4.3 |
75.3 ± 3.2 |
84.4 ± 3.4 |
| Male ratio |
4 (40%) |
5 (23.8%) |
14 (33.3%) |
| Hypertension |
4 (40%) |
10 (47.6%) |
31 (73.8%) |
| Dyslipidemia |
3 (30%) |
5 (23.8%) |
8 (19.0%) |
| Diabetes mellitus |
1 (10%) |
3 (14.3%) |
3 (7.1%) |
Table 2
Frequency domains of HRV and PRV in those younger than 70 years (< 70 yrs), those older than 70 years and younger than 80 years (70–79 yrs), and those older than 80 years (≥ 80 yrs)
| Group |
< 70 yrs old
(N = 10) |
70–79 yrs old
(N = 21) |
> 80 yrs old
(N = 42) |
| HRV |
|
|
|
| HF (ms2) |
89.7 ± 63.2 |
52.9 ± 44.6 |
59.4 ± 63.4 |
| LF (ms2) |
140.7 ± 160.3 |
102.7 ± 127.0 |
103.0 ± 137.1 |
| L/H |
2.2 ± 2.6 |
3.3 ± 3.5 |
2.6 ± 2.9 |
| PRV |
|
|
|
| HF (ms2) |
86.7 ± 66.2 |
42.1 ± 34.8 |
46.5 ± 46.4 |
| LF (ms2) |
112.0 ± 162.4 |
71.2 ± 111.1 |
62.9 ± 100.0 |
| L/H |
1.5 ± 1.7 |
2.1 ± 2.9 |
1.5 ± 1.5 |
| PRV/HRV ratio |
|
|
|
| HF |
1.03 ± 0.30 |
1.09 ± 1.13 |
0.94 ± 0.63 |
| LF |
0.67 ± 0.25 |
0.61 ± 0.18 |
0.58 ± 0.23 |
| L/H |
0.72 ± 0.25 |
0.68 ± 0.33 |
0.66 ± 0.32 |
Data are shown as mean ± standard deviation (SD).
Discussion
In this study, we compared the PRV components from PPG with the HRV components from ECG in the supine position during spontaneous breathing in an elderly population, and found a high correlation between PRV and HRV. However, when we divided the participants into three groups, namely, (1) those younger than 70 years old, (2) those older than 70 years and younger than 80 years, and (3) those older than 80 years, we found for the first time that PRV was more underestimated than HRV depending on age, although the PRV components were highly correlated with the HRV ones in all the three groups.
It has been reported that HRV is significantly reduced in patients with diabetes mellitus compared with healthy controls.14) We further eliminated these patients and then compared the slopes of regression curves obtained from the Bland–Altman plot between the < 70 yrs (n = 9) and ≥ 80 yrs groups (n = 39). As similarly shown in Figure 2, the slopes of HF (y = −0.3233x + 3.6705) and LF (y = −0.2242x − 17.481) components in the ≥ 80 yrs group were significantly higher than those in the < 70 yrs group (y = 0.0421x − 3.3094, p = 0.006, pcorr = 0.018 and y = 0.0042x − 25.595, p = 0.0165, pcorr = 0.049, respectively, data not shown). In addition, the percentage of patients with hypertension tended to be higher in the ≥ 80 yrs group (31/42, 73.8%) than in the < 70 yrs group (4/10, 40%). When we further divided the ≥ 80 yrs group into two, namely, those with or without hypertension, the Bland–Altman plot analysis revealed that the slope of HF components did not differ between the patients with (y = −0.3393x + 4.8214) and without (y = −0.1469x − 1.4071) hypertension (p = 0.26). As a result, the slope of LF components in the patients with hypertension (y = −0.2466x − 15.182) was significantly lower than to those in the patients without hypertension (y = −0.5788x − 7.8258) (p = 0.0012, pcorr = 0.0036, data not shown). It seems that PRV was more underestimated than HRV depending on age, but this underestimation was unrelated to the presence of diabetes mellitus and hypertension. However, to elucidate the precise contributions of these diseases, further studies are required.
Previous studies have shown that aging affects ANS function. Pulse wave velocity (PWV) was found to be associated with ANS status, such as orthostatic pressor response, heart rate variation during deep breathing, and immediate heart rate response upon standing in those older than 65 years,12) and aortic artery distensibility showed an inverse correlation with HRV in elderly nonhypertensive and cardiovascular-disease-free individuals.11) In addition, the main difference between HRV and PRV is the pulse transit time (PTT), which is the time that the pulse wave takes to travel from the heart to the fingers. Since PTT changes beat to beat and is closely related to arterial compliance and blood pressure,15) PRV could be affected by the variability of PTT caused by aging.
In conclusion, we demonstrated in this study that the frequency domain components of PRV highly correlated with those of HRV, and PRV can be used to examine the ANS function in elderly populations. However, the interpretation of results should consider the effect of aging, particular in those older than 80 years.
Disclosure of COI
There is no potential conflict of interest to disclose.
References
- 1) Akselrod S et al.: “Power spectrum analysis of heart rate fluctuation: A quantitative probe of beat-to-beat cardiovascular control,” Science, 1981; 213: 220–222.
- 2) Malik M et al.: “Heart rate variability. Standards of measurement, physiological interpretation, and clinical use. Task Force of the European Society of Cardiology and the North American Society of Pacing and Electrophysiology,” Eur Heart J, 1996; 17: 354–381.
- 3) Martin WA et al.: “ECG artifact due to deep brain stimulation,” Lancet, 2003; 361: 1431.
- 4) Hayano J et al.: “Assessment of pulse rate variability by the method of pulse frequency demodulation,” Biomed Eng Online, 2005; 4: 62.
- 5) Lu S et al.: “Can photoplethysmography variability serve as an alternative approach to obtain heart rate variability information?” J Clin Monit Comput, 2008; 22: 23–29.
- 6) Charlot K et al.: “Interchangeability between heart rate and photoplethysmography variabilities during sympathetic stimulations,” Physiol Meas, 2009; 30: 1357–1369.
- 7) Constant I et al.: “Pulse rate variability is not a surrogate for heart rate variability,” Clin Sci (Lond), 1999; 97: 391–397.
- 8) Elder A et al.: “Effects of on-road highway aerosol exposures on autonomic responses in aged, spontaneously hypertensive rats,” Inhal Toxicol, 2007; 19: 1–12.
- 9) Scridon A et al.: “Unprovoked atrial tachyarrhythmias in aging spontaneously hypertensive rats: The role of the autonomic nervous system,” Am J Physiol Heart Circ Physiol, 2012; 303: H386–H392.
- 10) Johnson TL et al.: “The dopamine D3 receptor knockout mouse mimics aging-related changes in autonomic function and cardiac fibrosis,” PLoS One, 2013; 8: e74116.
- 11) Chrysohoou C et al.: “Aortic artery distensibility shows inverse correlation with heart rate variability in elderly non-hypertensive, cardiovascular disease-free individuals: The Ikaria Study,” Heart Vessels, 2013; 28: 467–472.
- 12) Sanchez Gelós DF et al.: “Morning surge, pulse wave velocity, and autonomic function tests in elderly adults,” Blood Press Monit, 2012; 17: 103–109.
- 13) Bland JM, Altman DG: “Statistical methods for assessing agreement between two methods of clinical measurement,” Lancet, 1986; 1: 307–310.
- 14) Malpas SC, Maling TJ: “Heart-rate variability and cardiac autonomic function in diabetes,” Diabetes, 1990; 39: 1177–1181.
- 15) Allen J, Murray A: “Age-related changes in peripheral pulse timing characteristics at the ears, fingers and toes,” J Hum Hypertens, 2002; 16: 711–717.