Abstract
Aims: This study aimed to evaluate the tracking pattern of serum total cholesterol (TC) levels among Japanese children using data collected continuously for 9 years and examine the relationship between childhood and adulthood TC levels.
Methods: TC levels of 2,608 first grade primary school children enrolled during 1981-2014 from two Japanese towns were measured during annual health check-ups. Nine-year trajectories of estimated TC levels stratified by TC quartiles in the first grade were analyzed using a mixed effects model. Adulthood TC levels were measured in participants who underwent health check-ups in the same area.
Results: Overall, 1,322 boys and 1,286 girls in the first grade of a primary school were followed for 9 years. Trajectories of TC levels during the period stratified by TC quartiles in the first grade differed significantly and did not cross each other for both sexes. Childhood data of 242 adult participants were linked with their adulthood data; the mean of age was late 20s for both sexes. The average TC levels in adulthood increased from the first to the fourth quartile in the first grade. Additionally, trajectories of TC levels differed between boys and girls. The later the admission year, the more elevated the TC levels in girls.
Conclusion: Among Japanese children, TC levels were strongly tracked from childhood to adolescence for 9 years, and elevated TC levels in childhood were related to elevated TC levels in adulthood. Maintaining appropriate TC levels during childhood may be important to prevent future coronary artery diseases.
See editorial vol. 29: 5-7
Introduction
Hyperlipidemia is a well-known risk factor for coronary artery diseases (CAD). Japanese, from East Asia, had lower serum total cholesterol (TC) levels and lower CAD mortality rates compared to those of the Western countries in the 60s
1)
. Since 1970s several long-term studies in Western countries have investigated childhood metabolism and its tracking into adulthood
2-
5)
. Those studies indicated that childhood serum cholesterol levels may persist through later life. Since 1980, however, the serum TC levels in Japanese and Chinese population have risen
6)
. Tracking of the serum lipid levels from childhood to adulthood is important to prevent CAD
7)
.
According to a 12-year follow-up study among Finish children and young adults aged 3-18 years at baseline, approximately 50% of subjects who initially were in the extreme quintiles of TC, low-density lipoprotein cholesterol (LDLC), and high-density lipoprotein cholesterol (HDLC) were in the same quintile after the 12-year follow-up
4)
. The initial lipid level in childhood or adolescence was found to be the most significant predictor of serum lipid level after 12 years. Similarly, in the Bogalusa Heart Study, about 50% of the children who had TC levels or LDLC levels above the 75th percentile at baseline remained elevated 12 years later
5)
.
However, most previous studies performed to track serum lipid levels were conducted in Western countries. Moreover, many cohort studies in the past only showed correlation of measured serum lipids level at discrete time points between childhood and adulthood
2,
4)
. To our knowledge, no study has tracked changes in serum cholesterol levels in the same individual yearly, in childhood and adolescence.
Our study aimed to evaluate the pattern of serum cholesterol levels in childhood among Japanese, using data of the same individual collected continuously for 9 years from the same area over a 30-year period. It also examined the association between serum cholesterol level in childhood and that in adulthood as a subpopulation.
Methods
Study Participants
The study participants were children from the first grade of primary school (6-7 years old, hereafter referred to as the first grade) to the third grade of middle school (14-15 years old, hereafter referred to as the ninth grade) in Towns A and B in Nagano Prefecture, Japan, with populations of approximately 11,000 and 5,000, respectively, in 2015. In Japan, six years of primary school starting at age 6 years and three years of middle school after primary school are compulsory education period. Nagano Prefecture is the central part of Honshu (Main) island of Japan; about 250 km from Tokyo, located in a mountainous area. In 1990, there were about 130 and 60 births per year in Towns A and B, respectively.
A total of 4,518 children had health check-ups after 1981 in Town A and after 1996 in Town B until 2014. Among them, we excluded 1,910 children (one with unknown sex and 1,909 children without TC in the first grade); we consequently, analyzed 2,608 children (1,322 boys and 1,286 girls, Target A in
Supplementary Fig.1
) by the mixed effect model. Thereafter, analysis of the association between childhood and adulthood was limited to the 242 children (122 men and 120 women, Target B in
Supplementary Fig.1
) who underwent health check-up as adults at the same hospital in the targeted area of study.
Health Check-Up
In Japan, annual health check-up including anthropometric measurements and medical checks are required by the School Health and Safety Act during the school period. Mandatory items include measurement of height, weight, visual acuity, hearing acuity, and medical examination to check musculoskeletal system, nutritional status, and other diseases (e.g. eyes, ears and nose, heart), as well as urine examination. Blood testing can be added to items by each municipality. Town A adopted the blood test (including serum lipids, blood count etc.) in 1981 while Town B did in 1996. The school nurse measured the height and weight while the school doctor performed the medical checks. In contrast, regular health check-ups for adults officially include blood tests measuring parameter such as LDL, HDL and TC.
Data Collection and Data Merging
We obtained anonymous secondary data with unique ID for the study from 1981 to 2014 from the hospital in charge of health check-up of children and adults in those towns. In adulthood, some of the participants remained in the same town and underwent health check-up at the same hospital in the towns at least once. The data on health check-ups including an unique ID were provided by the towns and merged by the researchers. Regarding analysis of children, all pooled data over 30 years was used. Regarding adults, if they received multiple adult health check-ups for several years, we used the most recent data as the data in adulthood.
Blood Test
Blood tests that were performed included blood counts and biochemical testing. The serum lipids measured were: TC, triglyceride (TG), HDLC, and LDLC. TC and TG were measured starting from 1981: the time of initiation of blood testing for health examinations in schools. TG data was excluded from analysis because the blood samples were not collected during fasting. HDLC and LDLC were measured from 1993 and 2008, respectively. Therefore, the analyzed data were limited to 9 years of tracking and the correlation between childhood and adulthood. Finally, we decided to observe TC as the main outcome for this study.
TC and HDLC were measured by enzymatic methods. Automatic analyzers for serum analysis had been changed a few times since the initial data collection. The precision and accuracy of the lipid assays at the blood test center for the two towns has been approved by the Centers for Disease Control and Prevention/ Cholesterol Reference Method Laboratory Network and the National Cerebral and Cardiovascular Center Research Institute, Japan. Non-HDLC was calculated by subtracting the HDLC level from the TC level, and the HDLC/TC ratio was also calculated.
Statistical Analysis
We initially described the characteristics including the TC of the study participants with numbers, means, and standard deviations (SD). The descriptive statistics were presented, grouped by sex, grade, and the primary school admission years (1981-1989, 1990-1999, 2000-2009 and 2010-2014, hereafter referred to as the admission group). The number of children in 2010-2014 group was small, therefore, we collapsed the last two groups to 2000-2014 group. Secondly, intercept and coefficient on the grade level, adjusted by the admission group were calculated using the mixed effect model. Thirdly, we evaluated the association between tracking of TC and quartile group of TC (or body mass index [BMI]) in the first grade (hereafter referred to as, TC (or BMI) quartile1). We calculated the intercepts and coefficient for each TC (or BMI) quartile1 at each grade using the following model, which included interaction terms between the grade and the TC (or BMI) quartile1 in addition to the admission group as a covariate
8)
:
TCig=β1+β2×TC (or BMI) quartile1 ig+β3×Grade ig+β4×(Grade iq*TC (or BMI) quartile1 ig)+β5×admission group ig+e ig
where i represents individual, g represents grade, β1–5 represents estimates, and e is the error term and showed in the tables. For drawing the trajectories in the figures, we used the “margins” command after the mixed effect model of STATA to show the estimated TC with the 95% confidential intervals. We did not exclude any children even if data from the second grade to the ninth grade were missing because the mixed effect model conducted with STATA handles the missing data using maximum likelihood.
Finally, we compared the TC levels in adulthood by TC quartile1 and conducted trend test. All analyses were conducted using STATA version 15.1 (Stata corp., LLC., Texas, USA).
This study was approved by Saku Central Hospital’s Ethic Committee (approval number:31) and the Ethic Committee of Toho University, Faculty of Medicine (approval number: A18124_A16013_25011). Informed consents were not required because the provided data from Towns A and B were anonymous and untraceable by the researchers.
Results
Table 1
shows the characteristics of children in the first, sixth (the last grade of primary school), and the ninth grade stratified by sex and admission groups. For girls, the mean of TC in the first, the sixth and the ninth grades were different among admission groups (p<0.05 for the first year and p<0.001 the rest of two grades). The TC levels tended to be elevated the later the children were admitted to primary school. Likewise, the percentage of children with TC level over 220 mg/dl increased the later the admission year for girls. Although height, weight, and BMI varied among admission groups, no particular trend was seen for both boys and girls.
Table 1.
Characteristics of children who underwent the examination of TC at some grades stratified by sex and admission year
|
grade |
Boys (n = 1,322)
Admission year of Primary School (the first grade)
|
Girls (n = 1,286)
Admission year of Primary School (the first grade)
|
| -1989
(n = 297)
|
1990-1999
(n = 406)
|
2000-2014
(n = 619)
|
P value
|
-1989
(n = 297)
|
1990-1999
(n = 406)
|
2000-2014
(n = 619)
|
P value
|
| n
|
n
|
n
|
n
|
n
|
n
|
| TC (mg/dl) |
first |
297 |
164.3 |
406 |
166.2 |
619 |
164.8 |
0.52 |
279 |
166.8 |
396 |
172.6 |
611 |
171.3 |
0.01 |
| [mean (SD)]†
|
|
|
(22.9) |
|
(23.3) |
|
(26.2) |
|
|
(23.5) |
|
(24.6) |
|
(26.7) |
|
|
sixth |
283 |
164.2 |
389 |
167.8 |
406 |
167.5 |
0.14 |
268 |
163.0 |
366 |
167.0 |
419 |
170.3 |
<0.001 |
|
|
|
(24.2) |
|
(26.3) |
|
(24.1) |
|
|
(22.3) |
|
(24.0) |
|
(25.9) |
|
|
ninth |
278 |
155.9 |
374 |
155.0 |
261 |
157.9 |
0.32 |
265 |
167.3 |
348 |
169.9 |
289 |
176.1 |
<0.001 |
|
|
|
(22.9) |
|
(24.2) |
|
(24.3) |
|
|
(25.5) |
|
(25.5) |
|
(29.0) |
|
| TC≧220 |
first |
297 |
4 |
406 |
6 |
619 |
17 |
0.24 |
279 |
6 |
396 |
14 |
611 |
34 |
0.05 |
| [n (%)]¶
|
|
|
(1.3) |
|
(1.5) |
|
(2.8) |
|
|
(2.2) |
|
(3.5) |
|
(5.6) |
|
|
sixth |
283 |
4 |
389 |
10 |
406 |
8 |
0.57 |
268 |
4 |
366 |
8 |
419 |
21 |
0.02 |
|
|
|
(1.4) |
|
(2.6) |
|
(2.0) |
|
|
(1.5) |
|
(2.2) |
|
(5.0) |
|
|
ninth |
278 |
4 |
374 |
3 |
261 |
3 |
0.74 |
265 |
7 |
348 |
12 |
289 |
23 |
<0.01 |
|
|
|
(1.4) |
|
(0.8) |
|
(1.1) |
|
|
(2.6) |
|
(3.5) |
|
(8.0) |
|
| Height (cm) |
first |
297 |
115.4 |
406 |
116.1 |
618 |
116.0 |
0.11 |
279 |
115.2 |
396 |
115.0 |
606 |
115.2 |
0.85 |
| [mean (SD)] †
|
|
|
(4.5) |
|
(4.9) |
|
(5.1) |
|
|
(4.5) |
|
(4.8) |
|
(5.1) |
|
|
sixth |
284 |
142.7 |
387 |
144.7 |
406 |
144.3 |
<0.001 |
268 |
145.1 |
363 |
145.5 |
419 |
146.0 |
0.27 |
|
|
|
(6.2) |
|
(7.0) |
|
(7.3) |
|
|
(6.3) |
|
(6.9) |
|
(7.1) |
|
|
ninth |
277 |
163.5 |
373 |
164.7 |
263 |
164.2 |
0.07 |
264 |
156.2 |
345 |
155.9 |
290 |
156.6 |
0.25 |
|
|
|
(6.7) |
|
(6.6) |
|
(7.2) |
|
|
(5.2) |
|
(5.4) |
|
(5.4) |
|
| Weight (kg) |
first |
297 |
20.7 |
406 |
21.2 |
618 |
21.3 |
0.03 |
279 |
20.6 |
396 |
20.8 |
606 |
20.6 |
0.68 |
| [mean (SD)] †
|
|
|
(2.8) |
|
(3.4) |
|
(3.5) |
|
|
(2.6) |
|
(3.3) |
|
(3.4) |
|
|
sixth |
284 |
36.6 |
387 |
39.3 |
406 |
38.4 |
<0.001 |
268 |
37.9 |
363 |
39.0 |
419 |
38.3 |
0.21 |
|
|
|
(7.2) |
|
(9.0) |
|
(8.4) |
|
|
(6.9) |
|
(8.2) |
|
(8.0) |
|
|
ninth |
277 |
53.6 |
373 |
55.7 |
263 |
54.1 |
0.02 |
264 |
51.2 |
344 |
51.3 |
289 |
50.4 |
0.27 |
|
|
|
(9.2) |
|
(10.4) |
|
(9.5) |
|
|
(7.7) |
|
(7.7) |
|
(8.2) |
|
| BMI§
|
first |
297 |
15.5 |
406 |
15.6 |
618 |
15.8 |
0.07 |
279 |
15.5 |
396 |
15.7 |
606 |
15.5 |
0.22 |
| [mean (SD)] †
|
|
|
(1.4) |
|
(1.7) |
|
(1.7) |
|
|
(1.4) |
|
(1.8) |
|
(1.7) |
|
|
sixth |
284 |
17.9 |
387 |
18.6 |
406 |
18.3 |
<0.01 |
268 |
17.9 |
363 |
18.3 |
419 |
17.8 |
0.05 |
|
|
|
(2.6) |
|
(3.1) |
|
(3.0) |
|
|
(2.4) |
|
(2.9) |
|
(2.7) |
|
|
ninth |
277 |
20.0 |
373 |
20.4 |
263 |
20.0 |
0.05 |
264 |
21.0 |
344 |
21.1 |
289 |
20.5 |
0.03 |
|
|
|
(2.7) |
|
(3.0) |
|
(2.7) |
|
|
(2.8) |
|
(2.9) |
|
(3.0) |
|
Abbreviation: BMI, Body Mass Index; SD, Standard Deviation; TC, Total Cholesterol,
§BMI is weight (kg)/height (m)2, †ANOVA was applied, ¶ Chi square test was applied
Fig.1A and B
shows the estimated TC calculated by the mixed effect model for boys and girls, respectively. For boys, TC level in the fifth grade was 169 mg/dl, the highest. After the fifth grade, it descended up to the third grade of middle school. For girls, TC level from the first grade to the fourth grade was unchanged. It started to decline from the fifth grade, and the first grade of middle school was the lowest. Thereafter it started to rise.
Fig.1
was drawn based on the result of the regression analysis shown in
Supplementary Table 1
.

Supplementary Table 1.
Mixed effect model to evaluate trajectories of TC in each grade of school children stratified by sex
| Factor |
Boys (n = 1,321)
|
Girls (n = 1,281)
|
| Coefficient (SE) |
95% CI |
P value
|
Coefficient (SE) |
95%CI |
P value
|
| Intercept |
163.2 (1.29) |
160.6 |
165.7 |
<0.001 |
166.4 (1.38) |
163.6 |
169.1 |
<0.001 |
| Grade |
|
|
|
|
|
|
|
|
| 1st |
Reference |
|
|
|
Reference |
|
|
|
| 2nd |
0.81 (0.51) |
-0.18 |
1.80 |
0.11 |
0.97 (0.53) |
-0.08 |
2.01 |
0.07 |
| 3rd |
1.35 (0.51) |
0.35 |
2.35 |
0.008 |
0.57 (0.54) |
-0.50 |
1.63 |
0.30 |
| 4th |
2.43 (0.52) |
1.41 |
3.45 |
<0.001 |
0.62 (0.55) |
-0.46 |
1.70 |
0.26 |
| 5th |
4.40 (0.53) |
3.37 |
5.43 |
<0.001 |
-0.24 (0.55) |
-1.33 |
0.84 |
0.66 |
| 6th |
1.38 (0.53) |
0.34 |
2.43 |
0.01 |
-3.47 (0.56) |
-4.56 |
-2.37 |
<0.001 |
| 7th |
-5.48 (0.54) |
-6.55 |
-4.41 |
<0.001 |
-6.09 (0.57) |
-7.20 |
-4.97 |
<0.001 |
| 8th |
-8.76 (0.55) |
-9.84 |
-7.67 |
<0.001 |
-3.04 (0.58) |
-4.17 |
-1.90 |
<0.001 |
| 9th |
-9.35 (0.56) |
-10.45 |
-8.24 |
<0.001 |
0.69 (0.59) |
-0.47 |
1.84 |
0.24 |
| Enroll year of primary school |
|
|
|
|
|
|
|
|
| -1989 |
Reference |
|
|
|
Reference |
|
|
|
| 1990-1999 |
1.93 (1.64) |
-1.29 |
5.16 |
0.24 |
4.46 (1.74) |
1.05 |
7.87 |
0.01 |
| 2000-2014 |
2.94 (1.53) |
-0.05 |
5.94 |
0.05 |
6.33 (1.62) |
3.17 |
9.50 |
<0.001 |
Abbreviations: CI, Confidential Interval; SE, Standard Error; TC, Total Cholesterol
We demonstrated the trajectories of TC by TC quartile1 (
Fig.2A and B)
according to the results from the mixed effect model shown in
Table 2
. The levels of TC by TC quartile1 were statistically significant and they did not ever cross each other during the 9 years. Likewise,
Fig.2C and D
demonstrated the levels of TC by BMI quartile1 according to the results shown in
Supplementary Table 2
. There was no clear difference in TC trajectories during the 9 years for both boys and girls.
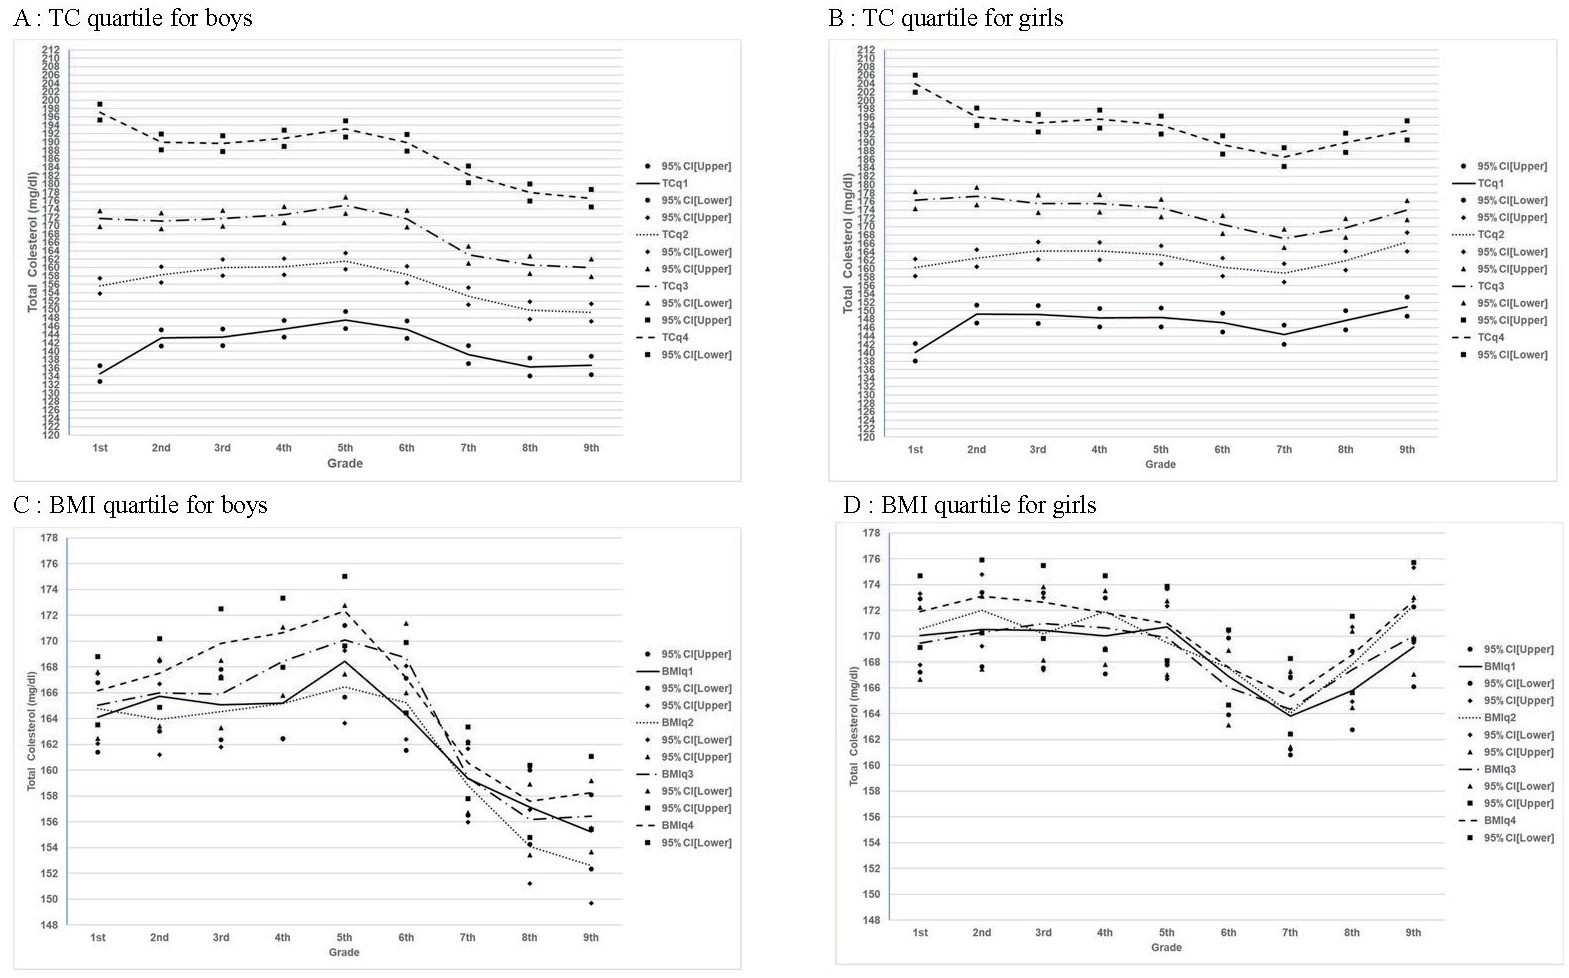
Table 2.
Mixed effect model to evaluate trajectories of TC in each grade of school children by the TC quartile in the first grade, stratified by sex
|
Boys (n = 1,322)
|
Girls (n = 1,286)
|
| Adjusted model§
|
Adjusted+Interaction term†
|
Adjusted model§
|
Adjusted+Interaction term†
|
| Coefficient (SE) |
95%CI |
P value
|
Coefficient (SE) |
95%CI |
P value
|
Coefficient (SE) |
95%CI |
P value
|
Coefficient (SE) |
95%CI |
P value
|
| Intercept |
141.1 |
139.1 |
143.1 |
<0.001 |
133.7 |
131.4 |
135.9 |
<0.001 |
145.9 |
143.7 |
148.1 |
<0.001 |
133.7 |
131.4 |
135.9 |
<0.001 |
| TC Quartile |
|
|
|
|
|
|
|
|
|
|
|
|
|
|
|
|
| quartile 1 |
Reference |
|
|
|
Reference |
|
|
|
Reference |
|
|
|
Reference |
|
|
|
| quartile 2 |
15.55 (1.02) |
13.54 |
17.56 |
<0.001 |
20.95 (1.36) |
18.30 |
23.61 |
<0.001 |
15.44 (1.15) |
13.20 |
17.69 |
<0.001 |
20.13 (1.48) |
17.24 |
23.03 |
<0.001 |
| quartile 3 |
28.22 (1.03) |
26.21 |
30.23 |
<0.001 |
37.04 (1.36) |
34.38 |
39.71 |
<0.001 |
26.93 (1.15) |
24.68 |
29.17 |
<0.001 |
36.14 (1.48) |
33.24 |
39.04 |
<0.001 |
| quartile 4 |
47.34 (1.02) |
45.33 |
49.35 |
<0.001 |
62.49 (1.36) |
59.82 |
65.16 |
<0.001 |
47.75 (1.15) |
45.48 |
50.01 |
<0.001 |
63.85 (1.48) |
60.94 |
66.76 |
<0.001 |
| Grade |
|
|
|
|
|
|
|
|
|
|
|
|
|
|
|
|
| First |
Reference |
|
|
|
Reference |
|
|
|
Reference |
|
|
|
Reference |
|
|
|
| second |
0.79 (0.50) |
-0.20 |
1.78 |
0.12 |
8.51 (1.01) |
6.53 |
10.50 |
<0.001 |
1.03 (0.53) |
-0.01 |
2.07 |
0.05 |
9.06 (1.06) |
6.98 |
11.14 |
<0.001 |
| third |
1.29 (0.51) |
0.30 |
2.29 |
0.01 |
8.71 (1.03) |
6.69 |
10.73 |
<0.001 |
0.62 (0.54) |
-0.44 |
1.67 |
0.25 |
8.99 (1.08) |
6.88 |
11.10 |
<0.001 |
| fourth |
2.36 (0.52) |
1.34 |
3.37 |
<0.001 |
10.71 (1.05) |
8.66 |
12.76 |
<0.001 |
0.65 (0.55) |
-0.42 |
1.72 |
0.24 |
8.23 (1.11) |
6.06 |
10.40 |
<0.001 |
| fifth |
4.33 (0.52) |
3.30 |
5.35 |
<0.001 |
12.78 (1.06) |
10.71 |
14.86 |
<0.001 |
-0.20 (0.55) |
-1.28 |
0.88 |
0.72 |
8.30 (1.11) |
6.12 |
10.48 |
<0.001 |
| sixth |
1.34 (0.53) |
0.29 |
2.38 |
0.01 |
10.53 (1.07) |
8.43 |
12.63 |
<0.001 |
-3.42 (0.56) |
-4.52 |
-2.33 |
<0.001 |
7.05 (1.12) |
4.85 |
9.24 |
<0.001 |
| seventh |
-5.53 (0.54) |
-6.59 |
-4.46 |
<0.001 |
4.55 (1.10) |
2.41 |
6.70 |
<0.001 |
-6.03 (0.57) |
-7.14 |
-4.92 |
<.001 |
4.20 (1.13) |
1.98 |
6.42 |
<0.001 |
| eighth |
-8.81 (0.55) |
-9.89 |
-7.73 |
<0.001 |
1.62 (1.11) |
-0.56 |
3.80 |
0.15 |
-2.97 (0.58) |
-4.10 |
-1.84 |
<.001 |
7.58 (1.15) |
5.33 |
9.84 |
<0.001 |
| ninth |
-9.39 (0.56) |
-10.49 |
-8.30 |
<0.001 |
1.95 (1.12) |
-0.25 |
4.16 |
0.08 |
0.78 (0.59) |
-0.38 |
1.91 |
.19 |
10.86 (1.16) |
8.58 |
13.14 |
<0.001 |
| Grade* TC Quartile
|
|
|
|
|
|
|
|
|
|
|
|
|
|
|
|
|
| 2nd* TCq2
|
|
|
|
|
-5.82 (1.41) |
-8.59 |
-3.05 |
<0.001 |
|
|
|
|
-6.82 (1.48) |
-9.72 |
-3.93 |
<0.001 |
| 2nd* TCq3
|
|
|
|
|
-9.06 (1.41) |
-11.83 |
-6.29 |
<0.001 |
|
|
|
|
-8.07 (1.48) |
-10.98 |
-5.16 |
<0.001 |
| 2nd* TCq4
|
|
|
|
|
-15.69 (1.41) |
-18.45 |
-12.92 |
<0.001 |
|
|
|
|
-16.93 (1.49) |
-19.85 |
-14.01 |
<0.001 |
| 3rd* TCq2
|
|
|
|
|
-4.33 (1.43) |
-7.13 |
-1.52 |
0.002 |
|
|
|
|
-5.01 (1.50) |
-7.94 |
-2.07 |
0.001 |
| 3rd* TCq3
|
|
|
|
|
-8.64(1.43) |
-11.45 |
-5.83 |
<0.001 |
|
|
|
|
-9.82 (1.50) |
-12.76 |
-6.88 |
<0.001 |
| 3rd* TCq4
|
|
|
|
|
-16.25 (1.43) |
-19.05 |
-13.45 |
<0.001 |
|
|
|
|
-18.37 (1.51) |
-21.32 |
-15.41 |
<0.001 |
| 4th* TCq2
|
|
|
|
|
-6.16 (1.45) |
-9.01 |
-3.31 |
<0.001 |
|
|
|
|
-4.31 (1.53) |
-7.31 |
-1.30 |
0.005 |
| 4th* TCq3
|
|
|
|
|
-9.74 (1.46) |
-12.59 |
-6.89 |
<0.001 |
|
|
|
|
-8.98 (1.53) |
-11.98 |
-5.98 |
<0.001 |
| 4th* TCq4
|
|
|
|
|
-16.99 (1.45) |
-19.82 |
-14.15 |
<0.001 |
|
|
|
|
-16.64 (1.53) |
-19.65 |
-13.63 |
<0.001 |
| 5th* TCq2
|
|
|
|
|
-6.86 (1.47) |
-9.75 |
-3.99 |
<0.001 |
|
|
|
|
-5.28 (1.54) |
-8.30 |
-2.26 |
0.001 |
| 5th* TCq3
|
|
|
|
|
-9.58 (1.47) |
-12.47 |
-6.70 |
<0.001 |
|
|
|
|
-10.15 (1.53) |
-13.16 |
-7.14 |
<0.001 |
| 5th* TCq4
|
|
|
|
|
-17.85 (1.49) |
-19.70 |
-13.96 |
<0.001 |
|
|
|
|
-18.11 (1.54) |
-21.13 |
-15.08 |
<0.001 |
| 6th* TCq2
|
|
|
|
|
-7.80 (1.49) |
-10.72 |
-4.87 |
<0.001 |
|
|
|
|
-6.92 (1.56) |
-9.98 |
-3.86 |
<0.001 |
| 6th* TCq3
|
|
|
|
|
-10.60 (1.49) |
-13.52 |
-7.67 |
<0.001 |
|
|
|
|
-12.83 (1.55) |
-15.85 |
-9.78 |
<0.001 |
| 6th* TCq4
|
|
|
|
|
-16.83 (1.47) |
-20.76 |
-14.93 |
<0.001 |
|
|
|
|
-21.58 (1.56) |
-24.64 |
-18.51 |
<0.001 |
| 7th* TCq2
|
|
|
|
|
-6.97 (1.53) |
-9.96 |
-3.98 |
<0.001 |
|
|
|
|
-5.45 (1.58) |
-8.58 |
-2.40 |
<0.001 |
| 7th* TCq3
|
|
|
|
|
-13.19 (1.52) |
-16.17 |
-10.20 |
<0.001 |
|
|
|
|
-13.25 (1.57) |
-16.33 |
-10.18 |
<0.001 |
| 7th* TCq4
|
|
|
|
|
-19.46 (1.51) |
-22.43 |
-16.49 |
<0.001 |
|
|
|
|
-21.63 (1.59) |
-24.74 |
-18.52 |
<0.001 |
| 8th* TCq2
|
|
|
|
|
-7.45 (1.55) |
-10.49 |
-4.41 |
<0.001 |
|
|
|
|
-5.94 (1.61) |
-9.08 |
-2.78 |
<0.001 |
| 8th* TCq3
|
|
|
|
|
-12.68 (1.55) |
-15.71 |
-9.64 |
<0.001 |
|
|
|
|
-14.13 (1.60) |
-17.26 |
-11.00 |
<0.001 |
| 8th*TCq4
|
|
|
|
|
-20.83 (1.54) |
-23.84 |
-17.82 |
<0.001 |
|
|
|
|
-21.63 (1.61) |
-24.79 |
-18.47 |
<0.001 |
| 9th*TCq2
|
|
|
|
|
-8.31 (1.58) |
-11.41 |
-5.23 |
<0.001 |
|
|
|
|
-4.78 (1.62) |
-7.97 |
-1.60 |
0.003 |
| 9th*TCq3
|
|
|
|
|
-13.67 (1.57) |
-16.74 |
-10.60 |
<0.001 |
|
|
|
|
-13.20 (1.63) |
-16.39 |
-10.01 |
<0.001 |
| 9th*TCq4
|
|
|
|
|
-22.55 (1.56) |
-25.60 |
-19.49 |
<0.001 |
|
|
|
|
-22.00 (1.63) |
-25.20 |
-18.80 |
<0.001 |
| Admission year of Primary School (the first grade) |
|
|
|
|
|
|
|
|
|
|
|
|
|
|
|
|
| -1989 |
Reference |
|
|
|
Reference |
|
|
|
Reference |
|
|
|
Reference |
|
|
|
| 1990-1999 |
0.23 (0.98) |
-1.7 |
2.16 |
0.82 |
0.31 (0.98) |
-1.61 |
2.23 |
0.75 |
0.29 (1.12) |
-1.89 |
2.48 |
0.79 |
0.36 (1.11) |
-1.81 |
2.54 |
0.74 |
| 2000-2014 |
2.14 (0.92) |
0.34 |
3.95 |
0.02 |
2.25 (0.92) |
0.46 |
4.05 |
0.01 |
4.07 (1.04) |
2.03 |
6.10 |
<0.001 |
4.12 (1.03) |
2.09 |
6.14 |
<0.001 |
Abbreviation: CI, Confidential Interval; SE, Standard Error; TC, Total Cholesterol,
§Adjusted by admission year of Primary School, †In addition to adjusted model, interaction terms between TC quartile in the first grade and each grade were added.
Supplementary Table2.
Mixed effect model to evaluate trajectories of TC in each grade of school children by the BMI quartile in the first grade stratified by sex
|
Boys (n = 1.322)
|
Girls (n = 1,286)
|
| Adjusted model§
|
Adjusted+Interaction term†
|
Adjusted model§
|
Adjusted+Interaction term†
|
| Coefficient (SE) |
95 % CI |
P value
|
Coefficient (SE) |
95 % CI |
P value
|
Coefficient (SE) |
95 % CI |
P value
|
Coefficient (SE) |
95 % CI |
P value
|
| Intercept |
162.4 (1.66) |
159.1 |
165.6 |
<0.001 |
162.3 (1.75) |
158.9 |
165.8 |
<0.001 |
165.7 (1.82) |
162.1 |
169.3 |
<0.001 |
165.9 (1.92) |
162.2 |
169.7 |
<0.001 |
| BMI Quartile |
|
|
|
|
|
|
|
|
|
|
|
|
|
|
|
|
| q1 |
Reference |
|
|
|
Reference |
|
|
|
Reference |
|
|
|
Reference |
|
|
|
| q2 |
-0.85 (1.72) |
-4.22 |
2.51 |
0.62 |
0.67 (1.95) |
-3.15 |
4.50 |
0.73 |
0.84 (1.78) |
-2.64 |
4.34 |
0.63 |
0.48 (2.02) |
-3.47 |
4.44 |
0.81 |
| q3 |
1.27 (1.67) |
-2.01 |
4.55 |
0.45 |
0.94 (1.90) |
-2.78 |
4.66 |
0.62 |
0.08 (1.80) |
-3.45 |
3.60 |
0.97 |
-0.60 (2.04) |
-4.60 |
3.39 |
0.77 |
| q4 |
2.89 (1.69) |
-0.42 |
6.19 |
0.09 |
2.06 (1.92) |
-1.70 |
5.82 |
0.28 |
1.89 (1.80) |
-1.62 |
5.40 |
0.29 |
1.85 (2.03) |
-2.12 |
5.83 |
0.36 |
| Grade |
|
|
|
|
|
|
|
|
|
|
|
|
|
|
|
|
| 1st |
Reference |
|
|
|
Reference |
|
|
|
Reference |
|
|
|
Reference |
|
|
|
| 2nd |
0.80 (0.51) |
-0.20 |
1.79 |
0.12 |
1.63 (1.03) |
-0.38 |
3.65 |
0.11 |
0.99 (0.54) |
-0.06 |
2.04 |
0.07 |
0.46 (1.08) |
-1.67 |
2.58 |
0.67 |
| 3rd |
1.34 (0.51) |
0.34 |
2.34 |
0.009 |
0.98 (1.04) |
-1.06 |
3.01 |
0.35 |
0.58 (0.54) |
-0.48 |
1.64 |
0.28 |
0.40 (1.11) |
-1.77 |
2.56 |
0.72 |
| 4th |
2.42 (0.52) |
1.40 |
3.43 |
<0.001 |
1.11 (1.06) |
-0.97 |
3.19 |
0.30 |
0.62 (0.55) |
-0.46 |
1.70 |
0.26 |
-0.04 (1.13) |
-2.25 |
2.17 |
0.97 |
| 5th |
4.38 (0.53) |
3.35 |
5.41 |
<0.001 |
4.35 (1.07) |
2.26 |
6.44 |
<0.001 |
-0.24 (0.55) |
-1.32 |
0.84 |
0.67 |
0.67 (1.13) |
-1.55 |
2.89 |
0.55 |
| 6th |
1.35 (0.53) |
0.31 |
2.40 |
0.01 |
0.21 (1.08) |
-1.91 |
2.33 |
0.85 |
-3.49 (0.56) |
-4.59 |
-2.38 |
<0.001 |
-3.18 (1.14) |
-5.42 |
-0.94 |
0.005 |
| 7th |
-5.48 (0.55) |
-6.55 |
-4.42 |
<0.001 |
-4.75 (1.11) |
-6.92 |
-2.58 |
<0.001 |
-6.11 (0.57) |
-7.23 |
-4.99 |
<0.001 |
-6.26 (1.16) |
-8.54 |
-3.98 |
<0.001 |
| 8th |
-8.77 (0.55) |
-9.86 |
-7.69 |
<0.001 |
-6.97 (1.13) |
-9.18 |
-4.76 |
<0.001 |
-3.06 (0.58) |
-4.20 |
-1.92 |
<0.001 |
-4.25 (1.19) |
-6.59 |
-1.91 |
<0.001 |
| 9th |
-9.35 (0.56) |
-10.45 |
-8.25 |
<0.001 |
-8.90 (1.13) |
-11.12 |
-6.68 |
<0.001 |
0.64 (0.59) |
-0.52 |
1.79 |
0.28 |
-0.88 (1.22) |
-3.27 |
1.52 |
0.47 |
| Grade* BMI Quartile
|
|
|
|
|
|
|
|
|
|
|
|
|
|
|
|
|
| 2th* BMIq2
|
|
|
|
|
-2.47 (1.46) |
-5.33 |
0.39 |
0.09 |
|
|
|
|
1.00 (1.51) |
-1.96 |
3.96 |
0.51 |
| 2th* BMIq3
|
|
|
|
|
-0.67 (1.42) |
-3.46 |
2.12 |
0.64 |
|
|
|
|
0.37 (1.52) |
-2.62 |
3.35 |
0.81 |
| 2th* BMIq4
|
|
|
|
|
-0.28 (1.43) |
-3.08 |
2.53 |
0.85 |
|
|
|
|
0.72 (1.53) |
-2.27 |
3.71 |
0.64 |
| 3rd* BMIq2
|
|
|
|
|
-1.21 (1.47) |
-4.10 |
1.67 |
0.41 |
|
|
|
|
-0.74 (1.54) |
-3.75 |
2.27 |
0.63 |
| 3rd* BMIq3
|
|
|
|
|
-0.13 (1.44) |
-2.95 |
2.69 |
0.93 |
|
|
|
|
1.14 (1.54) |
-1.89 |
4.17 |
0.46 |
| 3rd* BMIq4
|
|
|
|
|
2.68 (1.45) |
-0.15 |
5.52 |
0.07 |
|
|
|
|
0.35 (1.55) |
-2.68 |
3.37 |
0.82 |
| 4th* BMIq2
|
|
|
|
|
-0.73 (1.50) |
-3.67 |
2.21 |
0.63 |
|
|
|
|
1.40 (1.56) |
-1.67 |
4.46 |
0.37 |
| 4th* BMIq3
|
|
|
|
|
2.29 (1.47) |
-0.58 |
5.17 |
0.12 |
|
|
|
|
1.25 (1.57) |
-1.84 |
4.33 |
0.43 |
| 4th* BMIq4
|
|
|
|
|
3.38 (1.47) |
0.50 |
6.26 |
0.02 |
|
|
|
|
-0.05 (1.57) |
-3.13 |
3.03 |
0.97 |
| 5th* BMIq2
|
|
|
|
|
-2.68 (1.52) |
-5.65 |
0.30 |
0.08 |
|
|
|
|
-1.71 (1.57) |
-4.78 |
1.36 |
0.28 |
| 5th* BMIq3
|
|
|
|
|
0.71 (1.48) |
-2.18 |
3.61 |
0.63 |
|
|
|
|
-0.25 (1.58) |
-3.34 |
2.84 |
0.87 |
| 5th* BMIq4
|
|
|
|
|
1.81 (1.48) |
-1.09 |
4.71 |
0.22 |
|
|
|
|
-1.61 (1.58) |
-4.71 |
1.49 |
0.31 |
| 6th* BMIq2
|
|
|
|
|
0.25 (1.54) |
-2.77 |
3.26 |
0.87 |
|
|
|
|
0.17 (1.59) |
-2.94 |
3.28 |
0.91 |
| 6th* BMIq3
|
|
|
|
|
3.44 (1.51) |
0.49 |
6.39 |
0.02 |
|
|
|
|
-0.26 (1.60) |
-3.41 |
2.88 |
0.87 |
| 6th* BMIq4
|
|
|
|
|
0.79 (1.50) |
-2.15 |
3.74 |
0.60 |
|
|
|
|
-1.14 (1.60) |
-4.29 |
1.99 |
0.47 |
| 7th* BMIq2
|
|
|
|
|
-1.20 (1.57) |
-4.28 |
1.88 |
0.44 |
|
|
|
|
-0.23 (1.61) |
-3.38 |
2.92 |
0.89 |
| 7th* BMIq3
|
|
|
|
|
-0.87 (1.53) |
-3.87 |
2.13 |
0.57 |
|
|
|
|
1.15 (1.63) |
-2.05 |
4.34 |
0.48 |
| 7th* BMIq4
|
|
|
|
|
-0.84 (1.54) |
-3.86 |
2.18 |
0.59 |
|
|
|
|
-0.30 (1.63) |
-3.51 |
2.89 |
0.85 |
| 8th* BMIq2
|
|
|
|
|
-3.73 (1.59) |
-6.85 |
-0.61 |
0.02 |
|
|
|
|
1.53 (1.64) |
-1.68 |
4.74 |
0.35 |
| 8th* BMIq3
|
|
|
|
|
-1.90 (1.56) |
-4.95 |
1.16 |
0.22 |
|
|
|
|
2.22 (1.66) |
-1.05 |
5.48 |
0.18 |
| 8th* BMIq4
|
|
|
|
|
-1.60 (1.57) |
-4.68 |
1.48 |
0.31 |
|
|
|
|
0.92 (1.67) |
-2.35 |
4.19 |
0.58 |
| 9th* BMIq2
|
|
|
|
|
-3.27 (1.62) |
-6.44 |
-0.11 |
0.04 |
|
|
|
|
2.74 (1.67) |
-0.54 |
6.02 |
0.10 |
| 9th* BMIq3
|
|
|
|
|
0.28 (1.57) |
-2.80 |
3.37 |
0.86 |
|
|
|
|
1.43 (1.69) |
-1.88 |
4.75 |
0.40 |
| 9th* BMIq4
|
|
|
|
|
0.98 (1.59) |
-2.14 |
4.10 |
0.54 |
|
|
|
|
1.69 (1.69) |
-1.63 |
5.01 |
0.32 |
| Admission year of primary school |
|
|
|
|
|
|
|
|
|
|
|
|
|
|
|
|
| -1989 |
Reference |
|
|
|
Reference |
|
|
|
Reference |
|
|
|
Reference |
|
|
|
| 1990-1999 |
1.89 (1.64) |
-1.32 |
5.11 |
0.25 |
1.90 (1.64) |
-1.32 |
5.11 |
0.25 |
4.40 (1.74) |
0.98 |
7.82 |
0.01 |
4.40 (1.74) |
0.99 |
7.82 |
0.01 |
| 2000-2014 |
2.82 (1.53) |
-0.17 |
5.82 |
0.07 |
2.82 (1.53) |
-0.17 |
5.82 |
0.07 |
6.32 (1.63) |
3.13 |
9.51 |
<0.001 |
6.33 (1.63) |
3.14 |
9.52 |
<0.001 |
Abbreviations: CI, Confidential Interval; SE, Standard Error; TC, Total Cholesterol
§Adjusted by admission year of primary school
†In addition to adjusted model, iteraction terms between BMI quartile at 1st grade and each grade were added.
For 242 adults (122 men and 120 women), data in childhood were successfully linked with the data in adulthood. Mean and SD for age were 28.3±5.6 for men and 27.3±5.8. for women. Average TC in adulthood increased from the first quartile1 to fourth quartile1 for both men (trend p<.001) and women (trend p<.001). Percentage of TC ≧220 mg/dl in adulthood also increased from the first quartile1 to the fourth quartile1 for both men and women (trend p=.04 and .01, respectively) (
Table 3)
. We had similar results when analysis was conducted excluding children with TC levels over 220 mg/dl at any grades during childhood who were suspected to have family hyperlipidemia (data not shown). There was no difference in age, height, weight, and BMI in adulthood by TC quartile1.
Table 3.
Mean of age, height, weight, BMI, and TC and percentages of TC 220 mg/dl in adulthood by the TC quartile in the first grade in men (
n = 122) and women (
n = 120)
|
|
quartile 1
(Men n = 30, Women n = 36)
|
quartile 2
(Men n = 24, Women n = 33)
|
quartile 3
(Men n = 41, Women n = 21)
|
quartile 4
(Men n = 27, Women n = 30)
|
Trend P
|
| mean |
SD |
min |
max |
mean |
SD |
min |
max |
mean |
SD |
min |
max |
mean |
SD |
min |
max |
| Men |
age |
28.7 |
5.55 |
19 |
38 |
26.8 |
5.64 |
18 |
37 |
28.9 |
5.64 |
20 |
38 |
28.6 |
5.73 |
21 |
37 |
0.83 |
| hight (cm) |
171.6 |
4.97 |
162.1 |
180.1 |
169.5 |
6.09 |
158 |
183.8 |
172.9 |
5.24 |
162.6 |
183.8 |
169.5 |
5.58 |
154.2 |
180.7 |
0.56 |
| weight (kg) |
72.0 |
13.20 |
50.5 |
111.2 |
70.0 |
16.27 |
44.4 |
109.9 |
68.4 |
13.35 |
45.9 |
125.2 |
68.0 |
13.08 |
37.3 |
95 |
0.13 |
| BMIa
|
24.5 |
4.57 |
18 |
38.8 |
24.2 |
4.71 |
17.2 |
35 |
22.9 |
4.33 |
16.2 |
43.8 |
23.6 |
3.78 |
15.7 |
32.4 |
0.29 |
| TC (mg/dl) |
170.5 |
24.44 |
126 |
224 |
179.0 |
32.11 |
123 |
247 |
194.0 |
35.27 |
140 |
315 |
202.4 |
27.59 |
161 |
283 |
<0.001 |
| TC≧220 (n (%])
|
1 (3%) |
|
|
|
4 (17%) |
|
|
|
8 (20%) |
|
|
|
6 (22%) |
|
|
|
0.04 |
| Women |
age |
27.2 |
5.75 |
19 |
38 |
26.9 |
5.84 |
18 |
36 |
26.9 |
5.72 |
19 |
38 |
28.1 |
6.07 |
18 |
37 |
0.55 |
| hight (cm) |
158.1 |
6.33 |
145 |
169.8 |
157.8 |
5.38 |
142.1 |
168.3 |
157.5 |
4.83 |
148 |
167.1 |
159.0 |
7.34 |
144.9 |
171.9 |
0.86 |
| weight (kg) |
53.6 |
9.28 |
39.7 |
78.9 |
51.3 |
8.26 |
37.9 |
78.6 |
54.7 |
12.33 |
41.6 |
90.1 |
54.7 |
9.96 |
39.9 |
78.3 |
0.49 |
| BMI§
|
21.5 |
3.74 |
16.8 |
30.4 |
20.6 |
3.14 |
15.7 |
28.1 |
22.0 |
4.86 |
16.8 |
36.3 |
21.6 |
3.29 |
16.3 |
30.6 |
0.39 |
| TC (mg/dl) |
163.2 |
23.76 |
123 |
231 |
168.5 |
19.36 |
118 |
220 |
174.9 |
22.04 |
138 |
228 |
197.0 |
26.54 |
153 |
258 |
<0.001 |
| TC≧220 (n (%])
|
1 (3%) |
|
|
|
1 (3%) |
|
|
|
1 (5%) |
|
|
|
6 (20%) |
|
|
|
0.01 |
Abbreviations: BMI, Body Mass Index; SD, Standard Deviation; TC, Total Cholesterol
§BMI is weight (kg)/height (m)2
Discussion
This study observed TC trajectories during 9 years from the first grade to the ninth grade of Japanese children to demonstrate how TC levels changed every year in the same child. To our knowledge, this is the first study that investigated individual tracking of TC and showed it by figures. As a result, the high TC quartile 1 remained high, and low TC quartile1 also remained unchanged in 9 years.
The trajectory of TC level for 9 years for boys was highest in the fifth grade, and then declined up to the ninth grade. The TC level for girls remained unchanged from the first to the fourth grade, but started declining thereafter, reaching the lowest level in the seventh grade. After that it started to increase. Our study revealed that trajectories for boys and girls were different in shape. These trajectories were in line with the earlier cross-sectional study in Japan, which included children and adolescents (from the first grade to the twelfth grade [the third grade of high school])
9)
. The previous longitudinal study also showed cholesterol levels decreased as secondary sexual characteristics progressed
10)
. This may be due to the production of sexual hormones in secondary sexual characteristic development
11)
.
The current study showed tracking of TC level from the first grade until the ninth grade by mixed effect model, and the group with high TC (the fourth quartile1) had higher TC level and higher percentage of TC≧220 mg/dl in adulthood. Previous studies showed moderately high correlation between the TC level at several discrete points throughout childhood and adulthood
12-
14)
. One study, targeting children in the second and the fourth grade of primary school (8 and 10 years old) in Japan, showed that correlation for TC between baseline and 4 years later was 0.66 for boys and 0.59 for girls
12)
. A community-based prospective cohort study on Kangsha island in Korea reported a moderately high correlation in spaced six-time measurements of TC (at age of 12, 14, 16, 25, 30 and 35) with correlation coefficients of 0.38 to 0.69
13)
. The correlation coefficients in our study were similar to those of previous studies (
Supplementary Table 3)
. Additionally, tracking of TC level in infancy, as reported by Freedman et al., indicated that serum lipid levels at the age of 7 years were associated with previously measured levels, as early as 6 months of age
15)
. The TC level might be tracked throughout the first year of life to childhood, adolescence, and adulthood.
Supplementary Table 3.
Spearman Correlation Coefficients between TC level at each grade and adulthood by sex
| Sex |
|
2nd |
3rd |
4th |
5th |
6th |
7th |
8th |
9th |
adulthood |
| Boy§
|
1st |
0.76 |
0.73 |
0.70 |
0.70 |
0.68 |
0.64 |
0.65 |
0.63 |
0.39 |
| 2nd |
|
0.78 |
0.75 |
0.73 |
0.71 |
0.68 |
0.68 |
0.67 |
0.41 |
| 3rd |
|
|
0.77 |
0.74 |
0.71 |
0.68 |
0.68 |
0.68 |
0.48 |
| 4th |
|
|
|
0.76 |
0.72 |
0.70 |
0.68 |
0.65 |
0.36 |
| 5th |
|
|
|
|
0.76 |
0.71 |
0.68 |
0.68 |
0.38 |
| 6th |
|
|
|
|
|
0.77 |
0.72 |
0.70 |
0.37 |
| 7th |
|
|
|
|
|
|
0.78 |
0.70 |
0.42 |
| 8th |
|
|
|
|
|
|
|
0.75 |
0.43 |
| 9th |
|
|
|
|
|
|
|
|
0.53 |
| Girl§
|
1st |
0.72 |
0.69 |
0.69 |
0.69 |
0.65 |
0.66 |
0.62 |
0.58 |
0.50 |
| 2nd |
|
0.73 |
0.73 |
0.70 |
0.67 |
0.68 |
0.67 |
0.63 |
0.45 |
| 3rd |
|
|
0.77 |
0.74 |
0.71 |
0.71 |
0.70 |
0.67 |
0.53 |
| 4th |
|
|
|
0.78 |
0.74 |
0.72 |
0.70 |
0.66 |
0.49 |
| 5th |
|
|
|
|
0.76 |
0.74 |
0.71 |
0.65 |
0.55 |
| 6th |
|
|
|
|
|
0.76 |
0.73 |
0.69 |
0.58 |
| 7th |
|
|
|
|
|
|
0.76 |
0.70 |
0.55 |
| 8th |
|
|
|
|
|
|
|
0.78 |
0.58 |
| 9th |
|
|
|
|
|
|
|
|
0.49 |
§All p value of correlation coefficients were <0.05
The current study showed the difference in serum lipid levels by admission groups. For girls, the most recent group (after 2000), specially for the sixth and the ninth grades, had a higher TC compared to the group of 1980s and 1990s. The result is similar with that of earlier studies reporting national trend of serum lipids in Japan
16,
17)
. It was reported that elevation of serum TC in Japan followed an increase in dietary fat intake
18)
. Since percentage of energy intake from fat to total energy intake is higher in Japanese women than in men
19)
, the recent trend of increased fat intake may affect serum TC levels more severely in girls.
We also found no association between BMI in the first grade and TC trajectories. This finding has been explained by several earlier studies. Sundaram et al reported that BMI in childhood was not independently related to LDLC in adulthood after adjusting by weight in adulthood
20)
. Juonala et al found that the risk of dyslipidemia in adulthood among children with overweight or obesity who became nonobese as adults were similar to those among persons who were never obese
21)
. A non-significant association was observed when examining the relationship between childhood adiposity and TC level in adulthood with adjusting for BMI in adulthood in the previous meta-analysis study
22)
. BMI at a tentative point in childhood might not be enough evidence to determine TC level in childhood or predict TC level in adulthood. Serum lipid levels are reported to be affected by number of gene and gene regions
23,
24)
and heredity
25-
27)
as well as lifestyle such as nutrition intake
28,
29)
and physical activities
30)
. According to the twin cohort study on those 9 to 16 years old in China, genetic factors were the more predominant contributor to the tracking of TC than environmental factors during childhood to adolescence
27)
. On the other hand, total and saturated fat intake at age 8 and 11 years was positively associated with increased TC
28)
. Additionally, there were relationships between serum lipid levels, plasma metabolite profile, and micronutrient status in one micronutrient study targeting children of 10 years
29)
. In the present study, it is difficult to discuss which is the most influential factor among genetic and environmental factors; and the appropriate intervention to reduce the TC level, and therefore further studies on this topic are needed.
Strengths and Limitations
Our study has certain strengths. To our knowledge, this is the first study to observe changes in TC level every year for 9 years from the same individuals in childhood. In the study area, the annual moving out rate according to National Census and Vital statistics after 2000 was as low as 3%. In fact, over 80% of children had no missing data on TC for 9 years. In addition, as medical check-ups are based on the School Health and Safety Act, every child underwent the same blood testing procedures that were carried out on the same day (one day in April every year). Further, we used a mixed effect model and tracked the transition of 9 years’ data from the same individual. This was an advantage of our study as compared to previous studies which examined the correlation of measured data at discrete points in time.
However, there were several limitations to this study. Firstly, children in our study are not representative of the Japanese population. Thus, the results of our study should be applied with caution to other populations. According to the report of Nagano Prefecture Health and Nutrition Survey 2016
31)
and National Health and Nutrition Survey 2016
32)
, the mean TC level of men in Nagano and that of Japan was the same, 196.3 mg/dl. In contrast, that of women in Nagano was 199.9 mg/dl and that of Japan was 207.6 mg/dl. Secondly, we did not have information regarding the children’s family history for hyperlipidemia in this study. Therefore, children with familial hyperlipidemia may not have been excluded. Thirdly, we could not show trajectories of LDLC in this study. Because the measurement of LDLC in Towns A and B started in 2008, we could not acquire enough data for LDLC. The non-HLDC and HDLC/TC tracking is shown in
Supplementary Fig.2
. Lastly, data for only a small proportion of the children could be merged with the adult data. Therefore, there might be a selection bias because linkage of data could only be performed for those who were living in same area since school age until adulthood. However, TC and BMI levels in childhood between people with adulthood TC data and without it were not different (data not shown). Moreover, adults with medication for hyperlipidemia did not exist in this study.

Conclusions
Our study showed that TC level was strongly tracked from childhood to adolescence for 9 years, and the group with a high TC level in childhood had a high TC level in adulthood among Japanese. Our findings suggest that maintaining appropriate TC level in childhood may be important for preventing future CAD.
Funding/Support
This work was supported by a grant-in-aid from the Ministry of Education, Culture, Sports, Science, and Technology (grant number 16K09076), Japan.
COI
None of the authors have any relevant conflicts of interest to disclose.
References
- 1) Verschuren WM, Jacobs DR, Bloemberg BP, Kromhout D, Menotti A, Aravanis C, Blackburn H, Buzina R, Dontas AS, Fidanza F, Karvonen MJ, Nedeljkovic S, Nissinen A, Toshima H. Serum total cholesterol and long-term coronary heart disease mortality in different cultures. Twenty-five year follow-up of the Seven Countries Study. JAMA, 1995; 274: 131-136
- 2) Clarke WR, Schrott HG, Leaverton PE, Connor WE, Lauer RM. Tracking of Blood Lipids and Blood Pressures in School Age Children: The Muscatine Study. Circulation, 1978; 58: 626-634
- 3) Lauer RM, Lee J, Clarke WR. Predicting adult cholesterol levels from measurements in childhood and adolescence: The Muscatine study. Bull N Y Acad Med, 1989; 65: 1127-1142
- 4) Porkka KVK, Viikari JSA, Taimela S, Dahl M, Akerblom HK. Tracking and predictiveness of serum lipid and lipoprotein measurement in childhood: A 12-year follow-up. The Cardiovascular Risk in Young Finns Study. Am J Epidemiol, 1994; 140: 1096-1110
- 5) Webber LS, Srinivasan SR, Wattigney WA, Berenson GS. Tracking of serum lipids and lipoproteins from childhood to adulthood. The Bogalusa Heart Study. Am J Epidemiol, 1991; 133: 884-899
- 6) Nguyen HN, Fujiyoshi A, Abott RD, Miura K. Epidemiology of Cardiovascular Risk Factors in Asian Countries. Circ J, 2013; 77: 2851-2859
- 7) NIH. Expert panel on integrated guidelines for cardiovascular health and risk reduction in children and adolescents: summary report. Pediatrics, 2011; 128: s213-256
- 8) Suzuki K, Sato M, Zheng W, Shinohara R, Yokomichi H, Yamagata Z. Childhood growth trajectories according to combinations of pregestational weight status and maternal smoking during pregnancy: a multilevel analysis. PLoS One, 2015; 10: e0118538
- 9) Okuni M, Hayashi K, Kiryu S, Yamauchi K. Risk factors of arteriosclerosis in Japanese children. Jpn Circ J, 1980; 44: 69-75
- 10) Eissa MA, Mihalopoulos NL, Holubkov R, Dai S, Labarthe DR. Changes in Fasting Lipids during Puberty. J Pediatr, 2016; 170: 199-205
- 11) Berenson GS, Srinivasan SR, Cresanta JL, Foster TA, Webber LS. Dynamic changes of serum lipoproteins in children during adolescence and sexual maturation. Am J Epidemiol, 1981; 113: 157-170
- 12) Tan F, Okamoto M, Suyama A, Miyamoto T. Tracking of cardiovascular risk factors and a cohorot study on hyperlipidemia in rural schoolchildren in Japan. J Epidemiol, 2000; 10: 255-261
- 13) Lee JH, Kim HC, Kang DR, Suh I. The 23-year tracking of blood lipids from adolescence to adulthood in Korea: the Kangwha study. Lipids Health Dis, 2017; 16: 221
- 14) Juhola J, Magnussen CG, Viikari JSA, Kähönen M, Hutri-Kähönen N, Jula A, Lehtimäki T, Åkerblom HK, Pietikäinen M, Laitinen T, Jokinen E, Taittonen L, Raitakari OT, Juonala M. Tracking of serum lipid levels, blood pressure, and body mass index from childhood to adulthood: the Cardiovascular Risk in Young Finns Study. J Pediatr, 2011; 159: 584-590
- 15) Freedman DS, Srinivasan SR, Cresanta JL, Webber LS, Berenson GS. Cardiovascular risk factors from birth to 7 Years of age: the Bogalusa Heart Study. Serum lipids and lipoproteins. Pediatrics, 1987; 80: 789-796
- 16) Ueshima H. Explanation for the Japanese paradox: prevention of increase in coronary heart disease and reduction in stroke. J Atheroscler Thromb, 2007; 14: 278-286
- 17) Okayama A, Ueshima H, Marmot MG, Nakamura M, Kita Y, Yamakawa M. Changes in total serum cholesterol and other risk factors for cardiovascular disease in Japan 1980-1989. Int J Epidemiol, 1993; 22: 1038-1047
- 18) Ueshima H,Iida M, Shimamoto T, Konishi M, Tanigaki M, Doi M, Nakanishi N, Takayama Y, Ozawa H, Komachi Y. Dietary intake and serum total cholesterol level: their relationship to different lifestyles in several Japanese populations. Circulation, 1982; 66: 519-526
- 19) Ministry of Health, Labour and Welfare. The National Health and Nutrition Survey in Japan, 2018. Tokyo, Japan; 2019 [In Japanese]
- 20) Sundaram ME, Berg RL, Economos C, Coleman LA. The relationship between childhood BMI and adult serum cholesterol, LDL, and ankle brachial index. Clin Med Res, 2014; 12: 33-39
- 21) Juonala M, Magnussen CG, Berenson GS, Venn A, Burns TL, Sabin MA, Srinvasan SR, Daniels SR, Davis PH, Chen W, Sun C, Cheung M, Vikari JSA, Dwyer T, Reitakari OT. Childhood adiposity, adult adiposity, and cardiovascular risk factors. N Engl J Med, 2011 Nov; 365: 1876-1885
- 22) Umer A, Kelley GA, Cottrell LE, Giacobbi P Jr, Innes KE, Lilly CL. Childhood obesity and adult cardiovascular disease risk factors: a systematic review with meta-analysis. BMC Public Health, 2017; 17: 683
- 23) Ma L, Yang J, Runesha HB, Tanaka T, Ferrucci L, Bandinelli S, Da Y. Genome-wide association analysis of total cholesterol and high-density lipoprotein cholesterol levels using the Framingham heart study data. BMC Med Genet, 2010; 11:55
- 24) Nakayama K, Bayasgalan T, Yamanaka K, Kumada M, Gotoh T, Utsumi N, Yanagisawa Y, Okayama M, Kajii E, Ishibashi S, Iwamoto S, Jichi Community Genetics Team (JCOG). Large scale replication analysis of loci associated with lipid concentrations in a Japanese population. J Med Genet, 2009; 46: 370-374
- 25) Middelberg RP, Martin NG, Whitfield JB. Longitudinal genetic analysis of plasma lipids. Twin Res Hum Genet, 2006; 9: 550-557
- 26) Middelberg RP, Martin NG, Whitfield JB. A longitudinal genetic study of plasma lipids in adolescent twins. Twin Res Hum Genet, 2007; 10: 127-135
- 27) Zhang S, Liu X, Necheles J, Tsai HJ, Wang G, Wang B, Xing H, Li Z, Liu X, Zang T, Xu X, Wang X. Genetic and environmental influences on serum lipid tracking: a population-based, longitudinal Chinese twin study. Pediatr Res, 2010; 68: 316-322
- 28) Nicklas TA, Dwyer J, Feldman HA, Luepker RV, Kelder SH, Nader PR. Serum cholesterol levels in children are associated with dietary fat and fatty acid intake. J Am Diet Assoc, 2002; 102: 511-517
- 29) Li KJ, Jenkins N, Luckasen G, Rao S, Ryan EP. Plasma metabolomics of children with aberrant serum lipids and inadequate micronutrient intake. PloS One, 2018; 13: e0205899
- 30) Aadland E, Kvalheim OM, Anderssen SA, Resaland GK, Andersen LB. The multivariate physical activity signature associated with metabolic health in children. Int J Behav Nutr Phys Act, 2018; 15: 77
- 31) Nagano Prefecture. The report of Nagano Prefectural Health and Nutrition Survey, 2016. Nagano, Japan; 2017 [in Japanese]
- 32) Ministry of Health, Labour and Welfare. The National Health and Nutrition Survey in Japan, 2016. Tokyo, Japan; 2017 [in Japanese]

