Abstract
Aim: Feedback activation of factor XI (FXI) by thrombin is believed to play a critical role in the amplification phase of thrombin generation and to contribute to thrombosis development and hemostasis. However, the activation of FXI by thrombin has been shown in vitro to require a cofactor. In this study, the role of thrombin in activated FXI (FXIa) formation in vivo is investigated.
Methods: The study population comprised probands in whom coagulation activation was triggered by low-dose (15 µg/kg) recombinant activated factor VII (rFVIIa, n=89), of whom 34 with (VTE+) and 45 without a history of venous thromboembolism (VTE−), and patients undergoing major orthopedic surgeries (n=45). FXIa was quantified via an enzyme capture assay using a monoclonal FXI-specific antibody. Thrombin formation was monitored using an oligonucleotide-based enzyme capture assay and the thrombin activation markers prothrombin fragment 1+2 (F1+2) and thrombin–antithrombin complex (TAT).
Results: In the rFVIIa cohort, FXIa and thrombin remained below their lower limit of quantification of 3.48 and 1.06 pmol/L, respectively. By contrast, during the surgeries, median FXIa levels increased from 3.69 pmol/L pre-operatively to 9.41 pmol/L mid-operatively (P=4·10−4) and remained significantly elevated 24 h thereafter, with 9.38 pmol/L (P=0.001). Peak levels of F1+2 were comparable in the VTE+, VTE−, and surgery cohort (235, 268, and 253 pmol/L), whereas peak TAT levels were higher in the surgery cohort (53.1, 33.9, and 147.6 pmol/L).
Conclusions: Under in vivo conditions, the activation of FXI requires specific local features that are present at the wounded site including potential cofactors of thrombin.
Introduction
Activated factor XI (FXIa) is the active serine protease of the zymogen factor XI (FXI), a homodimeric 160 kDa protein that circulates in human plasma at concentrations of 3–7 µg/mL (15–45 nM)
1-
3)
. The original cascade/waterfall model of coagulation proposed that FXI is converted to FXIa by activated factor XII (FXIIa) in the intrinsic pathway of coagulation, and the formed FXIa then promotes clotting by activating factor IX
4,
5)
. Although this mechanism of contact activation is used in diagnostic blood coagulation assays (e.g., activated partial thromboplastin time, aPTT), the absence of abnormal bleeding associated with hereditary deficiencies of factor XII (FXII) indicates that this is not an essential mechanism for physiological hemostasis
6,
7)
. However, there is growing evidence from animal models that the FXIIa-mediated activation of FXI contributes to the development of thrombosis
8-
11)
.
Unlike FXII deficiency, FXI deficiency (hemophilia C) is associated with a lifelong, albeit relatively mild, bleeding disorder, supporting the premise that FXI contributes to hemostasis independent from FXIIa
12,
13)
. It has been shown in vitro that thrombin can convert FXI to FXIa in the presence of dextran sulfate
14)
, polyphosphate
15-
17)
, and other negatively charged substances through a template mechanism in which FXIa and thrombin bind on a polyanion in proximity to each other to achieve maximum rates of FXI activation
3)
. Based on these results, a positive feedback mechanism that amplifies thrombin formation after FXIa has been generated via trace amounts of thrombin is assumed
14)
. Furthermore, FXIa indirectly protects the clot from lysis through the activation of thrombin-activatable fibrinolysis inhibitor via thrombin by amplifying thrombin generation
18,
19)
. However, the identity of the protease that activates FXI in vivo has not been established so far
3)
.
Recent evidence that suggests that the contact pathway may play a significant role in the development of thrombosis via thrombus stabilization and growth promotion has led to the investigation of FXI and FXIa as potential new drug targets to achieve safer anticoagulation
20,
21)
. Novel pharmacologic strategies that target FXI and FXIa include antisense oligonucleotides and monoclonal antibodies, which act by blocking the activation or activity of the coagulation factor, and aptamers and small molecules that block the active site or induce allosteric modulation of the protein
22,
23)
.
Aim
In this study, the role of the thrombin–FXIa feedback loop is further investigated by studying the relationship between thrombin generation and the amount of circulating FXIa in two different clinical scenarios of hemostasis activation. In the first clinical model, systemic thrombin formation was induced via the administration of low-dose recombinant activated factor VII (rFVIIa) to healthy volunteers and patients with thrombophilic risk factors. We have recently shown, using this stimulated hemostasis activity pattern evaluation (SHAPE) approach, different patterns of procoagulant and anticoagulant responses depending on the presence of hereditary thrombophilia risk factors and the patients’ history of venous thromboembolism (VTE)
24,
25)
. The second cohort comprised patients undergoing elective orthopedic surgeries. The surgical trauma induces localized but high-level thrombin formation as has been recently demonstrated
26)
. In both clinical models, FXIa plasma levels were measured using a newly established enzyme capture assay (ECA) and correlated with the in vivo thrombin generation kinetics.
Methods
Reagents and Materials
Human FXIa, corn trypsin inhibitor (CTI), the monoclonal anti-human FXI antibody AHXI-5061, and the polyclonal sheep anti-human FXI antibody PAHFXI-SAP were obtained from Haematologic Technologies (Essex Junction, VT, USA). The horseradish peroxidase-conjugated polyclonal rabbit anti-sheep antibody PO163 HRO was purchased from Dako (Glostrup, Denmark). Human α-thrombin was purchased from CellSystems (St. Katharinen, Germany). Argatroban (Argatra®) was obtained from Mitsubishi Pharma (Düsseldorf, Germany). The fluorogenic thrombin (Boc-Asp(OBzl)-Pro-Arg-AMC) and FXIa (Boc-Glu(OBzl)-Ala-Arg-AMC) peptide substrates were obtained from Bachem (Bubendorf, Switzerland). rFVIIa (NovoSeven®) was purchased from Novo Nordisk (Bagsværd, Denmark). Benzamidine, dextran sulfate sodium salt, and general chemicals were purchased from Sigma-Aldrich (Munich, Germany). Biotinylated aptamers were synthesized and purified from Microsynth (Balgach, Switzerland). Platelet-rich plasma (PRP) for in vitro thrombin generation experiments and platelet-poor normal pooled plasma (NPP) were prepared by mixing equal volumes of citrated plasma obtained from healthy donors. Citrate tubes (10.5 mmol/L final concentration, Sarstedt) additionally contained CTI (20 µg/mL final concentration) for thrombin generation experiments. PRP and platelet-poor plasma (PPP) were obtained via centrifugation (1,500×g, 2 min, and 2,600×g, 10 min, respectively) of citrated whole blood. PPP was used to dilute PRP to obtain 150,000 platelets/µL.
FXIa ECA
The FXIa ECA was conducted in the microtiter plate format using white Maxisorp Fluoronunc microtiter modules (Nunc A/S, Roskilde, Denmark). Wells were sealed during incubation times with adhesive polyester film (Platemax®, Axygen, Union City, CA, USA) and stored in the dark. For washing, wells were generally rinsed three times with 300 µL of washing buffer (phosphate-buffered saline (PBS), 0.05% Tween 20, pH 7.4) using an automated plate washer (ELx50, Biotek, Bad Friedrichshall, Germany). Wells were initially coated with 4 µg/mL of the mouse monoclonal anti-FXI-antibody AHXI-5061 in a coating buffer (30 mmol/L Na2CO2, 200 mmol/L NaHCO3, pH 9.0). After incubation at 4℃ overnight, wells were washed, subsequently blocked (PBS, 20 mg/mL (bovine serum albumin (BSA), pH 7.4), and emptied plates stored at −20℃ until used. For running the assay, samples and calibrators were added to the wells (100 µL). Plasma-based calibration curves covering a concentration range from 0 to 20 ng/mL FXIa (0–125 pmol/L) were processed in parallel. After incubation for 2 h at room temperature, samples and calibrators were removed from the wells using an eight-channel pipette and fresh tips for each column to prevent carry-over contamination during automated washing. Then, 250 µL of PBS washing buffer was manually added to the wells, and the modules were washed using the automated procedure. Subsequently, 100 µL of the fluorogenic FXIa substrate solution (100 µmol/L) was added to the wells, and baseline fluorescence intensities were measured using a plate fluorescence reader (FLx-800, Bio-Tek, Bad Friedrichshall, Germany). Changes in fluorescence over time were taken as the measure of FXIa captured in the wells. Data obtained from the calibrators were interpolated using a four-parameter curve fit and utilized to calculate the FXIa concentration in the samples. All samples were assayed in triplicate. If not otherwise stated, plasma samples were tested at a dilution of 1:10, at which the inactive zymogen FXI did not affect FXIa measurement. PBS containing 1 mg/mL BSA, 100 mmol/L benzamidine, and 25 mmol/L sodium citrate was used as a dilution buffer. The supplemental data describe thoroughly the development of the basic assay configuration, preanalytical stability, and assay performance studies.
In Vitro Monitoring of FXIa Generation
FXI deficient plasma was obtained from seven hemophilia C patients.
Supplemental Table 1
lists the patient characteristics and underlying mutations for FXI deficiency. Experiments with thrombin were conducted using plasma that had been defibrinated by reptilase (1:10) for 1 h at 37℃. A solution that contains thrombin and dextran sulfate was added (1:5) to achieve final concentrations of thrombin of 5 µg/mL (136 nmol/L) or 500 ng/mL (13.6 nmol/L) and of dextran sulfate of 5 µg/mL in the reaction mixture in order to initiate thrombin-induced FXIa generation. FXIa generation via contact activation was initiated in citrated plasma by adding aPTT reagent (Actin FS, Siemens Healthcare Diagnostics, Marburg, Germany) in a dilution of 1:5 without recalcification, thereby excluding a contribution of thrombin to FXIa generation. At pre-defined intervals, aliquots were removed from the reaction mixture, and FXIa generation was stopped by mixing them with equal volumes of PBS (pH 7.4) containing 1 mg/mL BSA, 200 mmol/L benzamidine, and 50 mmol/L sodium citrate. This mixture was further diluted 1:4 in dilution buffer to achieve the 1:10 dilution of citrated plasma required for FXIa measurement.
Supplemental Table 1.
Characteristics of patients with hereditary FXI deficiency
| No. |
FXI, % |
Age, years |
Sex |
F11 gene mutation |
Protein change |
| 1 |
8 |
28 |
M |
c.[1443delT];[901T> C] |
p.Ile481Metfs*4;Phe301Leu
|
| 2 |
52 |
55 |
M |
c.[976C> T];[ = ] |
p.Arg326Cys |
| 3 |
63 |
27 |
F |
c.[41C> T];[ = ] |
p.Thr14Ile |
| 4 |
51 |
46 |
M |
c.[943G> A];[ = ] |
p.Glu315Lys |
| 5 |
36 |
9 |
F |
c.[943G> A];[ = ] |
p.Glu315Lys |
| 6 |
45 |
9 |
F |
c.[943G> A];[ = ] |
p.Glu315Lys |
| 7 |
39 |
59 |
F |
c.[1489C> T];[ = ] |
p.Arg497*
|
For western blot analysis, reaction mixtures of FXI, thrombin, and dextran sulfate were incubated at 37℃ in PBS buffer for 10 min before adding benzamidine (100 mmol/L final concentration). Samples were subjected to reduced sodium dodecyl sulfate–polyacrylamide gel electrophoresis and blotted onto a polyvinylidene difluoride membrane. FXI and FXIa were detected using the polyclonal sheep anti-human FXI antibody PAHFXI-SAP and horseradish peroxidase-conjugated secondary antibody PO163 HRO in combination with a chemiluminescence-based detection kit (Millipore Immobilon, Merck, Darmstadt, Germany).
In Vitro Thrombin Generation
All in vitro thrombin generation experiments were conducted in PRP, and measurements were conducted as described elsewhere
27,
28)
: Thrombin generation was monitored using the calibrated automated thrombogram (CAT) assay using standard reagents (Thrombinoscope, Maastricht, NL), with the modification of using rFVIIa instead of tissue factor (TF) to initiate thrombin generation. Thrombin generation curves were described in terms of lag time (time until the first measurement of a thrombin concentration above baseline), time-to-peak thrombin concentration, peak thrombin concentration, and area under the curve (AUC) (endogenous thrombin potential, ETP).
Study Population and Blood Sampling
The VTE- subgroup included healthy blood donors (Factor V Leiden (FVL) and prothrombin (FII) 20210G>A non-carriers) and carriers of the FVL or FII 20210G>A mutations, who were prospectively recruited from our blood donation service and the thrombophilia outpatient clinic of our institution, respectively. The subjects in the VTE+ subgroup were also recruited from the thrombophilia outpatient clinic.
Table 1
shows the details on recruitment, inclusion/exclusion criteria, laboratory screening tests, and drop-outs. After an overnight fast, a bolus of 15 µg/kg rFVIIa was injected intravenously. Blood samples were obtained immediately before and 10 min, 30 min, and 1, 2, 3, 5, and 8 h after rFVIIa administration from a new venipuncture of an antecubital vein using 21-gauge winged infusion sets (Sarstedt, Nümbrecht, Germany).
Table 1.
Recruitment and inclusion/exclusion criteria in the SHAPE cohort
|
Subgroup
(subjects in per protocol population)
|
VTE- (n = 15)
|
VTE- (n = 30)
|
VTE+ (n = 34)
|
| Source of recruitment |
Healthy blood donors |
Patients of thrombophilia outpatient clinic |
|
| Inclusion criteria |
Body mass index 18-27 kg/m² and adequate peripheral vein status
|
|
|
|
|
|
History of VTE†
|
| Exclusion criteria |
Antiplatelet or anticoagulant drugs within 2 weeks preceding blood sampling, arterial cardiovascular or malignant diseases, acute or chronic infections, pregnancy and breast feeding |
|
|
| Screening tests required to be negative |
Transaminases, γ-glutamyl transferase, urea, creatinine in serum, tests for deficiencies of antithrombin, protein C, protein S‡
|
|
|
| Drop-outs, n§
|
8 |
3 |
0 |
VTE-, no history of venous thromboembolism; VTE+, history of venous thromboembolism.
†Additional inclusion criteria in the VTE+ group were, that the VTE occurred at least 6 months ago and in the absence of situational high-risk
factors (surgery, trauma, immobilization, pregnancy, puerperium).
‡Healthy blood donors were additionally screened for the factor V Leiden and prothrombin 20210G> A mutation, and were required to be non-
carriers, while the mutation carrier status of the outpatients was already known at inclusion.
§Three VTE- healthy volunteers and 3 VTE- factor V Leiden or prothrombin 20210G> A mutation carriers were excluded due to abnormalities in the laboratory screening, 5 VTE- healthy volunteers withdrew consent before administration of recombinant activated factor VII (rFVIIa). All remaining 79 included subjects completed administration of rFVIIa and follow-up blood sampling.
The surgery cohort included patients undergoing elective orthopedic surgery and has been described in a previous report
26)
. Blood samples were obtained 2 h before and 24 h after surgery from a new venipuncture of an antecubital vein using 21-gauge winged infusion sets (Sarstedt, Nümbrecht, Germany). During the surgeries, samples were obtained from a 21-gauge indwelling venous cannula (B. Braun, Melsungen, Germany), maintained patent by continuous infusion of physiological sodium chloride solution, at the incision and final suture of the skin and at the middle of the surgeries. All patients received 40 mg enoxaparin subcutaneously 4–8 h post-operatively.
In both cohorts, blood was drawn into citrate tubes (10.5 mmol/L final concentration, Sarstedt) that additionally contained argatroban (100 µmol/L final concentration) for thrombin measurement and benzamidine (50 mmol/L final concentration) for FXIa measurement. Plasma samples were obtained by centrifugation (2,600×g, 10 min) and subsequently stored at less than −40℃.
In Vivo Coagulation Monitoring
FXIa in plasma was quantified by ECA as described above. Thrombin was measured using an oligonucleotide-based enzyme capture assay (OECA) that has been initially described by Müller et al.
29)
and applied in other studies
25,
26,
30-
32)
. Briefly, Maxisorp Fluoronunc microtiter modules were initially coated with 10 µg/mL of BSA (100 µl/well). After incubation at 4℃ overnight, wells were washed, and a solution of 10 µg/mL streptavidin was added and incubated for 1 h at room temperature. Subsequently, wells were washed, blocked with 2% BSA for 2 h at room temperature, and emptied plates stored at −20℃ until used. For running the thrombin–OECA, 1 pmol 3’-biotinylated aptamers HD1-22 was located in the wells (100 µl/well). After washing, plasma samples and calibrators, which covered a 1/2-log10 concentration range from 0 to 10 ng/mL (0–272 pmol/L) thrombin, were added to the designated wells. After incubation and washing, the fluorogenic thrombin substrate was added. Changes in fluorescence over time were taken as the measure of thrombin captured in the wells. Data obtained from the calibrators were interpolated by a four-parameter curve fit and used to calculate the thrombin concentration in the samples. All samples were assayed in triplicate.
The STACLOT VIIa-rTF assay (Stago, Asnières sur Seine, France) was used to determine the plasma concentration of activated factor VII (FVIIa). Plasma levels of prothrombin fragment 1+2 (F1+2) and thrombin–antithrombin complex (TAT) were determined using the Enzygnost F1+2 (monoclonal) assay and the TAT microassay, respectively (both Siemens Healthcare Diagnostics Products, Marburg, Germany). The activity levels of prothrombin, factor VII (FVII), FXI, protein C (PC), antithrombin (AT), and the plasma concentration of d-dimer were determined using the BCS XP system (Siemens Healthcare Diagnostics, Eschborn, Germany) together using corresponding reagents and controls.
In the VTE− subjects of the SHAPE cohort, who were recruited from healthy blood donors (
Table 1)
, only FXIa and thrombin were newly measured, whereas the measurement results of the other laboratory parameters had been obtained and reported previously
25)
. In all other subjects of the SHAPE cohort, who were recruited from thrombophilia outpatients (VTE− and VTE+), all laboratory data were newly obtained. In the surgery cohort, all laboratory measurement results had been obtained and reported previously
26)
, except for the FXIa concentration in plasma, which was newly measured.
Statistics
In vitro data are generally presented as mean and standard deviation. Data obtained from the study population are presented as the median and interquartile range (IQR). Depending on the distribution of data, an analysis of variance or a Kruskal–Wallis test was conducted, followed by an unpaired Student t-test or Mann–Whitney test, to compare the data obtained in the two subgroups of probands with and without a history of VTE in the SHAPE cohort. The Wilcoxon signed-rank test was used to compare values measured at different sampling time points in both the surgery cohort and the SHAPE cohort. The Bonferroni method was applied to correct for multiple testing. H.R. analyzed the data. All coauthors had access to primary data.
Ethics Statement
The Institutional Review Board and Ethics committee of the University Hospital of Bonn approved the present study. All study participants provided written informed consent in accordance with the Declaration of Helsinki.
Results
In Vitro Monitoring of FXIa Generation Induced by Thrombin or Contact Activation
In a first series of experiments, we evaluated the ability of the FXIa ECA to monitor FXIa generation induced by thrombin or through the contact system in vitro. Western blot analysis revealed that thrombin requires a cofactor such as dextran sulfate to become an effective FXI activator (
Fig.1A)
. Evaluation of different concentrations of the cofactor dextran sulfate of up to 100 µg/mL demonstrated that the highest amount of FXIa was generated, if FXI, thrombin, and dextran sulfate were applied in equal concentrations of 100 ng/mL in the reaction mixture (
Fig.1B)
. The application of both higher and lower concentrations of dextran sulfate induced the generation of smaller amounts of FXIa in plasma. We applied thrombin and dextran sulfate at final concentrations of 5 µg/mL each to induce FXIa generation in citrated plasma assuming an FXI concentration in normal human plasma of approximately 5 µg/mL. Control experiments were conducted with defibrinated NPP that contained the contact phase inhibitor CTI at a concentration of 100 µg/mL to exclude contact activation of FXI in this design. Vice versa the thrombin inhibitor argatroban was added at a final concentration of 190 µmol/L to specifically inhibit thrombin-induced FXI activation. FXIa formation was completely abolished in the presence of argatroban whereas the inhibition of contact activation had no effect on FXIa generation over time (
Fig.1B-C)
.
Fig.1D
shows typical FXIa generation curves, induced by different concentrations of thrombin in the presence of dextran sulfate. The AUC was 5.7±0.9 nmol·min·L−1 when a thrombin concentration of 5 µg/mL (136 nmol/L) and a concentration of dextran sulfate of 5 µg/mL were applied. With 270.5±45.9 nmol·min·L−1, an approximately 50-fold greater AUC was obtained by the contact activation of FXI (
Fig.1E)
. Plasma samples of seven patients with hereditary FXI deficiency and FXI levels ranging between 8% and 63% were analyzed to study the dose–response relationship between FXI and FXIa formation.
Fig.1F
shows that there was a strong linear correlation between AUC and FXI level for thrombin-induced FXI activation (r=0.982) and contact activation (r=0.968).

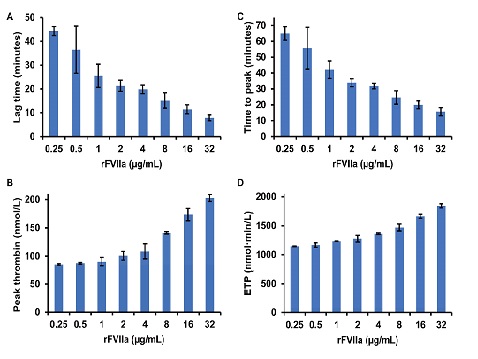
In Vitro Thrombin Generation Induced by rFVIIa
In vitro thrombin generation was induced by different concentrations of rFVIIa, ranging from 0.25 to 32 µg/mL, and monitored via CAT to study if a rFVIIa dose of 15 µg/kg induced the formation of a sufficiently high amount of thrombin to potentially generate FXIa in vivo. The concentration of rFVIIa of 0.25 µg/mL corresponded to plasma levels of rFVIIa that were observed in probands 10 min after the administration of a rFVIIa dose of 15 µg/kg
24,
25)
. With increasing doses of rFVIIa, the mean lag time shortened from 44 min for 250 ng/mL rFVIIa to 8 min for 32 µg/mL rFVIIa (
Fig.2A)
, the peak thrombin concentration increased from 85 to 203 nmol/L (
Fig.2B)
, the ETP increased from 1,144 to 1,842 nmol·min·L−1 (
Fig.2C)
, and the time to peak shortened from 65 to 16 min (
Fig.2D)
. Thus, applying a rFVIIa dose of 15 µg/kg, a peak thrombin concentration that had been shown to induce the generation of quantifiable amounts of FXIa in the presence of dextran sulfate in vitro was achieved (
Fig.1D)
.
The SHAPE cohort comprised 79 subjects, thereof 34 with (VTE+) and 45 without a history of VTE (VTE−). The surgery cohort included 35 patients without a history of VTE. Surgical procedures included nucleotomy (n=13), arthroscopic intervention (n=8), osteosynthesis (n=5), implant removal (n=5), and total hip arthroplasty (n=4), Age, body mass index (BMI), and proportion of males were higher in the surgery patients than in the SHAPE group, but they were similar in the VTE− and VTE+ subgroups of the SHAPE cohort (
Table 2)
. In the SHAPE cohort, 67% of the VTE− subjects and 62% of the VTE+ subjects were carriers of either the FVL or the prothrombin 20210G>A mutation, whereas the patients in the surgery cohort were not tested for the presence of these mutations.
Table 2.
Characteristics of the study population
|
Surgery, n = 35
|
SHAPE |
| VTE-, n = 45
|
VTE+, n = 34
|
| Age, years |
50±17 |
36±12 |
39±12 |
| Sex (male/female), n
|
21/14 |
15/30 |
12/22 |
| BMI, kg/m2
|
26.4±2.6 |
22.5±3.0 |
24.1±2.0 |
| FVL carriers, n
|
ND |
17 (3†)
|
9 (1) |
| FII 20210G> A carriers, n
|
ND |
13 (2†)
|
12 |
Data for age and body mass index (BMI) are presented as mean and standard deviation. FII, prothrombin; ND, not determined; VTE-, no history of venous thromboembolism; VTE+, history of venous thromboembolism; SHAPE, stimulated hemostasis activity pattern evaluation.
†thereof homozygous carriers.
The activity levels of prothrombin, FVII, FXI, PC, and AT were within normal ranges in all study participants.
Table 3
summarizes the results of hemostasis activity markers measured at baseline. Median FXIa levels in the SHAPE cohort and thrombin levels in all cohorts were below quantifiable ranges. With 3.69 pmol/L FXIa median plasma levels of FXIa slightly above the lower limit of quantification of 3.48 pmol/L in the surgery cohort. The median plasma levels of the activation markers of coagulation were below the established upper normal limits of F1+2 (340 pmol/L), TAT (41.5 pmol/L), and d-dimer (0.5 mg/L) in all cohorts.
Table 3.
Hemostasis biomarker changes induced during surgery or by rFVIIa
| Cohort, subjects |
Reference data
n = 15†
|
Pre- vs. mid-operative plasma levels Surgery,
n = 35
|
SHAPE baseline vs. peak plasma levels |
| SHAPE VTE-, n = 45
|
SHAPE VTE+, n = 34
|
| FXIa, pmol/L |
<3.48 (<3.48 - <3.48) |
3.69 (<3.48 - 9.25) vs. |
<3.48 (<3.48 - <3.48) vs. |
<3.48 (<3.48 - 3.62) vs. |
|
|
9.41 (5.47 - 15.94)**
|
<3.48 (<3.48 - 4.49) |
<3.48 (<3.48 - 3.67) |
| F1+2, pmol/L |
168 (106 – 225) |
144 (118 - 171) vs. |
171 (127 - 216) vs. |
200 (126 - 293) vs. |
|
|
253 (183 - 357) **
|
235 (182 - 303) **
|
268 (198 - 355) **
|
| Thrombin, pmol/L |
<1.06 (<1.06 - <1.06) |
<1.06 (<1.06 - 1.17) vs. |
<1.06 (<1.06 - <1.06) vs. |
<1.06 (<1.06 - <1.06) vs. |
|
|
9.96 (4.39 - 30.68) **
|
<1.06 (<1.06 - 1.14) |
<1.06 (<1.06 - 1.21) |
| TAT, pmol/L |
<21.3 (<21.3 - <21.3) |
33.5 (24.4 - 48.1) vs. |
<21.3 (<21.3 - 25.7) vs. |
<21.3 (<21.3 - 29.5) vs. |
|
|
147.6 (78.5 - 266.8) **
|
33.9 (23.0 - 54.6) **
|
53.1 (35.1 - 74.8) **
|
| d-dimer, mg/L |
0.29 (0.24 – 0.34) |
0.36 (0.29 - 0.68) vs. |
0.29 (0.22 - 0.39) vs. |
0.34 (0.26 - 0.49) vs. |
|
|
0.58 (0.32 - 1.13) |
0.36 (0.26 - 0.48) *
|
0.41 (0.31 - 0.52) *
|
Data are presented as median and interquartile range. The Wilcoxon signed-rank test was used to compare values measured at different sampling time points, and statistically significant differences in comparison to baseline are denoted by *(P<0.05) and **(P<0.005).
VTE-, no history of venous thromboembolism; VTE+, history of venous thromboembolism; SHAPE, stimulated hemostasis activity pattern evaluation.
†Reference data were obtained from a cohort of 15 healthy volunteers, that has been described in a previous publication, in which the shown measurement results of F1+2, TAT, and d-dimer have been reported
25).
The application of rFVIIa was well tolerated by all subjects, and no adverse events of any kind were encountered during the observation period. The pharmacokinetic profiles of rFVIIa were essentially identical in study participants with and without a history of VTE with median (IQR) peak levels of FVIIa of 0.23 (0.19–0.26) µg/mL and 0.22 (0.16–0.28) µg/mL, respectively (
Supplemental Fig.6)
.

Fig.3
shows the courses of thrombin generation rates and plasma levels of FXIa in response to low-dose rFVIIa, and
Table 3
lists peak plasma levels. Median plasma levels of F1+2 increased from 171 pmol/L at baseline to peak levels of 235 pmol/L in study participants without a history of VTE and from 200 to 268 pmol/L in the VTE+ subgroup (
Fig.3A)
, and median TAT levels increased from <21.3 to 33.9 pmol/L in VTE− subjects and from <21.3 to 53.1 pmol/L in the VTE+ subgroup (P<10−4 each) (
Fig.3B)
. The intervals between baseline and peak levels of TAT (but not of F1+2) were significantly greater in subjects with a history of VTE than in those without (P=0.010). Despite this increase of indirect markers of thrombin formation, median plasma levels of thrombin and FXIa remained unchanged and below their respective quantifiable limits after administration of rFVIIa (
Fig.3C)
. After rFVIIa administration, a slight but statistically significant increase of d-dimer levels was observed, from 0.29 to 0.36 mg/L ( P=0.021) in the VTE− subgroup and from 0.34 to 0.41 mg/L ( P=0.028) in the VTE+ subgroup (
Fig.3D)
.

Surgical trauma-induced coagulation activation was characterized by a rapid and long-lasting increase of FXIa levels. With 7.75 (3.48–10.59) pmol/L, FXIa levels were higher at the time of incision than at baseline, but the difference was statistically not significant (
Fig.4)
. During the surgeries and at the time of suture, FXIa levels increased further and were significantly higher in comparison with baseline, with 9.41 (5.47–15.94) pmol/L (P=0.001) and 10.13 (5.47–15.41) pmol/L (P=0.009), respectively. With 9.38 (5.28–9.38) pmol/L, they remained significantly elevated at 24 h after the surgeries (P=0.001). Spearman analysis revealed a significant and positive correlation between FXIa and the other hemostasis biomarkers that was strong for TAT (rs=0.794, P<10−6), moderate for F1+2 (rs=0.649, P=2·10−5) and thrombin (rs=0.604, P=2·10−4), and weak for d-dimer (rs=0.392, P=0.023) (
Fig.5)
.
Table 3
shows the median (IQR) plasma levels of these parameters and of FXIa during the surgeries in the overall cohort. In comparison with baseline, F1+2 increased from 144 to 253 pmol/L; thrombin, from <1.06 to 9.96 pmol/L; and TAT, from 33.5 to 147.6 pmol/L (P<10−4 each), whereas the changes in d-dimer levels did not reach statistical significance.

Discussion
The dynamics of FXIa and thrombin formation were monitored in parallel in a clinical model of low-level systemic thrombin formation and during surgical hemostasis to investigate the role of thrombin in the activation of FXI during in vivo hemostasis.
We established an ECA that allows sensitive and specific determination of FXIa to measure plasma levels of FXIa. With a lower limit of quantification of 3.48 pmol/L, the analytical sensitivity of the FXIa ECA is comparable with the sensitivity reported for a thrombin generation-based assay that uses an inhibitory anti-FXIa antibody to achieve FXIa specificity
33,
34)
. In contrast to the thrombin generation-based FXIa assay, the FXIa ECA allows the addition of benzamidine to prevent inhibition of FXIa by endogenous inhibitors and thereby improves the preanalytical stability of FXIa. We conducted initial experiments in a purified system to evaluate the practicability of the FXIa ECA for monitoring of FXIa formation. Mixing of plasma-purified FXI with thrombin did not result in a time- or concentration-dependent generation of FXIa as confirmed by FXIa ECA and western blot analysis. The formation of FXIa was initiated by adding dextran sulfate to the reaction mixture. Maximal FXI activation rates were achieved at equal concentrations of thrombin, FXI, and dextran sulfate. This finding is in line with previous reports showing that thrombin requires cofactors such as negatively charged macromolecules to become an efficient FXI activator
14-
17)
. However, even under optimized conditions, compared with contact phase-catalyzed FXI activation, the thrombin activation of FXI was on an approximately 50-fold lower level. The most probable explanation for this difference is that in the aPTT reagent approach, the activation of the contact phase induces a continuous and longer-lasting FXIa formation, whereas in the thrombin approach, the initially added thrombin is rapidly inactivated by endogenous inhibitors
30)
and is thus not able to induce further activation of FXI.
We measured plasma levels of FXIa after the induction of systemic thrombin formation through the administration of low-dose rFVIIa to study if in vivo thrombin formation can trigger FXIa activation. In in vitro thrombin generation experiments, the rFVIIa dose of 15 µg/kg, which was applied in the SHAPE approach, was shown to induce the generation of thrombin amounts that were sufficient to in turn induce the generation of quantifiable amounts of FXIa in the presence of the cofactor dextran sulfate. Although the SHAPE approach induced thrombin formation, as indicated by an increase of the thrombin markers F1+2 and TAT, an increase of the plasma concentration of free thrombin above the lower limit of quantification was not observed. This can be explained by the rapid inhibition of formed thrombin, predominantly by complex formation with antithrombin, as indicated by the observed increase of TAT levels. The marker of thrombin formation F1+2 and that of thrombin inactivation TAT have significantly longer plasma half-lives than that of free thrombin, with 2 h for F1+2 and 44 min for TAT
35)
, which additionally facilitates their detection. FXIa levels also remained below quantifiable limits. Even in the cohort of patients with a history of VTE, in whom the thrombin marker response to rFVIIa was significantly greater than in VTE− subjects, FXIa levels remained below this threshold. These data suggest that the higher thrombin response rates in VTE+ patients do not depend on the presence of significant amounts of FXIa.
The situation was different in the surgery cohort of our study. The median FXIa plasma level before surgery of 3.69 pmol/L was comparable with that obtained in a previous study through thrombin generation-based measurement of FXIa in healthy controls of 2.7 (IQR: 1.6–4.2) pmol/L
33)
. However, repeated measurements during and after surgery showed an increase of FXIa levels in plasma, which became statistically significant mid-operatively, reaching levels of 9.38–10.13 pmol/L. These data agree well with previous studies in which median FXIa levels of 5.7–6.8 pmol/L were measured in patients with injuries of varying severity without shock
36)
, and mean FXIa levels of 10.6 pmol/L were measured in patients after penetrating trauma
37)
, clinical situations comparable with surgical trauma. Besides the increase of FXIa levels, there was an increase of free thrombin and indirect markers of thrombin activation in the surgery cohort that has been described and discussed thoroughly in a previous report
26)
. In plasma samples obtained mid-operatively, FXIa concentrations correlated well with those of free thrombin, F1+2, and TAT, suggesting an association between formation rates of thrombin and FXIa. This represents further in vivo evidence for the role of thrombin as the physiological activator of FXI that has been suggested based on in vitro studies
14,
15,
38)
.
The difference in the FXIa response between the SHAPE cohort and the cohort of surgery patients can be explained by differences between the two cohorts including age, BMI, and female-to-male ratio that promote a higher basal level of coagulation activation in the surgery cohort. Most likely, however, the absence of quantifiable plasma levels of FXIa after administration of rFVIIa can be explained by the cofactor dependence of thrombin activation of FXI. Possible cofactors are polyphosphate released from activated platelets, RNA and DNA that are released from the damaged tissue, or, most importantly, TF that becomes exposed to blood because of the tissue damage caused by surgical procedures
15,
39-
41)
. However, there are alternative explanations on how local conditions at the surgery site could explain the observation of higher FXIa levels in comparison with the rFVIIa cohort. The local concentration of thrombin at the surgical wound could be high enough to surpass a threshold for generating quantifiable amounts of FXIa. This assumption is supported by higher levels of free thrombin and TAT in the surgery cohort. Further alternative explanations could be the presence of other proteases than thrombin at the wound site that could induce activation of FXI, or inhibitors of FXIa could be present at lower levels, thus resulting in higher levels of circulating FXIa.
The activity of FXIa in plasma is controlled by a variety of plasma serpins including antithrombin, C1-inhibitor, protease nexin 1, and protein Z-dependent protease inhibitor limiting its circulatory half-life to approximately 2.5 h
2,
33)
. Despite this strong inhibitory pressure, increased levels of FXIa were measured in the surgery cohort not only during but also 24 h after surgery. This indicates ongoing FXIa formation even after the formation of a wound-sealing clot. Moreover, it may indicate that FXIa contributes to the postoperative procoagulant state and supports an anticoagulant approach that targets FXIa
20,
42)
.
So far, two experimental drugs that follow this anticoagulant approach were studied in randomized phase II clinical trials in the indication of postoperative prophylaxis of VTE. The efficacy and safety of FXI-ASO (ISIS 416858), an antisense oligonucleotide that specifically reduces FXI levels, were compared with those of enoxaparin in patients undergoing knee arthroplasty
22)
. In this study, a regimen of 200 mg FXI-ASO was non-inferior to 40 mg of enoxaparin once daily, whereas a 300 mg regimen was superior, and FXI ASO appeared to be safe with respect to the risk of bleeding. In the FOXTROT study, osocimab, a monoclonal antibody against FXIa, was compared with enoxaparin in a study population of 813 patients undergoing knee arthroplasty
43)
. In this study, postoperative osocimab showed non-inferiority to enoxaparin, whereas preoperative osocimab was superior to enoxaparin regarding the incidence of VTE. Further studies are warranted to establish the efficacy and safety of these drugs relative to standard thromboprophylaxis.
Conclusion
The FXIa ECA used in this study represents an alternative to existing methods of FXIa measurement in plasma. The application of this assay to monitor the FXIa response during surgery showed a significant and long-lasting increase of FXIa plasma levels, whereas rFVIIa-induced thrombin formation was not associated with an FXIa increase. These in vivo data strengthen the hypothesis that thrombin-catalyzed activation of FXI requires a cofactor, thereby supporting in vitro data, although higher amounts of thrombin being generated during surgery might partly explain the discrepant FXIa responses. Further investigation is required to determine a potential cofactor since we did not measure platelet polyphosphate or other cofactor candidates.
Acknowledgements
This work was supported by a grant from the Stiftung Hämotherapie-Forschung (Hemotherapy Research Foundation).
Conflict of Interest
None.
SUPPLEMENTAL DATA
Supplemental Results
Basic Configuration of the FXIa ECA
The monoclonal anti-human factor XI antibody AHXI-5061 was incubated in the wells of microtiter modules, and unbound molecules were removed by washing, in order to evaluate different loading concentrations of the FXIa capture antibody. At different FXIa concentrations between 1 and 100 ng/mL, stable hydrolysis rates of the fluorogenic substrate were achieved at AHXI-5061 loading concentrations above 1 µg/mL (
Supplemental Fig.1)
. Based on these results, captured antibody loading concentrations of 4 µg/mL were utilized in all further experiments.

A quenching strategy using a reversible active site inhibitor is required to avoid the preanalytical inactivation of FXIa by endogenous inhibitors. The initial evaluation of different concentrations of benzamidine on FXIa activity in buffer showed that a benzamidine concentration of 100 mmol/L was high enough to temporarily block the active site of FXIa (
Supplemental Fig.2A)
without significant impairment of FXIa detection (
Supplemental Fig.2B)
. A final benzamidine concentration of 100 mmol/L was used in all further experiments.

Plasma samples with endogenous FXI levels ranging from 64% to 111% were spiked with benzamidine (100 mmol/L final concentration) and FXIa (4 ng/mL final concentration) to evaluate the influence of the zymogen FXI on FXIa measurement results. The ECA was conducted after the dilution of the preparations 1:4 and 1:10, respectively.
Supplemental Fig.3
shows that recovery rates of FXIa were not influenced by endogenous FXI levels at a dilution factor of 1:10. In another experiment, the comparison of recovery rates of an FXIa serial dilution series in FXI-deficient plasma and in NPP demonstrated that FXIa was detectable at each dilution point when diluted 1:4 and 1:10. Nevertheless, only the 1:10 diluted samples showed similar results within the analyzed sample matrices (
Supplemental Fig.4)
. Plasma samples were diluted 1:10 in all further experiments based on these results.
Preanalytical Stability
Correspondingly drawn whole blood was spiked with FXIa to achieve a final concentration of 10 ng/mL to evaluate the FXIa-stabilizing capacity of the benzamidine-citrate blood sampling buffer. Subsequently, the preparation was split and stored at room temperature or at 4℃. Aliquots were removed over time, centrifuged, and obtained plasma stored at −40℃ until the ECA was conducted. Testing of the FXIa quenching efficiency of the benzamidine-sodium citrate buffer in whole blood revealed that >95% of FXIa activity was preserved during 30 min of storage on ice. Storage at room temperature decreased the recovery rate to approximately 80%. In processed plasma, >95% of FXIa activity could be preserved during a storage time of 12 h on ice and 1 h at room temperature (
Supplemental Fig.5A)
. When plasma samples were immediately diluted 1:10 in dilution buffer, no loss of FXIa activity was observed even after a storing time of 48 h at room temperature (
Supplemental Fig.5B)
. These data demonstrated that FXIa activity was preserved in samples during processing and incubation times of the FXIa ECA.

Hexaplicates of NPP-based calibrators were measured, and the limit of detection (LOD) and the lower limit of quantification (LLOQ) were esteemed as the concentrations corresponding to changes in fluorescence of 3 and 9 times the standard deviation of the blanks, respectively, to determine the LOD and the LLOQ of FXIa. The determinations were repeated on different days and calculated mean values defined as the LOD and LLOQ of the assay. The LOD was determined as 0.931 pmol/L, whereas the LLOQ was calculated as 3.481 pmol/L. Plasma samples containing FXIa at concentrations ranging from 1 to 10 pmol/L were measured in triplicates in individual runs, repeated on three different days, to evaluate the reproducibility of the assay.
Supplemental Table 2
that within- and between-run coefficients of variation did not exceed 17% even at the lowest concentrations tested.
Supplemental Table 2.
Reproducibility of the FXIa ECA
| FXIa input concentration, pmol/L |
Mean within-run CV, %±SD |
Between-run CV, % |
| 10 |
5.6±2.3 |
8.5 |
| 2.5 |
12.2±8.6 |
13.8 |
| 1 |
11.0±6.7 |
17.1 |
CV, coefficient of variation; SD, standard deviation.
References
- 1) Seligsohn U: Factor XI in Haemostasis and Thrombosis: Past, Present and Future. Thromb Haemost, 2007; 98: 84-89
- 2) Emsley J, McEwan PA and Gailani D: Structure and function of factor XI. Blood, 2010; 115: 2569-2577
- 3) Mohammed BM, Matafonov A, Ivanov I, Sun MF, Cheng Q, Dickeson SK, Li C, Sun D, Verhamme IM, Emsley J and Gailani D: An update on factor XI structure and function. Thromb Res, 2018; 161: 94-105
- 4) Macfarlane RG: An enzyme cascade in the blood clotting mechanism, and its function as a biochemical amplifier. Nature, 1964; 202: 498-499
- 5) Davie EW and Ratnoff OD: Waterfall sequence for intrinsic blood clotting. Science, 1964; 145: 1310-1312
- 6) Naudin C, Burillo E, Blankenberg S, Butler L and Renné T: Factor XII Contact Activation. Semin Thromb Hemost, 2017; 43: 814-826
- 7) Maas C and Renné T: Coagulation factor XII in thrombosis and inflammation. Blood, 2018; 131: 1903-1909
- 8) Cheng Q, Tucker EI, Pine MS, Sisler I, Matafonov A, Sun MF, White-Adams TC, Smith SA, Hanson SR, McCarty OJ, Renné T, Gruber A and Gailani D: A role for factor XIIa-mediated factor XI activation in thrombus formation in vivo. Blood, 2010; 116: 1981-3989
- 9) Müller F, Mutch NJ, Schenk WA, Smith SA, Esterl L, Spronk HM, Schmidbauer S, Gahl WA, Morrissey JH and Renné T: Platelet polyphosphates are proinflammatory and procoagulant mediators in vivo. Cell, 2009; 139: 1143-1156
- 10) Kleinschnitz C, Stoll G, Bendszus M, Schuh K, Pauer HU, Burfeind P, Renné C, Gailani D, Nieswandt B and Renné T: Targeting coagulation factor XII provides protection from pathological thrombosis in cerebral ischemia without interfering with hemostasis. J Exp Med, 2006; 203: 513-518
- 11) Matafonov A, Leung PY, Gailani AE, Grach SL, Puy C, Cheng Q, Sun MF, McCarty OJ, Tucker EI, Kataoka H, Renné T, Morrissey JH, Gruber A and Gailani D: Factor XII inhibition reduces thrombus formation in a primate model. Blood, 2014; 123: 1739-1746
- 12) James P, Salomon O, Mikovic D and Peyvandi F: Rare bleeding disorders – bleeding assessment tools, laboratory aspects and phenotype and therapy of FXI deficiency. Haemophilia, 2014; 20 Suppl 4: 71-75
- 13) Wheeler AP and Gailani D: Why factor XI deficiency is a clinical concern. Expert Rev Hematol, 2016; 9: 629-637
- 14) Gailani D and Broze GJ Jr.: Factor XI activation in a revised model of blood coagulation. Science, 1991; 253: 909-912
- 15) Choi SH, Smith SA and Morrissey JH: Polyphosphate is a cofactor for the activation of factor XI by thrombin. Blood, 2011; 118: 6963-6970
- 16) Geng Y, Verhamme IM, Smith SB, Sun MF, Matafonov A, Cheng Q, Smith SA, Morrissey JH and Gailani D: The dimeric structure of factor XI and zymogen activation. Blood, 2013; 121: 3962-3969
- 17) Geng Y, Verhamme IM, Smith SA, Cheng Q, Sun M, Sheehan JP, Morrissey JH and Gailani D: Factor XI anion-binding sites are required for productive interactions with polyphosphate. J Thromb Haemost, 2013; 11: 2020-2028
- 18) von dem Borne PA, Meijers JC and Bouma BN: Feedback activation of factor XI by thrombin in plasma results in additional formation of thrombin that protects fibrin clots from fibrinolysis. Blood, 1995; 86: 3035-3042
- 19) von dem Borne PA, Cox LM and Bouma BN: Factor XI enhances fibrin generation and inhibits fibrinolysis in a coagulation model initiated by surface-coated tissue factor. Blood Coagul Fibrinolysis, 2006; 17: 251-257
- 20) Székely O, Borgi M and Lip GYH: Factor XI inhibition fulfilling the optimal expectations for ideal anticoagulation. Expert Opin Emerg Drugs, 2019; 24: 55-61
- 21) Weitz JI and Fredenburgh JC: Factors XI and XII as Targets for New Anticoagulants. Front Med (Lausanne), 2017; 4: 19
- 22) Büller HR, Bethune C, Bhanot S, Gailani D, Monia BP, Raskob GE, Segers A, Verhamme P and Weitz JI; FXI-ASO TKA Investigators: Factor XI antisense oligonucleotide for prevention of venous thrombosis. N Engl J Med, 2015; 372: 232-240
- 23) Bickmann JK, Baglin T, Meijers JCM and Renné T: Novel targets for anticoagulants lacking bleeding risk. Curr Opin Hematol, 2017; 24: 419-426
- 24) Rühl H, Winterhagen FI, Berens C, Müller J, Oldenburg J and Pötzsch B: In vivo thrombin generation and subsequent APC formation are increased in factor V Leiden carriers. Blood, 2018; 131: 1489-1492
- 25) Rühl H, Berens C, Winterhagen FI, Reda S, Müller J, Oldenburg J and Pötzsch B: Increased Activated Protein C Response Rates Reduce the Thrombotic Risk of Factor V Leiden Carriers But Not of Prothrombin G20210G>A Carriers. Circ Res, 2019; 125: 523-534
- 26) Friedrich MJ, Schmolders J, Rommelspacher Y, Strauss A, Rühl H, Mayer G, Oldenburg J, Wirtz DC, Müller J and Pötzsch B: Activity Pattern Analysis Indicates Increased but Balanced Systemic Coagulation Activity in Response to Surgical Trauma. TH Open, 2018; 2: e350-e356
- 27) Hemker HC, Al Dieri R, De Smedt E and Béquin S: Thrombin generation, a function test ot the haemostatic-thrombotic system. Thromb Haemost, 2006; 96: 553-561
- 28) Castoldi E and Rosing J: Thrombin generation tests. Thromb Res, 2011; 127 Suppl. 3: S21-S25
- 29) Müller J, Becher T, Braunstein J, Berdel P, Gravius S, Rohrbach F, Oldenburg J, Mayer G and Pötzsch B: Profiling of active thrombin in human blood by supramolecular complexes. Angew Chem Int Ed Engl, 2011; 50: 6075-6078
- 30) Rühl H, Müller J, Harbrecht U, Fimmers R, Oldenburg J, Mayer G and Pötzsch B: Thrombin inhibition profiles in healthy individuals and thrombophilic patients. Thromb Haemost, 2012; 107: 848-853
- 31) Rühl H, Schröder L, Müller J, Sukhitashvili S, Welz J, Kuhn WC, Oldenburg J, Rudlowski C and Pötzsch B: Impact of hormone-associated resistance to activated protein C on the thrombotic potential of oral contraceptives: a prospective observational study. PLoS One, 2014; 9: e105007
- 32) Becher T, Müller J, Akin I, Baumann S, Stach K, Borggrefe M, Pötzsch B and Loßnitzer D: Characterization of circulating thrombin in patients with septic shock: a prospective observational study. J Thromb Thrombolysis, 2020; 50: 90-97
- 33) Loeffen R, van Oerle R, de Groot PG, Waltenberger J, Crijns HJ, Spronk HM and ten Cate H: Increased factor XIa levels in patients with a first acute myocardial infarction: the introduction of a new thrombin generation based factor XIa assay. Thromb Res, 2014; 134: 1328-1334
- 34) Loeffen R, van Oerle R, Leers MP, Kragten JA, Crijns H, Spronk HM and ten Cate H: Factor XIa and Thrombin Generation Are Elevated in Patients with Acute Coronary Syndrome and Predict Recurrent Cardiovascular Events. PLoS One, 2016; 11: e0158355
- 35) Rühl H, Berens C, Winterhagen A, Müller J, Oldenburg J and Pötzsch B: Label-Free Kinetic Studies of Hemostasis-Related Biomarkers Including D-Dimer Using Autologous Serum Transfusion. PloS One, 2015; 10: e0145012
- 36) Prior SM, Cohen MJ, Conroy AS, Nelson MF, Kornblith LZ, Howard BM and Butenas S: Correlation between factor (F)XIa, FIXa and tissue factor and trauma severity. J Trauma Acute Care Surg, 2017; 82: 1073-1079
- 37) Prior SM, Park MS, Mann KG and Butenas S: Endogenous Procoagulant Activity in Trauma Patients and Its Relationship to Trauma Severity. TH Open, 2019; 3: e10-e19
- 38) Matafonov A, Sarilla S, Sun MF, Sheehan JP, Serebrov V, Verhamme IM and Gailani D: Activation of factor XI by products of prothrombin activation. Blood, 2011; 118: 437-445
- 39) Verhoef JJ, Barendrecht AD, Nickel KF, Dijkxhoorn K, Kenne E, Labberton L, McCarty OJ, Schiffelers R, Heijnen HF, Hendrickx AP, Schellekens H, Fens MH, de Maat S, Renné T and Maas C: Polyphosphate nanoparticles on the platelet surface trigger contact system activation. Blood, 2017; 129: 1707-1717
- 40) Ivanov I, Shakhawat R, Sun MF, Dickeson SK, Puy C, McCarty OJ, Gruber A, Matafonov A and Gailani D: Nucleic acids as cofactors for factor XI and prekallikrein activation: Different roles for high-molecular-weight kininogen. Thromb Haemost, 2017; 117:671-681
- 41) Grover SP and Mackman N: Tissue Factor: An Essential Mediator of Hemostasis and Trigger of Thrombosis. Arterioscler Thromb Vasc Biol, 2018; 38: 709-725
- 42) Lorentz CU, Verbout NG, Wallisch M, Hagen MW, Shatzel JJ, Olson SR, Puy C, Hinds MT, McCarty O, Gailani D, Gruber A and Tucker EI: Contact Activation Inhibitor and Factor XI Antibody, AB023, Produces Safe, Dose-Dependent Anticoagulation in a Phase 1 First-In-Human Trial. Arterioscler Thromb Vasc Biol, 2019; 39: 799-809
- 43) Weitz JI, Bauersachs R, Becker B, Berkowitz SD, Freitas MCS, Lassen MR, Metzig C and Raskob GE: Effect of Osocimab in Preventing Venous Thromboembolism Among Patients Undergoing Knee Arthroplasty: The FOXTROT Randomized Clinical Trial. JAMA, 2020; 323: 130-139

 , red line) or 13.6 nM (
 , green line) and dextran sulfate (DS, 5 µg/mL final concentration), benzamidine was added at the indicated time points. Data points and error bars show mean and SD, respectively. (E) FXIa generation in NPP was induced by adding aPTT reagent (Actin FS, 1:5) to NPP. Data points and error bars show mean and SD, respectively. (F) FXIa generation in plasma from patients with hereditary FXI deficiency. FXIa generation was induced by aPTT reagent (
 , blue line) or thrombin and dextran sulfate (
 ) and 34 subjects without a history of venous thromboembolism (●).


