Abstract
Aim: The aim of the present study was to investigate the associations of baseline and longitudinal changes in leukocyte counts with incident cardiovascular disease (CVD).
Methods: We conducted a prospective study to investigate the associations of baseline and 5-year changes in leukocyte counts with incident CVD and its subtypes in middle-aged and elderly Chinese. We estimated the hazard ratios (HRs) and 95% confidence intervals (CIs) for CVD using the Cox proportional-hazards models.
Results: In the analyses of baseline total leukocyte count of 26,655 participants, compared with the lowest quartile (<4.71×10⁹/L), participants in the fourth quartile (>6.70×10⁹/L) had 11% higher risk for CVD. Consistent with total leukocyte count, neutrophil count also exhibited a significant positive association with the risk of CVD. In the analyses of 5-year changes in total leukocyte count of 11,594 participants, the changes in leukocyte count were categorized into three groups, i.e., the decreased group (<25%), stable group (25%–75%), and increased group (>75%). Compared with participants in the stable group (−1.18 to 0.44×10⁹/L), participants in the increased group (>0.44×10⁹/L) had 14% higher risk for CVD. We also observed significant positive associations of the changes in neutrophil and monocyte counts with the risk of CVD. Furthermore, the total leukocyte count in the second or third tertile at the first follow-up with a 5-year increase was related to higher CVD risk.
Conclusion: High baseline total leukocyte count and a 5-year increase in total leukocyte count were related to higher CVD risk.
Introduction
Cardiovascular disease (CVD) is the leading cause of disease burden worldwide, and it is widely accepted as an inflammatory and immune disease1, 2). Leukocyte, one of the most low-cost and widely used markers of immune and inflammatory response, is recognized as a major contributor to a series of pathological processes of CVD, including oxidative stress, atherosclerotic plaque formation, plaque rupture, endothelial erosion, and thrombus formation3-6). Previous epidemiologic studies have demonstrated that several inflammatory markers, including high-sensitivity C-reactive protein and interleukin-6, are related to increased CVD risk7-9). In addition, randomized clinical trials have been conducted to prevent CVD through the inhibition of inflammation pathways10, 11).
Several previous studies have demonstrated that total leukocyte count was epidemiologically associated with the risk of CVD events, but the results of these studies were inconsistent. The majority of previous studies found that high total leukocyte count was associated with greater risk of coronary heart disease (CHD) or stroke incidence12-22), whereas others failed to find any significant association23, 24). Meanwhile, evidence on the relation of total leukocyte count with acute coronary syndrome (ACS) incidence is scarce, although ACS is one of the life-threatening subtypes of CHD. Results of the relation between leukocyte counts and stroke, such as ischemic stroke (IS) and hemorrhagic stroke (HS), were also inconsistent20, 25, 26).
Conversely, limited prospective studies have reported conflicting relation of differential leukocyte counts with CVD incidence. Several studies demonstrated that higher neutrophil count increased the risk of CVD incidence27-29), and monocyte count was also reported as a risk factor for CVD, CHD, and IS15, 30, 31). However, eosinophil and lymphocyte counts were reported to be inversely associated with the risk of CVD32). Moreover, the neutrophil-to-lymphocyte ratio (NLR) is a systemic inflammation biomarker that could balance the opposite effects of innate immunity (neutrophils) and adaptive immunity (lymphocytes) on arterial atherosclerosis33). Elevated NLR was reported to be linked to CHD incidence34). Together, associations of total and differential leukocyte counts with incident CVD and its subtypes remain to be elucidated.
Furthermore, different leukocyte subtypes exhibit lifespans varying from several hours to decades35-38), which may change in response to age, sex, obesity, lifestyles such as smoking and drinking, and environmental factors39-41), thus accelerating or decelerating CVD progression. To date, few studies have prospectively assessed the relationship of long-term changes in total leukocyte count with the risk of CVD events42-44), and existing studies only reported significant associations of leukocyte count changes with incident CHD and mortality42, 44). Studies on the associations of longitudinal changes in total and differential leukocyte counts with other CVD subtypes are still lacking.
Therefore, in the present study, we aimed to investigate the independent associations of baseline and 5-year changes in total and differential leukocyte counts with incident CVD and its subtypes. We further explored whether total leukocyte count at the first follow-up and 5-year changes in total leukocyte count were jointly associated with CVD events in middle-aged and elderly Chinese population.
Materials and Methods
Study Population
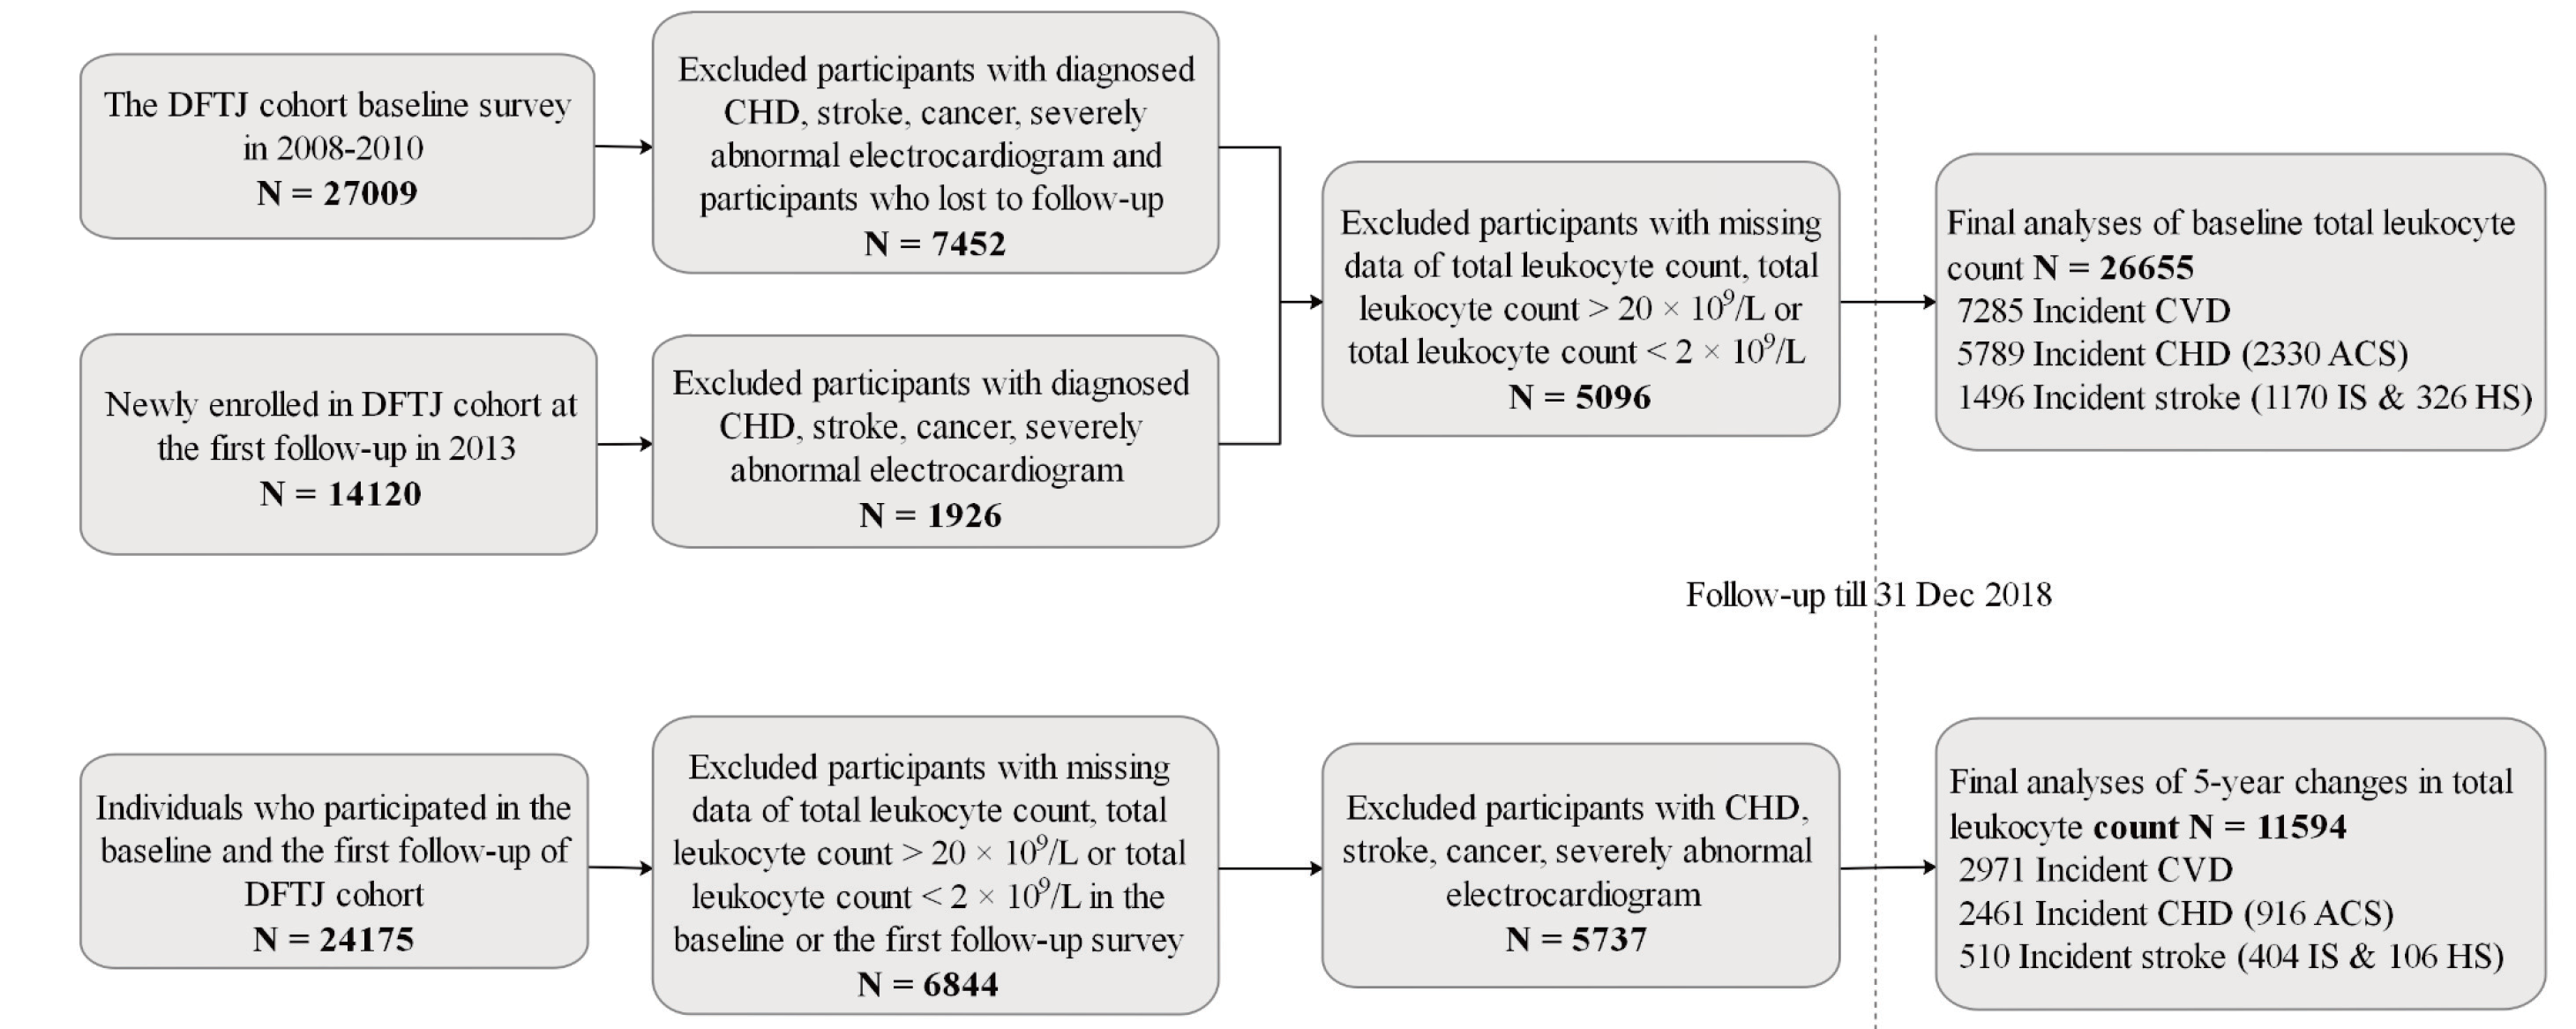
This study was based on the Dongfeng-Tongji (DFTJ) cohort in Shiyan City, China. As described elsewhere45), the DFTJ cohort is a prospective cohort to investigate the causes and progression of chronic diseases. The cohort enrolled 27,009 retirees at baseline from the Dongfeng Motor Corporation during September 2008 to June 2010 and then newly recruited 14,120 retirees at the first follow-up in 2013. Finally, questionnaires and blood samples of 41,129 participants at baseline or the first follow-up were collected when they joined the cohort for the first time. Among the 41,129 participants, we excluded participants who were diagnosed with CHD (n=5,468), stroke (n=1,972), cancer (n=2,182), and severely abnormal electrocardiogram (n=674) when they first joined the cohort and who were lost to follow-up (n=709). Since some of the participants may simultaneously have two or more diseases that were described above, we finally excluded 9,378 participants in this step. We further excluded 5,096 participants with missing data of total leukocyte count (n=5,088), with total leukocyte count >20×109/L (n=4), and with total leukocyte count <2×10⁹/L (n=4). Finally, we enrolled 26,655 participants in the analyses of baseline total leukocyte count (including participants at baseline and the first follow-up when they first joined the cohort). Furthermore, the baseline characteristics were similar between the overall 26,655 participants and the 5,096 participants who were excluded due to missing and extreme values of total leukocyte count (Supplementary Table 1). For the 24,175 individuals who participated in both the baseline and the first follow-up of the DFTJ cohort, we excluded those with self-reported CHD, stroke, cancer, or severely abnormal electrocardiogram at or prior to the first follow-up (n=5,737). Participants with missing information on total leukocyte count, with total leukocyte count <2×10⁹/L, and with total leukocyte count >20×109/L were also excluded (n=6,844). Finally, 11,594 participants were incorporated into the analyses of the association of the changes in total leukocyte count with incident CVD and its subtypes (Supplementary Fig.1).
Supplementary Table 1.
A comparison of the basic characteristics between the included participants and participants who were excluded due to missing and extreme values of the total leukocyte count
| Characteristics |
Included |
Excluded |
| N |
26655 |
5096 |
| Age (years) |
61.5±8.1 |
62.6±7.7 |
| Men (%) |
11762 (44.1) |
2216 (43.5) |
| BMI (kg/m2)§
|
24.2±3.3 |
24.5±3.4 |
| Education (%)§
|
|
|
| Primary school or below |
5857 (22.1) |
1084 (21.4) |
| Middle school |
9670 (36.5) |
1773 (35.0) |
| High school or beyond |
10949 (41.4) |
2202 (43.5) |
| Smoking status (%)§
|
|
|
| Current smokers |
5102 (19.2) |
931 (18.5) |
| Former smokers |
2597 (9.8) |
480 (9.5) |
| Never smokers |
18866 (71.0) |
3629 (72.0) |
| Drinking status (%)§
|
|
|
| Current drinkers |
6607 (24.8) |
1088 (21.4) |
| Former drinkers |
1195 (4.5) |
232 (4.6) |
| Never drinkers |
18812 (70.7) |
3764 (74.0) |
| Physical activity (%) |
18939 (71.1) |
3344 (65.6) |
| Antibiotics use (%) |
2052 (7.7) |
427 (8.4) |
| Aspirin use (%) |
2581 (9.7) |
459 (9.0) |
| Family history of CVD (%) |
2849 (10.7) |
509 (10.0) |
| Hyperlipidemia (%) |
10996 (41.3) |
1433 (28.1) |
| Hypertension (%) |
13475 (50.6) |
2409 (47.3) |
| Diabetes mellitus (%) |
4455 (16.7) |
562 (11.0) |
Abbreviation: BMI, body mass index; CVD, cardiovascular disease.
Continuous variables were described as mea±SD if normally distributed, or median (interquartile range) if skewed distributed.
Categorical variables were described as number (%).
§Data were incomplete for these variables. For totally 26655 participants included in the analysis, 357 (1.3%), 179 (0.7%), 90 (0.3%) and 41 (0.2%) of participants had missing data for BMI, education, smoking status and drinking status, respectively. The other variables included in the analyses did not have missing data. For the 5096 participants who were excluded due to missing and extreme values of total leukocyte count, 1585 (31.1%), 37 (0.7%), 56 (1.1%), and12 (2.4%) of participants had missing data for BMI, education, smoking status and drinking status, respectively.
Written informed consent was obtained from all participants, and this study was reviewed and approved by the Ethics and Human Subject Committee of Tongji Medical College, Huazhong University of Science and Technology (2012-10) and Sinopharm Dongfeng General Hospital.
Measurement of Leukocyte Counts
Total and differential leukocyte counts were measured at two time points (baseline survey during 2008–2010 and the first follow-up in 2013) with an average interval of 4.60 years using a fully automated analyzer CELL-DYN 3700 (Abbott Laboratories. Abbott Park, Illinois, USA) of Sinopharm Dongfeng General Hospital. NLR was calculated as the neutrophil count divided by the lymphocyte count. The 5-year changes in total and differential leukocyte counts were defined as measurements at the first follow-up in 2013 minus that at baseline during 2008–2010. Baseline measurements were categorized into four groups according to the quartiles, and changes in total and differential leukocyte counts were categorized into three groups according to the 25th and 75th percentiles, i.e., the decreased group (<25%), stable group (25%–75%), and increased group (>75%).
Ascertainment of Outcomes
The outcomes in this study were defined and classified based on the International Classification of Diseases (ICD) codes of the World Health Organization46). The outcome of interest was incident CVD, including CHD (ICD-10: I20-I25) and stroke (ICD-10: I60-I61, I63-I64, I69.0-I69.1, and I69.3-I69.4), which firstly occurred from baseline to the end of follow-up (31 Dec 2018). The Dongfeng Motor Corporation healthcare system covered all the retired employees and allowed us to track incident CVD through medical insurance information. We defined incident CHD as the first occurrence of fatal CHD, nonfatal myocardial infarction, stable and unstable angina, or coronary revascularization (coronary artery bypass graft or percutaneous transluminal coronary angioplasty) during follow-up47). ACS diagnosis was confirmed according to the diagnostic criteria for acute myocardial infarction and unstable angina48, 49). Stroke was defined as sudden or rapid onset of a typical neurological deficit of vascular origin that persisted for more than 24 h or death from stroke50). Based on the evidence from computed tomography and/or magnetic resonance imaging, stroke was further classified into IS or HS by expert physicians51).
Assessment of Covariates
Baseline information (demographic characteristics, lifestyles, family history of CVD, and medication usage) of the DFTJ cohort was obtained using semi-structured questionnaires. Anthropometric indices, systolic blood pressure (SBP), and diastolic blood pressure (DBP) were measured by trained personnel. Body mass index (BMI) was calculated as weight (kg) divided by height (m2). Participants who had been smoking at least one cigarette per day for at least 6 months were defined as current smokers. Participants who had been drinking at least one time per week for more than 6 months were regarded as current drinkers. Physical activity was identified as regular exercise more than five times per week and at least 30 min per time for more than 6 months. Education status was coded as primary school or below, junior high school, senior high school, or higher. Hypertension was defined as a self-reported physician diagnosis of hypertension, SBP ≥ 140 mmHg, DBP ≥ 90 mmHg, or intake of anti-hypertensive medications. Hyperlipidemia was defined as total cholesterol ≥ 6.22 mmol/L, triglycerides >2.26 mmol/L, high-density lipoprotein cholesterol <1.04 mmol/L, low-density lipoprotein cholesterol ≥ 4.14 mmol/L, intake of lipid-lowering medications, or a self-reported physician diagnosis of hyperlipidemia. Diabetes mellitus was defined as self-reported physician diagnosis of diabetes mellitus, fasting glucose ≥ 7.0 mmol/L, or intake of anti-diabetic medications (oral hypoglycemic medication or insulin). Estimated glomerular filtration rate (eGFR) was calculated using the Modification of Diet in Renal Disease equation52).
Statistical Analysis
Cox proportional-hazards regression models were employed to assess the associations of baseline and 5-year changes in total and differential leukocyte counts with CVD events. The outcomes of interest were followed up until 31 Dec 2018, and the results were expressed as hazard ratios (HRs) and 95% confidence intervals (CIs). In the analyses of the associations between baseline leukocyte counts and incident CVD, potential covariates in the multivariable models were collected at the time when the participants were first recruited (baseline or the first follow-up), including age, sex, BMI, smoking status, drinking status, physical activity, education, hyperlipidemia, hypertension, diabetes mellitus, family history of CVD/CHD/stroke, and medications that may affect leukocyte counts (antibiotics or aspirin), and we additionally adjusted for admission batch (baseline or the first follow-up) in the models. In the analyses of the associations between 5-year changes in leukocyte counts and incident CVD, potential covariates in the multivariable models were collected at the first follow-up in 2013, including age, sex, BMI, smoking status, drinking status, physical activity, education, hyperlipidemia, hypertension, diabetes mellitus, family history of CVD/CHD/stroke, and medications that may affect leukocyte counts (antibiotics or aspirin), and we additionally adjusted for baseline leukocyte counts in the models. Missing data of covariates were filled using imputation methods. For continuous variables, the median values were used as replacement of the missing values, and we additionally adjusted for a binary variable indicating whether the observation is a missing value, whereas for categorical variables, an extra group was added to replace the missing values. Person-years was calculated from the date of recruitment until the date of the first onset of CVD event, the date of death, or the end of follow-up, whichever came first. Interaction and stratified analyses were separately conducted by age (<60, ≥ 60 years), sex (men, women), BMI (<24, ≥ 24 kg/m2), current smoker (yes, no), current drinker (yes, no), hypertension (yes, no), hyperlipidemia (yes, no), and diabetes mellitus (yes, no). To avoid the effect of baseline inflammatory diseases on leukocyte counts, sensitivity analyses were conducted by excluding participants with baseline diseases, including gout, major rheumatic diseases, and end-stage renal disease (eGFR <30 mL/min/1.73 m2). We further calculated intra-class correlation coefficients (ICCs) to assess the consistency between the two measurements of total and differential leukocyte counts. Restricted cubic splines with three knots (5th, 50th, 95th) were used to display the relations of baseline and 5-year changes in total leukocyte count with the risk of CVD, CHD, and stroke.
Furthermore, based on the 11,594 participants in the analyses of changes in total leukocyte count with the risk of CVD, we assessed the joint effects of total leukocyte count at the first follow-up and 5-year changes in total leukocyte count on the risk of CVD events. Total leukocyte count at the first follow-up was categorized into tertiles (low, moderate, and high), together with decreased (<25%), stable (25%–75%), and increased (>75%) groups in the analyses of 5-year changes in total leukocyte counts, resulting in nine subcategories. We used low total leukocyte level at the first follow-up and a relatively stable change as the reference group. All statistical analyses were conducted using SAS version 9.4 (SAS institute Inc., Cary, NC). A two-sided P value <0.05 was considered statistically significant.
Results
Basic characteristics of baseline and 5-year changes in total leukocyte count
Among the 26,655 participants in this study, the mean age was 61.5 years (SD=8.1), and 44.1% were men. Participants in the highest quartile were more likely to be older, men, current smokers and drinkers, with low educational level, and with higher prevalence of hyperlipidemia, hypertension, and diabetes mellitus. Meanwhile, participants who experienced an increase in total leukocyte count were more likely to be men, current smokers and drinkers, and with higher prevalence of diabetes mellitus (Table 1).
Table 1.
Basic characteristics of study participants for baseline total leukocyte count and changes in total leukocyte count
| Characteristics |
Quartiles of total leukocyte count, ×109/L
|
P value
|
Changes in total leukocyte count, ×109/L
|
P value
|
| <4.71 |
4.71–5.60 |
5.61–6.70 |
>6.70 |
<−1.18 |
−1.18 to 0.44 |
>0.44 |
| N |
6802 |
6542 |
6865 |
6446 |
|
2792 |
5973 |
2829 |
|
| Age (years) |
60.1±7.9 |
61.2±8.0 |
62.0±8.1 |
62.8±8.1 |
<0.001 |
65.9±7.6 |
65.7±7.3 |
65.5±7.3 |
0.118 |
| Men (%) |
2335 (34.3) |
2693 (41.2) |
3238 (47.2) |
3496 (54.2) |
<0.001 |
1436 (51.4) |
3511 (58.8) |
1702 (60.2) |
<0.001 |
| BMI (kg/m2)
|
23.4±3.1 |
24.0±3.2 |
24.4±3.2 |
24.9±3.5 |
<0.001 |
24.0±3.4 |
24.1±3.3 |
24.2±3.4 |
0.063 |
| Education (%) |
|
|
|
|
|
|
|
|
|
| Primary school or below |
1272 (18.7) |
1432 (21.9) |
1569 (22.9) |
1584 (24.6) |
<0.001 |
806 (28.9) |
1678 (28.1) |
872 (30.8) |
0.187 |
| Middle school |
2382 (35.0) |
2355 (36.0) |
2560 (37.3) |
2373 (36.8) |
|
1038 (37.2) |
2237 (37.5) |
1052 (37.2) |
|
| High school or beyond |
3112 (45.8) |
2702 (41.3) |
2693 (39.2) |
2442 (37.9) |
|
925 (33.1) |
2013 (33.7) |
883 (31.2) |
|
| Smoking status (%) |
|
|
|
|
|
|
|
|
|
| Current smokers |
798 (11.7) |
1063 (16.2) |
1391 (20.3) |
1850 (28.7) |
<0.001 |
530 (19.0) |
862 (14.4) |
395 (14.0) |
<0.001 |
| Former smokers |
532 (7.8) |
648 (9.9) |
700 (10.2) |
717 (11.1) |
|
344 (12.3) |
721 (10.4) |
300 (10.6) |
|
| Never smokers |
5445 (80.0) |
4808 (73.5) |
4750 (69.2) |
3863 (59.9) |
|
1889 (67.7) |
4421 (74.0) |
2098 (74.2) |
|
| Drinking status (%) |
|
|
|
|
|
|
|
|
|
| Current drinkers |
1524 (22.4) |
1560 (23.8) |
1793 (26.1) |
1730 (26.8) |
<0.001 |
761 (27.3) |
1481 (24.8) |
734 (22.4) |
0.001 |
| Former drinkers |
241 (3.5) |
298 (4.4) |
299 (4.4) |
357 (5.5) |
|
154 (5.5) |
276 (4.6) |
136 (4.8) |
|
| Never drinkers |
5024 (73.9) |
4671 (71.4) |
4767 (69.4) |
4350 (67.5) |
|
1846 (66.1) |
4145 (69.4) |
2028 (71.7) |
|
| Physical activity (%) |
4810 (70.7) |
4698 (71.8) |
4903 (71.4) |
4528 (70.2) |
<0.001 |
2073 (74.2) |
4383 (73.4) |
2074 (73.3) |
0.605 |
| Antibiotics use (%) |
593 (8.7) |
496 (7.6) |
500 (7.3) |
463 (7.2) |
0.003 |
222 (8.0) |
459 (7.7) |
193 (7.8) |
0.050 |
| Aspirin use (%) |
573 (8.4) |
618 (9.4) |
677 (9.9) |
713 (11.1) |
<0.001 |
352 (12.6) |
761 (11.1) |
318 (11.2) |
0.076 |
| Family history of CVD (%) |
943 (13.9) |
752 (11.5) |
715 (10.4) |
617 (9.6) |
<0.001 |
218 (7.8) |
528 (8.8) |
217 (7.7) |
0.098 |
| Hyperlipidemia (%) |
2176 (32.0) |
2554 (39.0) |
3008 (43.8) |
3258 (50.5) |
<0.001 |
1100 (39.4) |
2410 (40.3) |
1201 (42.5) |
0.054 |
| Hypertension (%) |
2844 (41.8) |
3183 (48.7) |
3550 (51.7) |
3898 (60.5) |
<0.001 |
1761 (63.1) |
3707 (62.1) |
1801 (63.7) |
0.417 |
| Diabetes mellitus (%) |
763 (11.2) |
933 (14.3) |
1224 (17.8) |
1535 (23.8) |
<0.001 |
566 (20.3) |
1066 (17.8) |
582 (20.6) |
0.008 |
| Lymphocyte count, ×109/L
|
1.4 (1.2–1.7) |
1.7 (1.5–2.0) |
2.0 (1.6–2.3) |
2.3 (1.9–2.8) |
<0.001 |
1.6 (1.1–2.2) |
1.7 (1.1–2.2) |
2.0 (1.2–2.7) |
<0.001 |
| Monocyte count, ×109/L
|
0.3 (0.2–0.3) |
0.4 (0.3–0.4) |
0.4 (0.3–0.5) |
0.5 (0.4–0.6) |
<0.001 |
0.3 (0.2–0.5) |
0.3 (0.0–0.5) |
0.4 (0.2–0.6) |
<0.001 |
| Neutrophil count, ×109/L
|
2.3 (2.0–2.6) |
3.0 (2.6–3.3) |
3.6 (3.2–4.0) |
4.7 (4.1–5.4) |
<0.001 |
3.0 (2.1–4.0) |
3.1 (2.2–4.1) |
4.1 (2.7–5.5) |
<0.001 |
| Eosinophil count, ×109/L
|
0.1 (0.1–0.1) |
0.1 (0.1–0.2) |
0.1 (0.1–0.2) |
0.1 (0.1–0.2) |
<0.001 |
0.1 (0.0–0.3) |
0.1 (0.0–0.3) |
0.1 (0.0–0.3) |
<0.001 |
| Basophil count, ×109/L
|
0.1 (0.0–0.1) |
0.1 (0.0–0.1) |
0.1 (0.0–0.1) |
0.1 (0.1–0.1) |
<0.001 |
0.1 (0.0–0.2) |
0.1 (0.0–0.2) |
0.2 (0.0–0.3) |
<0.001 |
| Neutrophil-to-Lymphocyte Ratio |
1.6 (1.2–2.1) |
1.7 (1.3–2.2) |
1.8 (1.4–2.4) |
2.0 (1.5–2.7) |
<0.001 |
2.1 (0.6–3.6) |
2.1 (1.1–3.1) |
2.4 (1.1–3.7) |
<0.001 |
Abbreviation: BMI, body mass index; CVD, cardiovascular disease.
Continuous variables were described as mean±SD if normally distributed, or median (interquartile range) if skewed distributed. Categorical
variables were described as number (%).
P values were derived from ANOVA tests for continuous variables, and Chi-square test for the category variables.
During a median follow-up of 10.26 years (interquartile range [IQR], 7.06–10.31 years) for participants who joined the cohort at baseline, and a median follow-up of 5.69 years (IQR, 5.60–5.71 years) for participants who joined the cohort at the first follow-up, we identified 7,285 incident CVD cases, including 5,789 CHD (2,330 ACS) and 1,496 stroke cases (1,170 IS and 326 HS), among 26,655 participants with baseline total leukocyte count. The CVD incidence was slightly higher than that in other Chinese populations53-55), mainly due to the high mean age among the participants and the relatively comprehensive ascertainment of incident CVD through medical insurance documents, hospital records, and death certificates. As presented in Table 2, after multivariate adjustment for potential confounders, total leukocyte count was associated with incident CVD (HR, 1.03; 95% CI, 1.01–1.05), CHD (HR, 1.03; 95% CI, 1.01–1.05), ACS (HR, 1.05; 95% CI, 1.02–1.08), stroke (HR, 1.04; 95% CI, 1.01–1.08), and IS (HR, 1.06; 95% CI, 1.02–1.10) per 109/L increase in total leukocyte count; however, the association was not significant for HS (HR, 0.99; 95% CI, 0.92–1.07).
Table 2.
Adjusted HRs (95% CIs) of cardiovascular events according to quartiles of total leukocyte count in men and women
| Quartiles of total leukocyte count,×109/L
|
Q1 (<4.71) |
Q2 (4.71–5.60) |
Q3 (5.61–6.70) |
Q4 (>6.70) |
P for trend
|
Per 109/L increase
|
| CVD |
|
|
|
|
|
|
| All |
|
|
|
|
|
|
| Cases/person-years |
1464/47376 |
1673/46946 |
1953/49467 |
2195/45921 |
|
|
| HR (95% CI) |
1.00 (ref ) |
1.01 (0.94–1.08) |
1.04 (0.97–1.11) |
1.11 (1.03–1.19) |
0.001 |
1.03 (1.01–1.05) |
| Men |
|
|
|
|
|
|
| Cases/person-years |
597/15396 |
785/18551 |
1045/22400 |
1289/24026 |
|
|
| HR (95% CI) |
1.00 (ref ) |
1.01 (0.91–1.13) |
1.08 (0.98–1.20) |
1.17 (1.06–1.30) |
0.002 |
1.04 (1.02–1.06) |
| Woman |
|
|
|
|
|
|
| Cases/person-years |
867/31980 |
888/28395 |
908/27067 |
906/21895 |
|
|
| HR (95% CI) |
1.00 (ref ) |
1.00 (0.91–1.10) |
1.00 (0.91–1.10) |
1.04 (0.95–1.15) |
0.390 |
1.02 (1.00–1.04) |
| CHD |
|
|
|
|
|
|
| All |
|
|
|
|
|
|
| Cases/person-years |
1187/48405 |
1375/47810 |
1539/50665 |
1688/47360 |
|
|
| HR (95% CI) |
1.00 (ref ) |
1.05 (0.97–1.14) |
1.05 (0.97–1.13) |
1.10 (1.02–1.19) |
0.023 |
1.03 (1.01–1.05) |
| Men |
|
|
|
|
|
|
| Cases/person-years |
445/15930 |
609/19040 |
779/23166 |
933/25009 |
|
|
| HR (95% CI) |
1.00 (ref ) |
1.09 (0.96–1.23) |
1.12 (0.99–1.26) |
1.17 (1.05–1.32) |
0.008 |
1.03 (1.01–1.06) |
| Woman |
|
|
|
|
|
|
| Cases/person-years |
742/32475 |
766/28771 |
760/27499 |
755/22351 |
|
|
| HR (95% CI) |
1.00 (ref ) |
1.03 (0.93–1.14) |
1.00 (0.90–1.10) |
1.04 (0.94–1.16) |
0.581 |
1.02 (0.99–1.04) |
| ACS |
|
|
|
|
|
|
| All |
|
|
|
|
|
|
| Cases/person-years |
409/43460 |
528/42562 |
654/44985 |
739/40991 |
|
|
| HR (95% CI) |
1.00 (ref ) |
1.10 (0.96–1.25) |
1.16 (1.02–1.31) |
1.21 (1.07–1.38) |
0.002 |
1.05 (1.02–1.08) |
| Men |
|
|
|
|
|
|
| Cases/person-years |
169/14063 |
258/16903 |
349/20374 |
429/21508 |
|
|
| HR (95% CI) |
1.00 (ref ) |
1.13 (0.93–1.37) |
1.19 (0.99–1.44) |
1.26 (1.05–1.52) |
0.013 |
1.05 (1.01–1.08) |
| Woman |
|
|
|
|
|
|
| Cases/person-years |
240/29396 |
270/25659 |
305/24610 |
310/19483 |
|
|
| HR (95% CI) |
1.00 (ref ) |
1.07 (0.90–1.27) |
1.12 (0.94–1.33) |
1.16 (0.98–1.39) |
0.084 |
1.06 (1.02–1.10) |
| Stroke |
|
|
|
|
|
|
| All |
|
|
|
|
|
|
| Cases/person-years |
277/51317 |
298/51547 |
414/54683 |
507/51577 |
|
|
| HR (95% CI) |
1.00 (ref ) |
0.88 (0.75–1.04) |
1.04 (0.89–1.22) |
1.15 (0.99–1.34) |
0.006 |
1.04 (1.01–1.08) |
| Men |
|
|
|
|
|
|
| Cases/person-years |
152/16822 |
176/20574 |
266/24977 |
356/27032 |
|
|
| HR (95% CI) |
1.00 (ref ) |
0.86 (0.69–1.07) |
1.03 (0.84–1.26) |
1.17 (0.96–1.43) |
0.007 |
1.05 (1.01–1.09) |
| Woman |
|
|
|
|
|
|
| Cases/person-years |
125/34495 |
122/30974 |
148/29706 |
151/24545 |
|
|
| HR (95% CI) |
1.00 (ref ) |
0.93 (0.72–1.20) |
1.08 (0.85–1.37) |
1.08 (0.84–1.39) |
0.338 |
1.03 (0.97–1.09) |
| IS |
|
|
|
|
|
|
| All |
|
|
|
|
|
|
| Cases/person-years |
203/51003 |
224/51201 |
337/54311 |
406/51110 |
|
|
| HR (95% CI) |
1.00 (ref ) |
0.90 (0.74–1.09) |
1.14 (0.95–1.36) |
1.22 (1.02–1.45) |
0.001 |
1.06 (1.02–1.10) |
| Men |
|
|
|
|
|
|
| Cases/person-years |
108/16645 |
136/20387 |
214/24746 |
291/26734 |
|
|
| HR (95% CI) |
1.00 (ref ) |
0.92 (0.71–1.19) |
1.14 (0.90–1.43) |
1.31 (1.04–1.64) |
0.001 |
1.07 (1.02–1.12) |
| Woman |
|
|
|
|
|
|
| Cases/person-years |
95/34358 |
88/30814 |
123/29565 |
115/24376 |
|
|
| HR (95% CI) |
1.00 (ref ) |
0.88 (0.66–1.18) |
1.17 (0.89–1.54) |
1.07 (0.81–1.43) |
0.319 |
1.04 (0.97–1.10) |
| HS |
|
|
|
|
|
|
| All |
|
|
|
|
|
|
| Cases/person-years |
74/50433 |
74/50490 |
77/53097 |
101/49743 |
|
|
| HR (95% CI) |
1.00 (ref ) |
0.85 (0.62–1.18) |
0.78 (0.57–1.08) |
0.96 (0.70–1.31) |
0.938 |
0.99 (0.92–1.07) |
| Men |
|
|
|
|
|
|
| Cases/person-years |
44/16351 |
40/19912 |
52/23987 |
65/25733 |
|
|
| HR (95% CI) |
1.00 (ref ) |
0.71 (0.46–1.09) |
0.77 (0.51–1.15) |
0.85 (0.57–1.27) |
0.764 |
0.99 (0.90–1.09) |
| Woman |
|
|
|
|
|
|
| Cases/person-years |
30/34082 |
34/30578 |
25/29110 |
36/24009 |
|
|
| HR (95% CI) |
1.00 (ref ) |
1.09 (0.66–1.78) |
0.78 (0.46–1.34) |
1.12 (0.67–1.86) |
0.840 |
1.00 (0.88–1.12) |
Abbreviation: CVD, cardiovascular disease; CHD, coronary heart disease; ACS, acute coronary syndrome; IS, ischemic stroke; HS, hemorrhagic stroke.
P for trend was calculated when we assigned the median value to each quartile and entered this as a continuous variable in Cox regression models to test its linear effect.
Models were adjusted for age, sex, admission batch, BMI, smoking status, drinking status, education, physical activity, hypertension, diabetes mellitus, hyperlipidemia, family history of CVD/CHD/stroke, and intake of antibiotics or aspirin. Sex-stratified analyses were conducted without adjusting for sex.
In stratified Cox proportional-hazards regression models, we found that the CVD risk of increased total leukocyte count was significantly higher among men and current smokers (the P values for interaction were 0.05 and 0.03, respectively; Supplementary Fig.2). Therefore, we stratified the analyses of the associations between baseline total leukocyte count and the risk of CVD events by sex. High total leukocyte count was associated with incident CVD (HR, 1.04; 95% CI, 1.02–1.06), CHD (HR, 1.03; 95% CI, 1.01–1.06), ACS (HR, 1.05; 95% CI, 1.01–1.08), stroke (HR, 1.05; 95% CI, 1.01–1.09), and IS (HR, 1.07; 95% CI, 1.02–1.12) per 109/L increase in total leukocyte count in men, whereas in women, high total leukocyte count was only associated with incident CVD (HR, 1.02; 95% CI, 1.00–1.04) and ACS (HR, 1.06; 95% CI, 1.02–1.10). Restricted cubic spline plots also demonstrated significant linear associations of baseline total leukocyte count with CVD, CHD, and stroke (Fig.1). Compared with participants in the lowest quartile of total leukocyte count (<4.71×10⁹/L), the HRs (95% CIs) of those in the highest quartile (>6.70×10⁹/L) were 1.11 (1.03–1.19) (Ptrend=0.001) for CVD, 1.10 (1.02–1.19) (Ptrend=0.023) for CHD, 1.21 (1.07–1.38) (Ptrend=0.002) for ACS, and 1.22 (1.02–1.45) (Ptrend=0.001) for IS. When we restrict the analyses to men, the HRs (95% CIs) of those in the highest quartile were 1.17 (1.06–1.30) (Ptrend=0.002) for CVD, 1.17 (1.05–1.32) (Ptrend=0.008) for CHD, 1.26 (1.05–1.52) (Ptrend=0.013) for ACS, and 1.31 (1.04–1.64) (Ptrend=0.001) for IS; however, when we restrict the analyses to women, no significant association was observed.


In sensitivity analyses, after excluding participants with gout, major rheumatic diseases, and end-stage renal disease, the associations of total leukocyte count with incident CVD, CHD, and stroke did not materially change (Supplementary Fig.2). The associations between other differential leukocyte counts and the risk of CVD events are presented in Supplementary Tables 2–3.
Supplementary Table 2.
Adjusted HRs (95% CIs) of incident CVD, CHD and ACS according to quartiles of differential leukocyte counts and neutrophil-to-lymphocyte ratio
|
CVD |
CHD |
ACS |
| Events/ Person- years |
HR (95% CI) |
Events/ Person- years |
HR (95% CI) |
Events/ Person- years |
HR (95% CI) |
| Neutrophil count |
|
|
|
|
|
|
| Q1 (<2.601, ×109/L)
|
1425/43934 |
1.00 (ref ) |
1167/44840 |
1.00 (ref ) |
427/40058 |
1.00 (ref ) |
| Q2 (2.601–3.230, ×109/L)
|
1508/41275 |
0.99 (0.92–1.07) |
1232/41275 |
1.01 (0.94–1.10) |
473/37238 |
1.03 (0.91–1.18) |
| Q3 (3.231–4.030, ×109/L)
|
1743/42235 |
1.03 (0.96–1.11) |
1381/42235 |
1.03 (0.95–1.12) |
584/38228 |
1.10 (0.97–1.25) |
| Q4 (> 4.030, ×109/L)
|
1988/41800 |
1.09 (1.01–1.16) |
1523/43061 |
1.05 (0.97–1.14) |
679/37493 |
1.15 (1.01–1.30) |
| P for trend§
|
|
0.013 |
|
0.221 |
|
0.022 |
| Per 109/L increase
|
|
1.03 (1.01–1.05) |
|
1.01 (0.99–1.04) |
|
1.05 (1.01–1.09) |
| Lymphocyte count |
|
|
|
|
|
|
| Q1 (<1.461, ×109/L)
|
1449/39467 |
1.00 (ref ) |
1152/40411 |
1.00 (ref ) |
436/36270 |
1.00 (ref ) |
| Q2 (1.461–1.810, ×109/L)
|
1588/42569 |
0.98 (0.92–1.06) |
1279/43484 |
1.00 (0.92–1.08) |
527/38553 |
1.03 (0.91–1.17) |
| Q3 (1.811–2.250, ×109/L)
|
1697/43708 |
0.99 (0.92–1.06) |
1333/44773 |
0.99 (0.91–1.07) |
550/39547 |
1.00 (0.88–1.13) |
| Q4 (> 2.250, ×109/L)
|
1932/43612 |
1.02 (0.95–1.10) |
1540/44779 |
1.05 (0.97–1.14) |
650/38756 |
1.05 (0.92–1.19) |
| P for trend§
|
|
0.448 |
|
0.208 |
|
0.538 |
| Per 109/L increase
|
|
1.02 (0.98–1.05) |
|
1.03 (0.99–1.08) |
|
1.03 (0.96–1.09) |
| Monocyte count |
|
|
|
|
|
|
| Q1 (<0.281, ×109/L)
|
921/28218 |
1.00 (ref ) |
787/28650 |
1.00 (ref ) |
267/26129 |
1.00 (ref ) |
| Q2 (0.281–0.374, ×109/L)
|
1171/32663 |
1.01 (0.92–1.10) |
961/33327 |
0.99 (0.90–1.09) |
389/29874 |
0.99 (0.84–1.16) |
| Q3 (0.375–0.480, ×109/L)
|
1366/33357 |
1.06 (0.97–1.16) |
1084/34157 |
1.02 (0.93–1.13) |
449/30005 |
1.01 (0.86–1.18) |
| Q4 (> 0.480, ×109/L)
|
1425/30878 |
1.05 (0.96–1.14) |
1118/31699 |
1.03 (0.93–1.13) |
503/27899 |
1.05 (0.90–1.24) |
| P for trend§
|
|
0.261 |
|
0.449 |
|
0.399 |
| Per 109/L increase
|
|
1.10 (0.92–1.32) |
|
1.09 (0.89–1.33) |
|
1.14 (0.85–1.54) |
| Eosinophil count |
|
|
|
|
|
|
| Q1 (<0.061, ×109/L)
|
1038/31636 |
1.00 (ref ) |
844/32226 |
1.00 (ref ) |
324/29221 |
1.00 (ref ) |
| Q2 (0.061–0.100, ×109/L)
|
1222/32338 |
1.07 (0.98–1.16) |
997/33012 |
1.09 (0.99–1.19) |
406/29496 |
1.13 (0.97–1.31) |
| Q3 (0.101–0.164, ×109/L)
|
1265/30022 |
1.09 (1.01–1.19) |
1016/30775 |
1.10 (1.00–1.20) |
429/27211 |
1.15 (0.99–1.33) |
| Q4 (> 0.164, ×109/L)
|
1362/31126 |
1.09 (1.00–1.18) |
1097/31826 |
1.12 (1.02–1.23) |
450/27963 |
1.12 (0.97–1.30) |
| P for trend§
|
|
0.128 |
|
0.049 |
|
0.295 |
| Per 109/L increase
|
|
1.18 (0.99–1.41) |
|
1.27 (1.05–1.53) |
|
1.08 (0.78–1.51) |
| Basophil count |
|
|
|
|
|
|
| Q1 (<0.047, ×109/L)
|
996/28409 |
1.00 (ref ) |
813/28897 |
1.00 (ref ) |
282/26334 |
1.00 (ref ) |
| Q2 (0.047–0.072, ×109/L)
|
1331/34933 |
0.99 (0.91–1.08) |
1080/35779 |
1.01 (0.92–1.11) |
462/31534 |
1.02 (0.87–1.19) |
| Q3 (0.073–0.109, ×109/L)
|
1392/33830 |
1.03 (0.95–1.13) |
1106/34662 |
1.04 (0.94–1.14) |
478/30383 |
1.02 (0.87–1.19) |
| Q4 (> 0.109, ×109/L)
|
1159/27790 |
1.03 (0.95–1.13) |
946/28342 |
1.06 (0.97–1.17) |
386/25519 |
1.13 (0.97–1.32) |
| P for trend§
|
|
0.365 |
|
0.175 |
|
0.071 |
| Per 109/L increase
|
|
1.08 (0.88–1.32) |
|
1.19 (0.96–1.48) |
|
1.00 (0.66–1.54) |
| Neutrophil-to-lymphocyte ratio |
|
|
|
|
|
|
| Q1 (<1.34) |
1588/43431 |
1.00 (ref ) |
1306/44362 |
1.00 (ref ) |
511/39074 |
1.00 (ref ) |
| Q2 (1.34–1.79) |
1743/45363 |
1.02 (0.95–1.09) |
1389/46440 |
0.99 (0.92–1.07) |
545/40879 |
1.00 (0.89–1.13) |
| Q3 (1.80–2.37) |
1686/42043 |
1.01 (0.95–1.09) |
1350/43059 |
1.00 (0.92–1.07) |
573/38042 |
1.06 (0.94–1.20) |
| Q4 (> 2.37) |
1651/38557 |
1.06 (0.98–1.13) |
1260/39617 |
0.99 (0.91–1.07) |
533/35152 |
1.07 (0.94–1.20) |
| P for trend§
|
|
0.148 |
|
0.836 |
|
0.224 |
| Per one unit increase |
|
1.03 (1.00–1.06) |
|
1.02 (0.99–1.05) |
|
1.07 (1.02–1.11) |
Abbreviation: CVD, cardiovascular disease; CHD, coronary heart disease; ACS, acute coronary syndrome; CI, confidence interval; HR, hazard ratio.
HRs were adjusted for age, sex, admission batch, BMI, smoking status, drinking status, education, physical activity, hypertension, diabetes mellitus, hyperlipidemia, family history of CVD/CHD, and intake of antibiotics or aspirin.
§P for trend was calculated when we assigned the median value to each quartile and entered this as a continuous variable in the model to test its linear effect.
Supplementary Table 3.
Adjusted HRs (95% CIs) of incident stroke, IS and HS according to quartiles of differential leukocyte counts and neutrophil-to-lymphocyte ratio
|
Stroke |
Ischemic stroke |
Hemorrhagic stroke |
| Events/ Person- years |
HR (95% CI) |
Events/ Person- years |
HR (95% CI) |
Events/ Person- years |
HR (95% CI) |
| Neutrophil count |
|
|
|
|
|
|
| Q1 (<2.601, ×109/L)
|
258/47903 |
1.00 (ref ) |
202/47671 |
1.00 (ref ) |
56/47034 |
1.00 (ref ) |
| Q2 (2.601–3.230, ×109/L)
|
276/45389 |
0.93 (0.79–1.11) |
213/45070 |
0.91 (0.75–1.11) |
63/44374 |
1.01 (0.70–1.45) |
| Q3 (3.231–4.030, ×109/L)
|
362/46948 |
1.06 (0.90–1.24) |
279/46536 |
1.03 (0.86–1.24) |
83/45676 |
1.17 (0.83–1.65) |
| Q4 (> 4.030, ×109/L)
|
465/46781 |
1.20 (1.02–1.40) |
377/46401 |
1.22 (1.02–1.46) |
88/45039 |
1.13 (0.80–1.60) |
| P for trend§
|
|
0.003 |
|
0.003 |
|
0.387 |
| Per 109/L increase
|
|
1.08 (1.03–1.13) |
|
1.08 (1.03–1.14) |
|
1.08 (0.98–1.19) |
| Lymphocyte count |
|
|
|
|
|
|
| Q1 (<1.461, ×109/L)
|
297/43197 |
1.00 (ref ) |
207/42812 |
1.00 (ref ) |
90/42337 |
1.00 (ref ) |
| Q2 (1.461–1.810, ×109/L)
|
309/46884 |
0.94 (0.80–1.10) |
256/46646 |
1.11 (0.92–1.34) |
53/45692 |
0.56 (0.40–0.79) |
| Q3 (1.811–2.250, ×109/L)
|
364/48177 |
1.03 (0.88–1.21) |
297/47841 |
1.21 (1.01–1.45) |
67/46798 |
0.63 (0.45–0.86) |
| Q4 (> 2.250, ×109/L)
|
392/48897 |
0.96 (0.82–1.12) |
312/48514 |
1.08 (0.90–1.30) |
80/47427 |
0.67 (0.49–0.92) |
| P for trend§
|
|
0.792 |
|
0.515 |
|
0.066 |
| Per 109/L increase
|
|
0.96 (0.89–1.05) |
|
0.99 (0.91–1.09) |
|
0.85 (0.71–1.02) |
| Monocyte count |
|
|
|
|
|
|
| Q1 (<0.281, ×109/L)
|
134/30663 |
1.00 (ref ) |
99/30521 |
1.00 (ref ) |
35/30301 |
1.00 (ref ) |
| Q2 (0.281–0.374, ×109/L)
|
210/36003 |
1.14 (0.91–1.42) |
159/35789 |
1.15 (0.89–1.49) |
51/35269 |
1.12 (0.72–1.74) |
| Q3 (0.375–0.480, ×109/L)
|
282/37039 |
1.25 (1.01–1.56) |
222/36748 |
1.30 (1.02–1.67) |
60/36054 |
1.12 (0.73–1.74) |
| Q4 (> 0.480, ×109/L)
|
307/34614 |
1.17 (0.94–1.45) |
249/34346 |
1.23 (0.96–1.59) |
58/33515 |
0.97 (0.62–1.53) |
| P for trend§
|
|
0.263 |
|
0.139 |
|
0.720 |
| Per 109/L increase
|
|
1.20 (0.84–1.71) |
|
1.26 (0.87–1.84) |
|
0.96 (0.40–2.31) |
| Eosinophil count |
|
|
|
|
|
|
| Q1 (<0.061, ×109/L)
|
194/34377 |
1.00 (ref ) |
142/34139 |
1.00 (ref ) |
52/33738 |
1.00 (ref ) |
| Q2 (0.061–0.100, ×109/L)
|
225/35778 |
0.99 (0.81–1.20) |
169/35568 |
1.00 (0.80–1.26) |
56/35014 |
0.94 (0.64–1.37) |
| Q3 (0.101–0.164, ×109/L)
|
249/33479 |
1.06 (0.87–1.28) |
206/33242 |
1.18 (0.95–1.46) |
43/32644 |
0.73 (0.49–1.10) |
| Q4 (> 0.164, ×109/L)
|
265/34701 |
0.96 (0.80–1.17) |
212/34470 |
1.03 (0.83–1.28) |
53/33759 |
0.78 (0.52–1.15) |
| P for trend§
|
|
0.678 |
|
0.833 |
|
0.181 |
| Per 109/L increase
|
|
0.86 (0.54–1.37) |
|
1.01 (0.62–1.64) |
|
0.37 (0.10–1.32) |
| Basophil count |
|
|
|
|
|
|
| Q1 (<0.047, ×109/L)
|
183/31037 |
1.00 (ref ) |
138/30876 |
1.00 (ref ) |
45/30536 |
1.00 (ref ) |
| Q2 (0.047–0.072, ×109/L)
|
251/38543 |
0.92 (0.76–1.13) |
197/38269 |
0.95 (0.76–1.20) |
54/37640 |
0.84 (0.55–1.28) |
| Q3 (0.073–0.109, ×109/L)
|
286/37786 |
0.98 (0.81–1.20) |
224/37482 |
1.00 (0.79–1.26) |
62/36737 |
0.94 (0.62–1.41) |
| Q4 (> 0.109, ×109/L)
|
213/30789 |
0.92 (0.76–1.13) |
170/30613 |
0.95 (0.76–1.20) |
43/30063 |
0.84 (0.55–1.28) |
| P for trend§
|
|
0.579 |
|
0.762 |
|
0.554 |
| Per 109/L increase
|
|
0.67 (0.38–1.16) |
|
0.69 (0.37–1.28) |
|
0.61 (0.18–2.02) |
| Neutrophil-to-lymphocyte ratio |
|
|
|
|
|
|
| Q1 (<1.34) |
282/47980 |
1.00 (ref ) |
232/47747 |
1.00 (ref ) |
50/46887 |
1.00 (ref ) |
| Q2 (1.34–1.79) |
354/50088 |
1.16 (0.99–1.35) |
281/49728 |
1.12 (0.94–1.33) |
73/48856 |
1.35 (0.94–1.93) |
| Q3 (1.80–2.37) |
336/46393 |
1.11 (0.95–1.30) |
267/46083 |
1.07 (0.90–1.28) |
69/45096 |
1.32 (0.92–1.90) |
| Q4 (> 2.37) |
391/42734 |
1.30 (1.12–1.52) |
293/42295 |
1.19 (1.00–1.42) |
98/41442 |
1.89 (1.34–2.67) |
| P for trend §
|
|
0.002 |
|
0.085 |
|
<0.001 |
| Per one unit increase |
|
1.06 (1.01–1.12) |
|
1.05 (0.99–1.11) |
|
1.11 (1.01–1.23) |
Abbreviation: CI, confidence interval; HR, hazard ratio.
HRs were adjusted for age, sex, admission batch, BMI, smoking status, drinking status, education, physical activity, hypertension, diabetes mellitus, hyperlipidemia, family history of stroke, and intake of antibiotics or aspirin.
§P for trend was calculated when we assigned the median value to each quartile and entered this as a continuous variable in the model to test its linear effect.
During a median follow-up of 5.69 years (IQR, 4.81–5.71 years) from the first follow-up in 2013, we identified 2,971 incident CVD cases, including 2,461 CHD (916 ACS) and 510 stroke (404 IS and 106 HS) cases among 11,594 participants. Within a 4.60-year period between baseline and the first follow-up, the participants experienced a decrease of 0.37×10⁹/L in total leukocyte count on average, and the reproducibility of measurements at baseline and the first follow-up was moderate for total leukocyte count (ICC=0.58), neutrophil count (ICC=0.53), lymphocyte count (ICC=0.53), monocyte count (ICC=0.42), and eosinophil count (ICC=0.61), but low for basophil count (ICC=0.10) and NLR (ICC=0.35). Therefore, the associations of changes in basophil count and NLR with CVD events were not further analyzed.
Compared with the stable group (−1.18 to 0.44×10⁹/L), the adjusted HRs (95% CIs) of an increase of >0.44×10⁹/L in total leukocyte count were 1.14 (1.04–1.24) for incident CVD, 1.11 (1.01–1.22) for CHD, and 1.26 (1.03–1.55) for stroke (Table 3), and the association between 5-year changes in total leukocyte count and incident CVD was consistent in men (HR, 1.15; 95% CI, 1.01–1.31) and women (HR, 1.14; 95% CI, 1.01–1.28). Restricted cubic spline plots demonstrated a J-shaped association between 5-year changes in total leukocyte count and incident CVD and stroke but not CHD (Fig.1). The associations of changes in differential leukocyte counts with CVD events are presented in Supplementary Tables 4–5.
Table 3.
Adjusted HRs (95% CIs) of cardiovascular events according to total leukocyte count changes in men and women
|
<−1.18×10⁹/L
|
−1.18 to 0.44×10⁹/L
|
> 0.44×10⁹/L
|
| CVD |
|
|
|
| All |
|
|
|
| Cases/person-years |
711/13629 |
1481/29488 |
779/13624 |
| HR (95% CI) |
0.94 (0.85–1.04) |
1.00 (ref ) |
1.14 (1.04–1.24) |
| Men |
|
|
|
| Cases/person-years |
366/6521 |
701/11831 |
347/5248 |
| HR (95% CI) |
0.87 (0.76–1.01) |
1.00 (ref ) |
1.15 (1.01–1.31) |
| Woman |
|
|
|
| Cases/person-years |
345/7108 |
780/17658 |
432/8376 |
| HR (95% CI) |
1.01 (0.88–1.16) |
1.00 (ref ) |
1.14 (1.01–1.28) |
| CHD |
|
|
|
| All |
|
|
|
| Cases/person-years |
592/13910 |
1235/30033 |
634/13981 |
| HR (95% CI) |
0.95 (0.85–1.06) |
1.00 (ref ) |
1.11 (1.01–1.22) |
| Men |
|
|
|
| Cases/person-years |
293/6702 |
551/12109 |
264/5444 |
| HR (95% CI) |
0.90 (0.76–1.05) |
1.00 (ref ) |
1.10 (0.95–1.28) |
| Woman |
|
|
|
| Cases/person-years |
299/7209 |
684/17924 |
370/8538 |
| HR (95% CI) |
1.01 (0.87–1.17) |
1.00 (ref ) |
1.12 (0.99–1.27) |
| ACS |
|
|
|
| All |
|
|
|
| Cases/person-years |
233/12607 |
467/27110 |
216/12436 |
| HR (95% CI) |
0.91 (0.77–1.08) |
1.00 (ref ) |
1.02 (0.87–1.20) |
| Men |
|
|
|
| Cases/person-years |
124/6042 |
245/10896 |
101/4786 |
| HR (95% CI) |
0.81 (0.63–1.03) |
1.00 (ref ) |
0.96 (0.76–1.21) |
| Woman |
|
|
|
| Cases/person-years |
109/6566 |
222/16214 |
115/7650 |
| HR (95% CI) |
1.05 (0.82–1.35) |
1.00 (ref ) |
1.09 (0.86–1.37) |
| Stroke |
|
|
|
| All |
|
|
|
| Cases/person-years |
119/15113 |
246/32396 |
145/15201 |
| HR (95% CI) |
0.88 (0.69–1.12) |
1.00 (ref ) |
1.26 (1.03–1.55) |
| Men |
|
|
|
| Cases/person-years |
73/7204 |
150/13046 |
83/5905 |
| HR (95% CI) |
0.77 (0.56–1.05) |
1.00 (ref ) |
1.27 (0.97–1.67) |
| Woman |
|
|
|
| Cases/person-years |
46/7909 |
96/19350 |
62/9296 |
| HR (95% CI) |
1.10 (0.75–1.61) |
1.00 (ref ) |
1.25 (0.90–1.73) |
| IS |
|
|
|
| All |
|
|
|
| Cases/person-years |
93/15044 |
197/32234 |
114/15110 |
| HR (95% CI) |
0.84 (0.64–1.10) |
1.00 (ref ) |
1.24 (0.98–1.57) |
| Men |
|
|
|
| Cases/person-years |
60/7168 |
121/12956 |
65/5851 |
| HR (95% CI) |
0.76 (0.54–1.07) |
1.00 (ref ) |
1.24 (0.91–1.68) |
| Woman |
|
|
|
| Cases/person-years |
33/7875 |
76/19277 |
49/9260 |
| HR (95% CI) |
0.99 (0.63–1.54) |
1.00 (ref ) |
1.22 (0.85–1.77) |
| HS |
|
|
|
| All |
|
|
|
| Cases/person-years |
26/14835 |
49/31808 |
31/14896 |
| HR (95% CI) |
1.07 (0.64–1.82) |
1.00 (ref ) |
1.37 (0.87–2.15) |
| Men |
|
|
|
| Cases/person-years |
13/7034 |
29/12686 |
18/5711 |
| HR (95% CI) |
0.80 (0.39–1.66) |
1.00 (ref ) |
1.45 (0.80–2.63) |
| Woman |
|
|
|
| Cases/person-years |
13/7801 |
20/19122 |
13/9185 |
| HR (95% CI) |
1.54 (0.71–3.36) |
1.00 (ref ) |
1.32 (0.65–2.67) |
Abbreviation: CVD, cardiovascular disease; CHD, coronary heart disease; ACS, acute coronary syndrome; IS, ischemic stroke; HS, hemorrhagic stroke. Models were adjusted for age, sex, BMI, education, smoking status, drinking status, physical activity, hypertension, diabetes mellitus, hyperlipidemia, family history of CVD/CHD/stroke, intake of antibiotics or aspirin and baseline total leukocyte count. Sex-stratified analyses were conducted without adjusting for sex.
Supplementary Table 4.
Adjusted HRs (95% CIs) of incident CVD, CHD and ACS according to groups of 5-year changes in differential leukocyte counts
| Changes (×109/L) |
CVD |
CHD |
ACS |
| Events/ Person-years |
HR (95% CI) |
Events/ Person-years |
HR (95% CI) |
Events/ Person-years |
HR (95% CI) |
| Neutrophil count change |
|
|
|
|
|
|
| Q1 (<–0.65) |
648/12900 |
0.96 (0.86–1.06) |
539/13134 |
0.97 (0.86–1.08) |
213/11946 |
0.98 (0.82–1.18) |
| Q2–Q3 (–0.65 to 0.49) |
1349/26274 |
1.00 (ref ) |
1131/26789 |
1.00 (ref ) |
413/24074 |
1.00 (ref ) |
| Q4 (> 0.49) |
730/12561 |
1.10 (1.00–1.20) |
596/12884 |
1.06 (0.96–1.18) |
221/11497 |
1.08 (0.91–1.27) |
| Lymphocyte count change |
|
|
|
|
|
|
| Q1 (<–0.56) |
788/13870 |
0.98 (0.89–1.09) |
662/14145 |
0.98 (0.88–1.09) |
276/12730 |
1.13 (0.95–1.34) |
| Q2–Q3 (–0.56 to 0.07) |
1275/24836 |
1.00 (ref ) |
1072/25320 |
1.00 (ref ) |
390/22819 |
1.00 (ref ) |
| Q4 (> 0.07) |
664/13073 |
0.99 (0.90–1.09) |
532/13387 |
0.93 (0.84–1.04) |
181/12015 |
0.88 (0.74–1.05) |
| Monocyte count change |
|
|
|
|
|
|
| Q1 (<–0.26) |
317/5550 |
1.02 (0.88–1.17) |
263/5684 |
0.98 (0.84–1.15) |
118/5145 |
1.01 (0.80–1.27) |
| Q2–Q3 (–0.26 to 0) |
1142/22947 |
1.00 (ref ) |
975/23336 |
1.00 (ref ) |
393/21206 |
1.00 (ref ) |
| Q4 (> 0) |
332/5796 |
1.16 (1.03–1.32) |
273/5931 |
1.12 (0.98–1.28) |
96/5311 |
0.99 (0.79–1.24) |
| Eosinophil count change |
|
|
|
|
|
|
| Q1 (<–0.08) |
216/4298 |
0.89 (0.75–1.05) |
184/4376 |
0.90 (0.75–1.08) |
72/3986 |
0.87 (0.65–1.16) |
| Q2–Q3 (–0.08 to 0.06) |
1358/26305 |
1.00 (ref ) |
1146/26806 |
1.00 (ref ) |
447/24264 |
1.00 (ref ) |
| Q4 (> 0.06) |
218/3676 |
1.03 (0.89–1.19) |
182/3757 |
1.03 (0.88–1.21) |
88/3394 |
1.26 (1.00–1.59) |
Abbreviation: CVD, cardiovascular disease; CHD, coronary heart disease; ACS, acute coronary syndrome; CI, confidence interval; HR, hazard ratio.
HRs were adjusted for age, sex, BMI, education, smoking status, drinking status, physical activity, hypertension, diabetes mellitus, hyperlipidemia, family history of CVD/CHD, intake of antibiotics or aspirin, and baseline differential leukocyte counts.
Supplementary Table 5.
Adjusted HRs (95% CIs) of incident stroke, IS and HS according to groups of 5-year changes in differential leukocyte counts
| Changes (×109/L)
|
stroke |
Ischemic stroke |
Hemorrhagic stroke |
| Events/ Person-years |
HR (95% CI) |
Events/ Person-years |
HR (95% CI) |
Events/ Person-years |
HR (95% CI) |
| Neutrophil count change |
|
|
|
|
|
|
| Q1 (<–0.65) |
109/14215 |
0.91 (0.71–1.18) |
90/14156 |
0.99 (0.74–1.32) |
19/13929 |
0.64 (0.35–1.18) |
| Q2–Q3 (–0.65 to 0.49) |
218/28969 |
1.00 (ref ) |
171/28823 |
1.00 (ref ) |
47/28468 |
1.00 (ref ) |
| Q4 (> 0.49) |
134/14048 |
1.23 (0.99–1.53) |
106/13971 |
1.24 (0.97–1.59) |
28/13755 |
1.20 (0.75–1.92) |
| Lymphocyte count change |
|
|
|
|
|
|
| Q1 (<–0.56) |
126/15457 |
1.03 (0.81–1.32) |
97/15373 |
0.93 (0.70–1.23) |
29/15173 |
1.59 (0.92–2.76) |
| Q2–Q3 (–0.56 to 0.07) |
250/27512 |
1.00 (ref ) |
169/27414 |
1.00 (ref ) |
34/26994 |
1.00 (ref ) |
| Q4 (> 0.07) |
132/14312 |
1.30 (1.04–1.62) |
101/14211 |
1.21 (0.94–1.55) |
31/14035 |
1.75 (1.07–2.86) |
| Monocyte count change |
|
|
|
|
|
|
| Q1 (<–0.26) |
54/6190 |
1.12 (0.79–1.59) |
42/6155 |
1.08 (0.73–1.61) |
12/6066 |
1.27 (0.60–2.70) |
| Q2–Q3 (–0.26 to 0) |
167/25313 |
1.00 (ref ) |
127/25205 |
1.00 (ref ) |
40/24925 |
1.00 (ref ) |
| Q4 (> 0) |
59/6477 |
1.37 (1.01–1.86) |
50/6450 |
1.54 (1.10–2.16) |
9/6327 |
0.85 (0.41–1.76) |
| Eosinophil count change |
|
|
|
|
|
|
| Q1 (<–0.08) |
32/4705 |
0.85 (0.55–1.31) |
24/4680 |
0.78 (0.47–1.27) |
8/4640 |
1.20 (0.49–2.97) |
| Q2–Q3 (–0.08 to 0.06) |
212/29170 |
1.00 (ref ) |
167/29047 |
1.00 (ref ) |
45/28658 |
1.00 (ref ) |
| Q4 (> 0.06) |
36/4093 |
1.03 (0.72–1.49) |
28/4071 |
0.99 (0.65–1.50) |
8/4009 |
1.24 (0.58–2.67) |
Abbreviation: CI, confidence interval; HR, hazard ratio.
HRs were adjusted for age, sex, BMI, education, smoking status, drinking status, physical activity, hypertension, diabetes mellitus, hyperlipidemia, family history of stroke, intake of antibiotics or aspirin, and baseline differential leukocyte counts.
We examined the joint effects of total leukocyte count at the first follow-up and 5-year changes in total leukocyte count on incident CVD and its subtypes. As can be seen from Fig.2, compared with participants with low total leukocyte count at the first follow-up (<4.83×10⁹/L) and who experienced stable changes (−1.18 to 0.44×10⁹/L) in total leukocyte count, participants with high levels at the first follow-up (>6.00×10⁹/L) and experienced increased changes (>0.44×10⁹/L) had a higher risk of incident CVD (HR 1.15; 95% CI, 1.01–1.30), stroke (HR 1.62; 95% CI, 1.18–2.24), and IS (HR 1.90; 95% CI, 1.29–2.79) but not of CHD, ACS, and HS. Notably, participants in the moderate and high total leukocyte count group at the first follow-up with a 5-year increase in total leukocyte count had 102% and 90% higher risk of IS, respectively, and participants in the moderate and high total leukocyte count group at the first follow-up with stable changes also had 90% and 83% higher risk of IS, respectively.

Discussion
In this large prospective cohort comprised of middle-aged and elderly Chinese individuals, we found that high total and differential leukocyte counts as well as their 5-year changes were associated with higher risk of CVD events. In addition, high total leukocyte count at the first follow-up with a 5-year increase in total leukocyte count was associated with higher risk of CVD, stroke, and IS.
Consistent with our findings, the positive associations of increased total leukocyte count with elevated risk of ischemic CVD have been previously reported in different ethnic, age, and sex groups15, 16, 19, 34, 56). Our results indicated that the association of total leukocyte count with CVD was mostly explained by its relations with ACS and IS, and this study additionally suggested that participants with high total leukocyte count had a greater risk of ACS than CHD. ACS is considered to be the most serious clinical type of CHD, with serious thrombotic complications on the basis of atherosclerosis and activated immune cells contributing to plaque rupture and endothelial erosion of this process57). Friedman et al.58) measured the total leukocyte count 16.8 months before the onset of myocardial infarction and demonstrated that the total leukocyte count was a predictor of myocardial infarction. Furthermore, the Women’s Health Initiative study, in which 72,242 participants (701 cases) were enrolled, suggested that women in the upper quartile of total leukocyte count had a 40% higher risk of nonfatal myocardial infarction16). Similarly, this present study measured the leukocyte counts several years before the onset of ACS and suggested that the upper quartile of total leukocyte count had a 21% higher risk of ACS.
In line with previous studies15, 20, 59), we found significant associations of total leukocyte count with incident IS. The Honolulu Heart Program reported that increased total leukocyte count was an independent predictor of stroke and IS, but not HS, among 3,342 elderly Japanese-American men20, 59), a finding that is in agreement with the results of this study. Moreover, the non-significant association between total leukocyte count and incident HS may be attributed to the fact that there were only 326 cases of HS. Nonetheless, data from the Malmö Diet and Cancer Study indicated that the total leukocyte count was inversely related to the risk of HS, at marginal significance (P for trend=0.046). However, high NLR was found to be independently associated with greater risk of stroke, IS, and HS in the present study, and the prospective relation between NLR and risk of HS has not been reported before33, 34, 59).
In the sex-stratified analyses of baseline and 5-year changes in total leukocyte count, the main results were consistent among men. However, the baseline total leukocyte count among women only indicated a linear correlation with incident CVD and ACS. This can be explained by different lifestyles, estrogen bioactivity, and medication usage, such as hormone replacement therapy or oral contraceptives, in different sexes18, 40).
The design of this cohort study enabled us to investigate the 5-year changes in total leukocyte count with the risk of CVD events. A previous study found that change in total leukocyte count was an independent predictor of CHD42), a finding consistent with the results of this study. In addition, we reported that longitudinal change in total leukocyte count was related to increased risk of CVD and stroke in the general population. However, no significant associations were observed between 5-year changes in total leukocyte count and subtypes of CHD or stroke. The risk may be underestimated in these analyses as most severe cases had higher baseline total leukocyte count but lower total leukocyte count during the first follow-up. This is also why we conducted joint analyses to further investigate the joint associations of total leukocyte count at the first follow-up and 5-year changes in total leukocyte count with CVD risk. The Metabolic, Lifestyle and Nutrition Assessment in Young Adults study among Israeli army young adults found that a persistently high total leukocyte count was significantly associated with CHD incidence44). Furthermore, we reported that high total leukocyte count at the first follow-up with a 5-year increase in total leukocyte count was related to higher risk of CVD. The findings in these analyses indicate that serial measurements of total leukocyte count might help monitor the health status of middle-aged and elderly individuals; therefore, we could prevent CVD in time.
Different leukocyte subtypes play a role in inflammation and immune response, and atherosclerosis is an immune-mediated inflammatory disease that involves both innate and adaptive immunities60). Monocyte-derived macrophage is the main innate immunity cell in the atherosclerotic plague. The plasma lipoproteins beneath the endothelial cell recruit monocytes and trigger monocytes, which differentiate into macrophages or foam cells and further form atherosclerotic plaques5). Neutrophils and eosinophils might contribute to the emergence of atherosclerosis and thrombosis through an interplay with platelets and overactivity of extracellular traps61, 62). Neutrophils can also release myeloperoxidase and matrix metalloproteinase, which leads to endothelial dysfunction and atherosclerotic plaque instability63). Eosinophil degranulation and basophil activation are involved in the progression and rupture of coronary plaque64). Moreover, different lymphocyte subtypes play both pro-atherogenic and anti-atherosclerotic roles in the process of atherosclerosis57, 65). This study suggested a significant association between high levels of baseline NLR and the risk of CVD, ACS, and the two stroke subtypes, especially HS. In addition, we found that decreased lymphocyte count was related to higher risk of HS, which indicates that lymphocyte-mediated adaptive immunity, together with innate immunity, is involved in the pathogenesis of HS. A potential explanation might be that regulatory T-cell-mediated immunosuppression could balance the adverse effects of excessive inflammation3) and plays a positive role in the pathogenesis of HS.
This study was mainly strengthened by its large sample size, prospective design, and inclusion of a wide range of established risk factors of CVD as covariates. The cohort study design enabled us to evaluate the relations of total and differential leukocyte counts with the subtypes of CHD and stroke in one general population. In addition, two measurements over time allowed us to investigate the longitudinal changes in total and differential leukocyte counts with incident CVD and its subtypes, and serial monitoring of total and differential leukocyte counts could better reflect the long-term inflammatory state and help in the prevention of CVD. Furthermore, the results in this study confirmed the important role of innate and adaptive immunities in the pathogenesis of different CVD subtypes. This suggests that controlling and balancing the innate and adaptive immune responses might be preventive measures for different CVD subtypes. However, this study has several limitations. Although we carefully adjusted for a wide range of potential confounding factors, residual confounding may still be present. As the study population was comprised of middle-aged and elderly Chinese individuals without CVD or cancer, caution needs to be taken when applying findings in this study to populations of other age, ethnicity, or health condition groups. Finally, medication usage and baseline inflammatory diseases may have an impact on leukocyte counts. However, we adjusted for medications that may affect leukocyte counts (antibiotics or aspirin) and conducted sensitivity analyses by excluding baseline inflammatory diseases, and the results were materially unchanged.
In conclusion, high total and differential leukocyte counts as well as their changes were associated with elevated risk of CVD events in middle-aged and elderly Chinese population. Our findings further confirm that monitoring longitudinal changes in leukocyte markers may help provide an avenue for the primary prevention of future cardiovascular events.
Acknowledgements
The authors thank all Dongfeng-Tongji cohort participants, staff and investigators for their contribution to the study.
Funding
This work was supported by the National Key Research and Development Program of China (2016YFC0900800), the National Natural Science Foundation of China (81930092), the Fundamental Research Funds for the Central Universities (2019kfyXMBZ015), the 111 Project and the Program for Changjiang Scholars and Innovative Research Team in University.
Competing Interests
The authors declare no competing interests.
References
- 1) Zhao D, Liu J, Wang M, Zhang X, Zhou M. Epidemiology of cardiovascular disease in China: current features and implications. Nat Rev Cardiol, 2019; 16: 203-212
- 2) Fernandez-Ruiz I. Immune system and cardiovascular disease. Nat Rev Cardiol, 2016; 13: 503
- 3) Iadecola C, Anrather J. The immunology of stroke: from mechanisms to translation. Nat Med, 2011; 17: 796-808
- 4) Hansson GK. Inflammation, atherosclerosis, and coronary artery disease. N Engl J Med, 2005; 352: 1685-1695
- 5) Gisterå A, Hansson GK. The immunology of atherosclerosis. Nat Rev Nephrol, 2017; 13: 368-380
- 6) Sasaki K, Shoji T, Kabata D, Shintani A, Okute Y, Tsuchikura S, Shimomura N, Tsujimoto Y, Nakatani S, Mori K, Shioi A, Inaba M, Emoto M. Oxidative stress and inflammation as predictors of mortality and cardiovascular events in hemodialysis patients: the DREAM cohort. J Atheroscler Thromb, 2021; 28: 249-260
- 7) Lin JS, Evans CV, Johnson E, Redmond N, Coppola EL, Smith N. Nontraditional risk factors in cardiovascular disease risk assessment: updated evidence report and systematic review for the US Preventive Services Task Force. JAMA, 2018; 320: 281-297
- 8) Kaptoge S, Di Angelantonio E, Pennells L, Wood AM, White IR, Gao P, Walker M, Thompson A, Sarwar N, Caslake M, Butterworth AS, Amouyel P, Assmann G, Bakker SJ, Barr EL, Barrett-Connor E, Benjamin EJ, Björkelund C, Brenner H, Brunner E, Clarke R, Cooper JA, Cremer P, Cushman M, Dagenais GR, D’Agostino RB Sr, Dankner R, Davey-Smith G, Deeg D, Dekker JM, Engström G, Folsom AR, Fowkes FG, Gallacher J, Gaziano JM, Giampaoli S, Gillum RF, Hofman A, Howard BV, Ingelsson E, Iso H, Jørgensen T, Kiechl S, Kitamura A, Kiyohara Y, Koenig W, Kromhout D, Kuller LH, Lawlor DA, Meade TW, Nissinen A, Nordestgaard BG, Onat A, Panagiotakos DB, Psaty BM, Rodriguez B, Rosengren A, Salomaa V, Kauhanen J, Salonen JT, Shaffer JA, Shea S, Ford I, Stehouwer CD, Strandberg TE, Tipping RW, Tosetto A, Wassertheil-Smoller S, Wennberg P, Westendorp RG, Whincup PH, Wilhelmsen L, Woodward M, Lowe GD, Wareham NJ, Khaw KT, Sattar N, Packard CJ, Gudnason V, Ridker PM, Pepys MB, Thompson SG, Danesh J. C-reactive protein, fibrinogen, and cardiovascular disease prediction. N Engl J Med, 2012; 367: 1310-1320
- 9) Matsuo Y, Kumakura H, Kanai H, Iwasaki T, Ichikawa S. The geriatric nutritional risk index predicts long-term survival and cardiovascular or limb events in peripheral arterial disease. J Atheroscler Thromb, 2020; 27: 134-143
- 10) Ridker PM, Everett BM, Thuren T, MacFadyen JG, Chang WH, Ballantyne C, Fonseca F, Nicolau J, Koenig W, Anker SD, Kastelein JJP, Cornel JH, Pais P, Pella D, Genest J, Cifkova R, Lorenzatti A, Forster T, Kobalava Z, Vida-Simiti L, Flather M, Shimokawa H, Ogawa H, Dellborg M, Rossi PRF, Troquay RPT, Libby P, Glynn RJ; CANTOS Trial Group. Antiinflammatory therapy with Canakinumab for atherosclerotic disease. N Engl J Med, 2017; 377: 1119-1131
- 11) Zheng SL, Roddick AJ. Association of aspirin use for primary prevention with cardiovascular events and bleeding events: A systematic review and meta-analysis. JAMA, 2019; 321: 277-287
- 12) Gillum RF, Ingram DD, Makuc DM. White blood cell count, coronary heart disease, and death: the NHANES I Epidemiologic Follow-up Study. Am Heart J, 1993; 125: 855-863
- 13) Madjid M, Awan I, Willerson JT, Casscells SW. Leukocyte count and coronary heart disease: implications for risk assessment. J Am Coll Cardiol, 2004; 44: 1945-1956
- 14) Li C, Engström G, Hedblad B. Leukocyte count is associated with incidence of coronary events, but not with stroke: a prospective cohort study. Atherosclerosis, 2010; 209: 545-550
- 15) Lee CD, Folsom AR, Nieto FJ, Chambless LE, Shahar E, Wolfe DA. White blood cell count and incidence of coronary heart disease and ischemic stroke and mortality from cardiovascular disease in African-American and white men and women: atherosclerosis risk in communities study. Am J Epidemiol, 2001; 154: 758-764
- 16) Margolis KL, Manson JE, Greenland P, Rodabough RJ, Bray PF, Safford M, Grimm RH Jr, Howard BV, Assaf AR, Prentice R; Women’s Health Initiative Research Group. Leukocyte count as a predictor of cardiovascular events and mortality in postmenopausal women: the Women’s Health Initiative Observational Study. Arch Intern Med, 2005; 165: 500-508
- 17) Wheeler JG, Mussolino ME, Gillum RF, Danesh J. Associations between differential leucocyte count and incident coronary heart disease: 1764 incident cases from seven prospective studies of 30,374 individuals. Eur Heart J, 2004; 25: 1287-1292
- 18) Rana JS, Boekholdt SM, Ridker PM, Jukema JW, Luben R, Bingham SA, Day NE, Wareham NJ, Kastelein JJ, Khaw KT. Differential leucocyte count and the risk of future coronary artery disease in healthy men and women: the EPIC-Norfolk Prospective Population Study. J Intern Med, 2007; 262: 678-689
- 19) Karino S, Willcox BJ, Fong K, Lo S, Abbott R, Masaki KH. Total and differential white blood cell counts predict eight-year incident coronary heart disease in elderly Japanese-American men: the Honolulu Heart Program. Atherosclerosis, 2015; 238: 153-158
- 20) Huh JY, Ross GW, Chen R, Abbott RD, Bell C, Willcox B, Launer L, Petrovitch H, Kaya B, Masaki K. Total and differential white blood cell counts in late life predict 8-year incident stroke: the Honolulu Heart Program. J Am Geriatr Soc, 2015; 63: 439-446
- 21) Welsh C, Welsh P, Mark PB, Celis-Morales CA, Lewsey J, Gray SR, Lyall DM, Iliodromiti S, Gill JMR, Pell J, Jhund PS, Sattar N. Association of total and differential leukocyte counts with cardiovascular disease and mortality in the UK Biobank. Arterioscler Thromb Vasc Biol, 2018; 38: 1415-1423
- 22) Li J, Imano H, Yamagishi K, Tanaka M, Cui R, Muraki I, Umesawa M, Hayama-Terada M, Ohira T, Kiyama M, Okada T, Sankai T, Tanigawa T, Kitamura A, Iso H; CIRCS Investigators. Leukocyte count and risks of stroke and coronary heart disease: the Circulatory Risk in Communities Study (CIRCS). J Atheroscler Thromb, 2022; 29: 527-535
- 23) Weijenberg MP, Feskens EJ, Kromhout D. White blood cell count and the risk of coronary heart disease and all-cause mortality in elderly men. Arterioscler Thromb Vasc Biol, 1996; 16: 499-503
- 24) Gillum RF, Mussolino ME, Madans JH. Counts of neutrophils, lymphocytes, and monocytes, cause-specific mortality and coronary heart disease: the NHANES-I epidemiologic follow-up study. Ann Epidemiol, 2005; 15: 266-271
- 25) Wu TH, Chien KL, Lin HJ, Hsu HC, Su TC, Chen MF, Lee YT. Total white blood cell count or neutrophil count predict ischemic stroke events among adult Taiwanese: report from a community-based cohort study. BMC Neurol, 2013; 13: 7
- 26) Zia E, Melander O, Björkbacka H, Hedblad B, Engström G. Total and differential leucocyte counts in relation to incidence of stroke subtypes and mortality: a prospective cohort study. J Intern Med, 2012; 272: 298-304
- 27) ó Hartaigh B, Bosch JA, Thomas GN, Lord JM, Pilz S, Loerbroks A, Kleber ME, Grammer TB, Fischer JE, Boehm BO, März W. Which leukocyte subsets predict cardiovascular mortality? From the LUdwigshafen RIsk and Cardiovascular Health (LURIC) Study. Atherosclerosis, 2012; 224: 161-169
- 28) Shah AD, Denaxas S, Nicholas O, Hingorani AD, Hemingway H. Neutrophil counts and initial presentation of 12 cardiovascular diseases: a CALIBER cohort study. J Am Coll Cardiol, 2017; 69: 1160-1169
- 29) Madjid M, Fatemi O. Components of the complete blood count as risk predictors for coronary heart disease: in-depth review and update. Tex Heart Inst J, 2013; 40: 17-29
- 30) Olivares R, Ducimetière P, Claude JR. Monocyte count: a risk factor for coronary heart disease? Am J Epidemiol, 1993; 137: 49-53
- 31) SahBandar IN, Ndhlovu LC, Saiki K, Kohorn LB, Peterson MM, D’Antoni ML, Shiramizu B, Shikuma CM, Chow DC. Relationship between circulating inflammatory monocytes and cardiovascular disease measures of carotid intimal thickness. J Atheroscler Thromb, 2020; 27: 441-448
- 32) Nicholas O, Shah AD, Hemingway H, Denaxas S, Hingorani AD. Low eosinophil and low lymphocyte counts and the incidence of 12 cardiovascular diseases: a CALIBER cohort study. Open Heart, 2016; 3: e000477
- 33) Fani L, van der Willik KD, Bos D, Leening MJG, Koudstaal PJ, Rizopoulos D, Ruiter R, Stricker BHC, Kavousi M, Ikram MA, Ikram MK. The association of innate and adaptive immunity, subclinical atherosclerosis, and cardiovascular disease in the Rotterdam Study: A prospective cohort study. PLoS Med, 2020; 17: e1003115
- 34) Kim S, Eliot M, Koestler DC, Wu WC, Kelsey KT. Association of neutrophil-to-lymphocyte ratio with mortality and cardiovascular disease in the Jackson Heart Study and modification by the Duffy antigen variant. JAMA Cardiol, 2018; 3: 455-462
- 35) Liew PX, Kubes P. The Neutrophil’s role during health and disease. Physiol Rev, 2019; 99: 1223-1248
- 36) Arango Duque G, Descoteaux A. Macrophage cytokines: involvement in immunity and infectious diseases. Front Immunol, 2014; 5: 491
- 37) Seifert M, Küppers R. Human memory B cells. Leukemia, 2016; 30: 2283-2292
- 38) Kasakovski D, Xu L, Li Y. T cell senescence and CAR-T cell exhaustion in hematological malignancies. J Hematol Oncol, 2018; 11: 91
- 39) Yoshida K, French B, Yoshida N, Hida A, Ohishi W, Kusunoki Y. Radiation exposure and longitudinal changes in peripheral monocytes over 50 years: the Adult Health Study of atomic‐bomb survivors. Br J Haematol, 2019; 185: 107-115
- 40) Fisch IR, Freedman SH. Smoking, oral contraceptives, and obesity. Effects on white blood cell count. JAMA, 1975; 234: 500-506
- 41) Nakanishi N, Yoshida H, Okamoto M, Matsuo Y, Suzuki K, Tatara K. Association of alcohol consumption with white blood cell count: a study of Japanese male office workers. J Intern Med, 2003; 253: 367-374
- 42) Grimm RH, Jr., Neaton JD, Ludwig W. Prognostic importance of the white blood cell count for coronary, cancer, and all-cause mortality. JAMA, 1985; 254: 1932-1937
- 43) Ruggiero C, Metter EJ, Cherubini A, Maggio M, Sen R, Najjar SS, Windham GB, Ble A, Senin U, Ferrucci L. White blood cell count and mortality in the Baltimore Longitudinal Study of Aging. J Am Coll Cardiol, 2007; 49: 1841-1850
- 44) Twig G, Afek A, Shamiss A, Derazne E, Tzur D, Gordon B, Tirosh A. White blood cell count and the risk for coronary artery disease in young adults. PloS One, 2012; 7: e47183
- 45) Wang F, Zhu J, Yao P, Li X, He M, Liu Y, Yuan J, Chen W, Zhou L, Min X, Fang W, Liang Y, Wang Y, Wei S, Liu J, Miao X, Lang M, Jiang X, Zhang P, Li D, Lu C, Wang X, Shi W, Zheng J, Guo H, Zhang X, Yang H, Hu FB, Wu T. Cohort profile: the Dongfeng-Tongji cohort study of retired workers. Int J Epidemiol, 2013; 42: 731-740
- 46) Eisfeld J. International classification of diseases and related health problems, tenth revision (ICD-10). 2014; 1: 107-110
- 47) Luepker RV, Apple FS, Christenson RH, Crow RS, Fortmann SP, Goff D, Goldberg RJ, Hand MM, Jaffe AS, Julian DG, Levy D, Manolio T, Mendis S, Mensah G, Pajak A, Prineas RJ, Reddy KS, Roger VL, Rosamond WD, Shahar E, Sharrett AR, Sorlie P, Tunstall-Pedoe H; AHA Council on Epidemiology and Prevention; AHA Statistics Committee; World Heart Federation Council on Epidemiology and Prevention; European Society of Cardiology Working Group on Epidemiology and Prevention; Centers for Disease Control and Prevention; National Heart, Lung, and Blood Institute. Case definitions for acute coronary heart disease in epidemiology and clinical research studies: a statement from the AHA Council on Epidemiology and Prevention; AHA Statistics Committee; World Heart Federation Council on Epidemiology and Prevention; the European Society of Cardiology Working Group on Epidemiology and Prevention; Centers for Disease Control and Prevention; and the National Heart, Lung, and Blood Institute. Circulation, 2003; 108: 2543-2549
- 48) Alpert JS, Thygesen K, Antman E, Bassand JP. Myocardial infarction redefined—a consensus document of The Joint European Society of Cardiology/American College of Cardiology committee for the redefinition of myocardial infarction. J Am Coll Cardiol, 2000; 36: 959-969
- 49) Anderson JL, Adams CD, Antman EM, Bridges CR, Califf RM, Casey DE Jr, Chavey WE 2nd, Fesmire FM, Hochman JS, Levin TN, Lincoff AM, Peterson ED, Theroux P, Wenger NK, Wright RS, Jneid H, Ettinger SM, Ganiats TG, Lincoff AM, Philippides GJ, Zidar JP; American College of Cardiology Foundation/American Heart Association Task Force on Practice Guidelines. 2012 ACCF/AHA focused update incorporated into the ACCF/AHA 2007 guidelines for the management of patients with unstable angina/non-ST-elevation myocardial infarction: a report of the American College of Cardiology Foundation/American Heart Association Task Force on Practice Guidelines. Circulation, 2013; 127: e663-e828
- 50) Robins M, Baum HM. The national survey of stroke. Stroke, 1981; 12: I45-I57
- 51) Sacco RL, Kasner SE, Broderick JP, Caplan LR, Connors JJ, Culebras A, Elkind MS, George MG, Hamdan AD, Higashida RT, Hoh BL, Janis LS, Kase CS, Kleindorfer DO, Lee JM, Moseley ME, Peterson ED, Turan TN, Valderrama AL, Vinters HV; American Heart Association Stroke Council, Council on Cardiovascular Surgery and Anesthesia; Council on Cardiovascular Radiology and Intervention; Council on Cardiovascular and Stroke Nursing; Council on Epidemiology and Prevention; Council on Peripheral Vascular Disease; Council on Nutrition, Physical Activity and Metabolism. An updated definition of stroke for the 21st century a statement for healthcare professionals from the American Heart Association/American Stroke Association. Stroke, 2013; 44: 2064-2089
- 52) Ma YC, Zuo L, Chen JH, Luo Q, Yu XQ, Li Y, Xu JS, Huang SM, Wang LN, Huang W, Wang M, Xu GB, Wang HY. Modified glomerular filtration rate estimating equation for Chinese patients with chronic kidney disease. J Am Soc Nephrol, 2006; 17: 2937-2944
- 53) Lv J, Yu C, Guo Y, Bian Z, Yang L, Chen Y, Tang X, Zhang W, Qian Y, Huang Y, Wang X, Chen J, Chen Z, Qi L, Li L; China Kadoorie Biobank Collaborative Group. Adherence to healthy lifestyle and cardiovascular diseases in the Chinese population. J Am Coll Cardiol, 2017; 69: 1116-1125
- 54) Li H, Zheng D, Li Z, Wu Z, Feng W, Cao X, Wang J, Gao Q, Li X, Wang W, Hall BJ, Xiang YT, Guo X. Association of depressive symptoms with incident cardiovascular diseases in middle-aged and older Chinese adults. JAMA Netw Open, 2019; 2: e1916591
- 55) Huang K, Liang F, Yang X, Liu F, Li J, Xiao Q, Chen J, Liu X, Cao J, Shen C, Yu L, Lu F, Wu X, Zhao L, Wu X, Li Y, Hu D, Huang J, Liu Y, Lu X, Gu D. Long term exposure to ambient fine particulate matter and incidence of stroke: prospective cohort study from the China-PAR project. BMJ, 2019; 367: l6720
- 56) Horne BD, Anderson JL, John JM, Weaver A, Bair TL, Jensen KR, Renlund DG, Muhlestein JB; Intermountain Heart Collaborative Study Group. Which white blood cell subtypes predict increased cardiovascular risk? J Am Coll Cardiol, 2005; 45: 1638-1643
- 57) Libby P. Mechanisms of acute coronary syndromes and their implications for therapy. N Engl J Med, 2013; 368: 2004-2013
- 58) Friedman GD, Klatsky AL, Siegelaub AB. The leukocyte count as a predictor of myocardial infarction. N Engl J Med, 1974; 290: 1275-1278
- 59) Suh B, Shin DW, Kwon HM, Yun JM, Yang HK, Ahn E, Lee H, Park JH, Cho B. Elevated neutrophil to lymphocyte ratio and ischemic stroke risk in generally healthy adults. PloS One, 2017; 12: e0183706
- 60) Shah PK, Chyu K-Y, Dimayuga PC, Nilsson J. Vaccine for atherosclerosis. J Am Coll Cardiol, 2014; 64: 2779-2791
- 61) Borissoff JI, ten Cate H. From neutrophil extracellular traps release to thrombosis: an overshooting host-defense mechanism? J Thromb Haemost, 2011; 9: 1791-1794
- 62) Marx C, Novotny J, Salbeck D, Zellner KR, Nicolai L, Pekayvaz K, Kilani B, Stockhausen S, Bürgener N, Kupka D, Stocker TJ, Weckbach LT, Pircher J, Moser M, Joner M, Desmet W, Adriaenssens T, Neumann FJ, Gerschlick AH, Ten Berg JM, Lorenz M, Stark K. Eosinophil-platelet interactions promote atherosclerosis and stabilize thrombosis with eosinophil extracellular traps. Blood, 2019; 134: 1859-1872
- 63) Döring Y, Drechsler M, Soehnlein O, Weber C. Neutrophils in atherosclerosis: from mice to man. Arterioscler Thromb Vasc Biol, 2015; 35: 288-295
- 64) Niccoli G, Montone RA, Sabato V, Crea F. Role of allergic inflammatory cells in coronary artery disease. Circulation, 2018; 138: 1736-1748
- 65) Hansson GK, Hermansson A. The immune system in atherosclerosis. Nature immunol, 2011; 12: 204-212
