Abstract
Aims: The relationship between low body mass index (BMI) and prognostic factors for patients with coronary artery disease, commonly observed in elderly individuals in Japan, is important. Few studies have evaluated the prognosis for patients with low BMI after percutaneous coronary intervention (PCI). Using a multivariable-adjusted model and data from a prospective cohort registry, we analyzed the risk associated with low BMI for patients after PCI.
Methods: This prospective, multicenter registry included 5965 consecutive patients with coronary artery disease who underwent successful PCI. The patients were followed-up clinically for up to 3 years or until the occurrence of major adverse cardiac events. The primary endpoint was all-cause death and nonfatal myocardial infarction composite.
Results: Primary events occurred in 639 (10.7%) patients during the follow-up period. A risk analysis of the primary endpoint adjusted for the multivariable model showed a significant increase in risk for elderly individuals, underweight individuals [HR 1.43 (95% confidence interval (CI), 1.10–1.85), P<0.001], those with diabetes mellitus (DM), peripheral artery disease, low left ventricular ejection fraction or acute coronary syndrome (ACS), and smokers. A stratified adjusted risk analysis based on BMI levels showed that the risk associated with underweight status was significantly pronounced for male patients, those aged 60–74 years, and those with DM or ACS.
Conclusion: Underweight patients with several risk factors significantly increased risk after PCI. Furthermore, the risk associated with low BMI was significantly more pronounced for men, individuals aged 60–74 years, and patients with DM or ACS.
Introduction
Obesity is a major clinical issue worldwide and a well-known risk factor for mortality1, 2). The rates of obesity and overweight status are increasing in Japan and globally3). However, being lean is an independent risk factor for mortality and heart disease4), and body mass index (BMI) classifies the body type and proportion5). Although the BMI of patients with coronary artery disease is notably lower for Asian patients6), there have been few studies of the prognosis for patients with low BMI after PCI.
Although several previous cohort studies have reported a J-curve or U-curve relationship between mortality and BMI, low BMI has consistently been a poor prognostic factor4, 7, 8). This phenomenon is known as the obesity paradox9). Furthermore, low BMI is a poor prognostic factor for PCI patients, and a high BMI correlates with a good long-term prognosis4, 10, 11). These tendencies have different results dependent on age, and older patients are known to have lower BMI12). The exact cause of the obesity paradox is unexplained but appears to exist.
Generally, patients with high BMI have multiple risk factors for obesity compared to patients with low BMI 13, 14). Furthermore, patients with high BMI tend to be treated with enhanced secondary prevention15). Therefore, patients with low BMI may not be adequately treated because of the difference in the atherosclerotic risk prevalence15). Therefore, high BMI is often considered a higher risk factor after PCI. However, high BMI and low BMI are important risk factors for coronary heart disease. Furthermore, patients with low BMI often have sarcopenia or frailty16), which are direct predictors of mortality17).
Japan has the largest aging society in the world18). Although several studies have addressed the obesity paradox, it is important to evaluate the relationship between low BMI and prognostic factors for patients with coronary artery disease, commonly observed in elderly individuals in Japan.
Aim
We aimed to evaluate the association between prognostic factors and underweight after PCI. This study analyzed the risk associated with low BMI for patients after PCI using a multivariable-adjusted model and prospective cohort registry data.
Methods
Study Patients
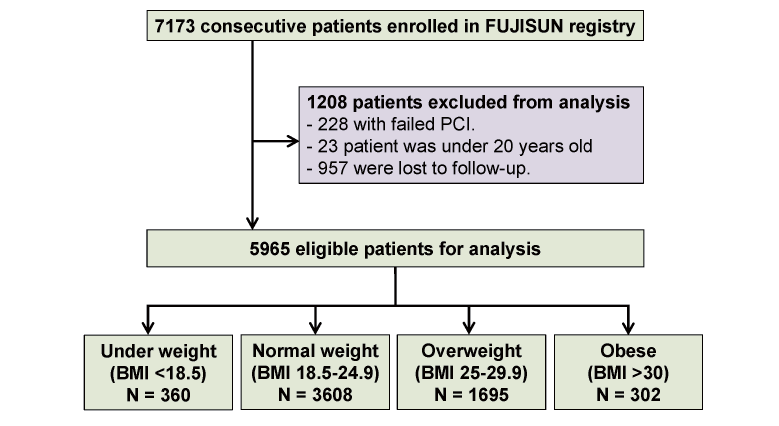
This cohort study was performed retrospective analysis using data from the FUJISUN registry, a prospective, multicenter cohort registry conducted at six Japanese sites. This registry’s URL is ‘https://center6.umin.ac.jp/cgi-open-bin/ctr_e/ctr_view.cgi?recptno=R000054027’, unique identifier (UMIN000047369). As previously described, this registry was designed to investigate the prognostic factors after PCI 19). The registry enrolled 7173 consecutive patients who underwent PCI for coronary artery disease at any of the participating hospitals between May 2008 and December 2018. The ethics committee at each site approved the study protocol, and the study conformed to the principles outlined in the 1975 Declaration of Helsinki. The committee waived informed consent for this retrospective analysis. The inclusion criteria were PCI patients at least 20 years of age. The exclusion criteria were unsuccessful PCI, age younger than 20 years, and failure to participate in follow-up. Patients were followed-up clinically for up to 3 years or until an event occurred. Finally, patients were divided into the following four groups according to BMI levels defined by the World Health Organization classification5): underweight, BMI <18.5 kg/m2; normal weight, BMI between 18.5 and 24.9; overweight, BMI between 25.0 and 29.9; and obese, BMI >30.0 (Fig.1).
This study analyzed the time to the first major adverse cardiac event (MACE), which was evaluated prospectively for up to 3 years from the index date. The index date was the date of PCI when patients initially enrolled in the registry. The primary endpoint was the combination of all-cause mortality and nonfatal myocardial infarction (MI). The secondary endpoint was a composite of all-cause mortality, nonfatal MI, repeat revascularization, and heart failure. If the first hospitalization for MI culminated in death because of progressive pump failure or sudden cardiac death during the follow-up period, then the event was considered death. Nonfatal MI was diagnosed by typical ischemic chest pain with a creatine kinase-MB level at least twice the upper limit of normal or a troponin T level >0.1 ng/mL or characteristic ischemic changes apparent on the electrocardiogram at the time of the event. Repeat revascularization was ischemia-driven revascularization of the coronary artery. It required repeat PCI or coronary artery bypass grafting for chest pain and/or ischemia, as indicated by resting electrocardiography results, positive exercise stress electrocardiography test results, or positive radionuclide study results. Heart failure was resting dyspnea with progressive fluid retention requiring diuretic treatment.
Table 1 summarizes baseline clinical characteristics of patients based on BMI levels. Hypertension was systolic blood pressure ≥ 140 mmHg, diastolic blood pressure ≥ 90 mmHg during hospitalization, or receiving treatment for high blood pressure before admission. Diabetes mellitus (DM) was defined as casual glucose level ≥ 200 mg/dL, fasting plasma glucose level ≥ 126 mg/dL, hemoglobin A1c level ≥ 6.5% (National Glycohemoglobin Standardization Program), or treatment with anti-diabetic drugs before admission. Peripheral artery disease (PAD) was defined as an ankle-brachial index <0.9 or a history of peripheral artery revascularization. A stroke was defined as a history of symptomatic brain dysfunction attributable to a vascular cause.
Table 1.
Comparisons of clinical characteristics between patients among BMI levels
|
Over all 5965 (100%) |
BMI <18.5 360 (6.0%) |
BMI 18.5-24.9
3608 (60.5%)
|
BMI 25-29.9
1695 (28.4%)
|
BMI >30
302 (5.1%)
|
P value
|
| Age, years |
70 [62-78] |
78 [70-83] |
71 [64-79] |
67 [59-74] |
59 [47-70] |
<0.001 |
| Sex, male, no (%) |
4594 (77.0) |
192 (53.3) |
2748 (76.2) |
1413 (83.4) |
241 (79.8) |
<0.001 |
| AC, cm |
85 [78-90] |
71 [66-76] |
82 [77-86] |
91 [87-96] |
102 [95-108] |
<0.001 |
| Hypertension, no (%) |
4272 (71.6) |
237 (65.8) |
2489 (69.0) |
1304 (76.9) |
242 (80.1) |
<0.001 |
| DM, no (%) |
2661 (44.6) |
122 (33.9) |
1504 (41.7) |
855 (50.4) |
180 (59.6) |
<0.001 |
| Hemodialysis, no (%) |
279 (4.7) |
26 (7.2) |
194 (5.4) |
48 (2.8) |
11 (3.6) |
<0.001 |
| PAD, no (%) |
282 (4.7) |
31 (8.6) |
178 (4.9) |
63 (3.7) |
10 (3.3) |
0.001 |
| Stroke, no (%) |
488 (8.2) |
31 (8.6) |
286 (7.9) |
152 (9.0) |
19 (6.3) |
0.36 |
| Current smoking, no (%) |
1735 (29.1) |
81 (22.5) |
990 (27.4) |
546 (32.2) |
118 (39.1) |
<0.001 |
| HbA1c, % |
5.9 [5.5-6.6] |
5.8 [5.4-6.3] |
5.9 [5.5-6.5] |
6.1 [5.6-6.8] |
6.2 [5.7-7.1] |
<0.001 |
| TG, mg/dL |
114 [80-160] |
81 [58-110] |
108 [76-149] |
132 [94-183] |
140 [102-205] |
<0.001 |
| HDL-C, mg/dL |
46 [39-56] |
56 [44-66] |
47 [40-57] |
44 [38-52] |
42 [36-51] |
<0.001 |
| LDL-C, mg/dL |
110 [87-133] |
104 [83-124] |
110 [87-133] |
111 [87-136] |
112 [86-136] |
0.003 |
| eGFR, mL/min/1.73m2
|
64 [50-76] |
60 [45-77] |
63 [50-76] |
65 [52-76] |
67 [54-80] |
<0.001 |
| BNP, pg/mL |
71 [27-230] |
149 [77-506] |
78 [30-258] |
52 [21-155] |
46 [17-110] |
<0.001 |
| LVEF <40%, no (%) |
762 (12.8) |
62 (17.2) |
472 (13.1) |
197 (11.6) |
31 (10.3) |
0.02 |
| NYHA HF classification, no (%) |
|
|
|
|
|
0.009 |
| Class I |
3679 (61.7) |
197 (54.7) |
2233 (61.9) |
1065 (62.8) |
184 (60.9) |
|
| Class II |
1260 (21.1) |
72 (20.0) |
760 (21.1) |
365 (21.5) |
63 (20.9) |
|
| Class III |
505 (8.5) |
41 (11.4) |
303 (8.4) |
130 (7.7) |
10.3 (24) |
|
| Class IV |
521 (8.7) |
50 (13.9) |
312 (8.6) |
135 (8.0) |
24 (7.9) |
|
| Medications, no (%)
|
|
|
|
|
|
|
| Aspirin |
5860 (98.2) |
350 (97.2) |
3537 (98.0) |
1672 (98.6) |
301 (99.7) |
0.04 |
| P2Y12 inhibitor |
5601 (93.9) |
330 (91.7) |
3392 (94.0) |
1598 (94.3) |
281 (93.0) |
0.26 |
| OAC |
397 (6.7) |
24 (6.7) |
259 (7.2) |
98 (5.8) |
16 (5.3) |
0.21 |
| Beta-blocker |
2382 (39.9) |
142 (39.4) |
1410 (39.1) |
680 (40.1) |
150 (49.7) |
0.004 |
| CCB |
2358 (39.5) |
101 (28.1) |
1352 (37.5) |
746 (44.0) |
159 (52.6) |
<0.001 |
| ACE-I |
1032 (17.3) |
63 (17.5) |
626 (17.4) |
298 (17.6) |
45 (14.9) |
0.72 |
| ARB |
2472 (41.4) |
116 (32.2) |
1422 (39.4) |
779 (46.0) |
155 (51.3) |
<0.001 |
| Statin |
4460 (74.8) |
210 (58.3) |
2675 (74.1) |
1329 (78.4) |
246 (81.5) |
<0.001 |
| DPP4 inhibitor |
801 (13.4) |
29 (8.1) |
474 (13.1) |
245 (14.5) |
53 (17.5) |
0.002 |
| SGLT2 inhibitor |
78 (1.3) |
2 (0.6) |
36 (1.0) |
35 (2.1) |
5 (1.7) |
0.007 |
| Insulin |
352 (5.9) |
22 (6.1) |
205 (5.7) |
98 (5.8) |
27 (8.9) |
0.14 |
| PCI variables
|
|
|
|
|
|
|
| Multivessel disease, (%) |
2582 (43.3) |
172 (47.8) |
1575 (43.7) |
706 (41.7) |
129 (42.7) |
0.17 |
| ACS, no (%) |
3139 (52.6) |
224 (62.2) |
1918 (53.2) |
839 (49.5) |
158 (52.3) |
<0.001 |
| Rota, no (%) |
142 (2.4) |
16 (4.4) |
98 (2.7) |
23 (1.4) |
5 (1.7) |
0.001 |
| Use of DES, no (%) |
3788 (63.5) |
236 (65.6) |
2276 (63.1) |
1092 (64.4) |
184 (60.9) |
0.49 |
| Stent diameter, mm |
3.0 [2.75-3.5] |
3.0 [2.75-3.5] |
3.0 [2.75-3.5] |
3.0 [2.75-3.5] |
3.0 [2.75-3.5] |
0.41 |
| Stent length, mm |
23 [16-33] |
24 [18-34] |
23 [16-33] |
23 [16-33] |
23 [15-32] |
0.03 |
Data are expressed as the median [25-75th percentile] or the number (%) of patients. MACE; major adverse cardiac event, BMI, body mass index; AC, abdominal circumference; DM, diabetes mellitus; PAD, peripheral artery disease; TG, triglyceride; HbA1c, hemoglobin A1c; HDL-C, high- density lipoprotein cholesterol; LDL-C, low-density lipoprotein cholesterol; eGFR, estimated glomerular filtration rate; BNP, brain natriuretic peptide; LVEF, left ventricular ejection fraction; NYHA, New York heart association; HF, heart failure; OAC, oral anticoagulants; CCB, calcium channel blocker; ACE-I, angiotensin converting enzyme inhibitor; ARB, angiotensin II receptor blocker; DPP4, dipeptidyl peptidase-4; SGLT2, sodium-glucose cotransporter 2; PCI, percutaneous coronary intervention; ACS, acute coronary syndrome; Rota, rotational atherectomy; DES, drug eluting stent.
Blood samples were collected from a peripheral vein during the early morning a few days before discharge from the hospital. Drug prescriptions were obtained at discharge after index PCI. Medications were prescribed at the discretion of the physician in charge. Patients received standard medical treatment after admission20) that continued throughout the follow-up period. Instructions regarding optimal lifestyle changes and diets were provided before discharge and continued throughout the follow-up. Data related to comorbidities, PCI procedures, and outcomes were obtained from each center. Clinical follow-up information was obtained using clinical visits, telephone surveys, validated questionnaires, and discussions with the referring physicians. All endpoint data were carefully checked for accuracy, consistency, and completeness of follow-up by the investigators. One investigator (T.H.) verified all data, performed statistical analyses, and ensured data file security.
Exposure and Laboratory Measurements
The BMI was calculated as the weight in kilograms divided by the height in meters squared. Abdominal circumference8) was measured at the level of the umbilicus at the end of normal expiration while in the standing position. Plasma levels of brain natriuretic peptide (BNP) were measured using an immunoradiometric assay (Shionogi Pharmaceutical, Osaka, Japan). Low-density lipoprotein cholesterol levels were calculated using the Friedewald formula20). The estimated glomerular filtration rate (eGFR) was calculated using the following formula: eGFR=194×serum creatinine−1.094×age−0.287×0.739 (if female)21). Echocardiography was performed a few days before discharge, and the left ventricular ejection fraction (LVEF) was calculated using the motion-mode method with the Teichholz formula. A low LVEF was defined as LVEF <40%.
Statistical Analysis
Data are expressed as the median, interquartile range (25th and 75th percentiles), frequency (%), hazard ratio (HR), or 95% confidence interval (CI). Continuous variables were tested using the Shapiro–Wilk test for normality and compared using the Mann–Whitney U test. As appropriate, categorical variables were compared between groups using Pearson’s chi-square analysis, Fisher’s exact test, or Wilcoxon signed rank test. Bartlett’s test was used to check whether the covariates had equal variance. After Bartlett’s test, the significance of differences among BMI groups was determined using the Kruskal–Wallis test. Correlations between clinical variables and event-free survival were tested using the Kaplan–Meier method, log-rank tests, and Cox proportional hazard regression. During the multivariable analysis, backward stepwise Cox regression was used for variable selection for the study sample. In the multivariable model, we included the following covariates known as major cardiovascular risk factors: age, hypertension, DM, PAD, stroke, current smoking, low-density lipoprotein cholesterol, eGFR, low LVEF, use of aspirin, and oral anticoagulants, and acute coronary syndrome. Stratification analysis of each covariate was performed using a Cox regression analysis adjusted for the multivariable model. During the Cox regression analysis, the incidence of MACE in the normal weight group was defined as the reference level, and the HRs of the other groups were analyzed based on comparisons with the HR of the normal weight group. Statistical significance was defined as P<0.05. Statistical analyses were performed using SPSS version 25 (IBM Corp., Armonk, NY, USA).
Results
Study Patients
This study initially included 7173 patients who underwent PCI. Based on the exclusion criteria, 228 patients with failed PCI and 23 patients younger than 20 years were excluded from this study. All patients participated in this prospective registry that assessed the incidence of MACEs after the index date. During the follow-up period, 957 patients discontinued participation, and the remaining 5965 patients were included in this study. The median follow-up period was 28 months (interquartile range, 10–36 months). During the follow-up period, 639 primary events occurred (607 all-cause deaths and 32 nonfatal MIs) and 1234 secondary events occurred (522 all-cause deaths, 26 nonfatal MIs, 274 heart failures, and 412 revascularizations). Of the 607 total deaths, 279 were cardiac deaths and 328 were noncardiac deaths. Table 1 summarizes the patients’ clinical characteristics.
Comparisons of Clinical Parameters and BMI Levels
The age at the index date was significantly older for underweight patients. The number of the female gender, hemodialysis patients, prevalence of PAD, low LVEF rates, presence of acute coronary syndrome (ACS), and history of rotational atherectomy were significantly higher in the underweight group. The New York Heart Association (NYHA) heart failure classification was significantly higher for underweight patients. However, hypertension, DM, and current smoking rates were low for patients with low BMI. In the low BMI group, the eGFRs and levels of hemoglobin A1c, triglycerides, and low-density lipoprotein cholesterol tended to be lower than those of the other groups. Conversely, high-density lipoprotein cholesterol and BNP levels tended to be higher. The following medications were significantly rarely used for patients with low BMI: beta-blockers, calcium channel blockers (CCBs) and angiotensin II receptor blockers (ARBs), statins, dipeptidyl peptidase-4 inhibitors, and sodium-glucose cotransporter 2 inhibitors (Table 1).
Comparisons of Clinical Parameters of Patients with MACEs
Of the 5965 study patients, primary and secondary endpoints occurred in 639 (10.7%) and 1234 (20.7%) patients during the follow-up period, respectively. Among the patients with both primary and secondary endpoints, age, use of hemodialysis, PAD, DM, stroke, serum BNP levels, low LVEF, NYHA class, multivessel disease, ACS, oral anticoagulant use, insulin use, and history of rotational atherectomy were significantly higher or more frequent. However, BMI levels, abdominal circumference, current smoking, serum lipid levels, eGFRs, aspirin use, P2Y12 inhibitor use, CCB use, angiotensin-converting enzyme inhibitor use, ARB use, and statin use were lower or less frequent for patients with MACEs. Furthermore, the use of beta-blockers, dipeptidyl peptidase-4 inhibitors, and sodium-glucose cotransporter 2 inhibitors was significantly low only among patients with primary endpoints. Conversely, the prevalence of hemoglobin A1c was significantly higher among patients with secondary endpoints (Table 2).
Table 2.
Comparisons of clinical characteristics between patients with and without Primary and secondary endpoint
|
Overall (N= 5965) |
With Primary EP (N= 639) |
Without Primary EP (N= 5326) |
P value
|
With Secondary EP (N= 1234) |
Without Secondary EP (N= 4731) |
P value
|
| Age, years |
70 [62-78] |
78 [69-83] |
69 [61-77] |
<0.001 |
74 [66-81] |
69 [61-77] |
<0.001 |
| Sex, male, no (%) |
4594 (77.0) |
495 (77.5) |
4099 (77.0) |
0.80 |
947 (76.7) |
3647 (77.1) |
0.79 |
| BMI, no (%) |
|
|
|
|
|
|
|
| <18.5 |
360 (6.0) |
73 (11.4) |
287 (5.4) |
<0.001 |
114 (9.2) |
246 (5.2) |
<0.001 |
| 18.5-24.9 |
3608 (60.5) |
413 (64.6) |
3195 (60.0) |
<0.001 |
773 (62.6) |
2835 (59.9) |
<0.001 |
| 25.0-29.9 |
1695 (28.4) |
135 (21.1) |
1560 (29.3) |
<0.001 |
296 (24.0) |
1399 (29.6) |
<0.001 |
| >30.0 |
302 (5.1) |
18 (2.8) |
284 (5.3) |
<0.001 |
51 (4.1) |
251 (5.3) |
<0.001 |
| AC, cm |
85 [78-90] |
82 [75-88] |
85 [79-91] |
<0.001 |
83 [76-80] |
85 [79-91] |
<0.001 |
| Hypertension, no (%) |
4272 (71.6) |
444 (69.5) |
3828 (71.9) |
0.21 |
884 (28.4) |
3388 (71.6) |
1.00 |
| DM, no (%) |
2661 (44.6) |
309 (48.4) |
2352 (44.2) |
0.04 |
628 (50.9) |
2033 (43.0) |
<0.001 |
| Hemodialysis, no (%) |
279 (4.7) |
86 (13.5) |
193 (3.6) |
<0.001 |
126 (10.2) |
153 (3.2) |
<0.001 |
| PAD, no (%) |
282 (4.7) |
77 (12.1) |
205 (3.8) |
<0.001 |
119 (9.6) |
163 (3.4) |
<0.001 |
| Stroke, no (%) |
488 (8.2) |
74 (11.6) |
414 (7.8) |
0.002 |
125 (10.1) |
363 (7.7) |
0.006 |
| Current smoking, no (%) |
1735 (29.1) |
157 (24.6) |
1578 (29.6) |
0.008 |
300 (24.3) |
1435 (30.3) |
<0.001 |
| HbA1c, % |
5.9 [5.5-6.6] |
5.9 [5.5-6.6] |
5.9 [5.5-6.6] |
0.62 |
6.0 [5.6-6.8] |
5.9 [5.5-6.5] |
0.009 |
| TG, mg/dL |
114 [80-160] |
96 [67-134] |
115 [82-163] |
<0.001 |
106 [74-145] |
116 [82-164] |
<0.001 |
| HDL-C, mg/dL |
46 [39-56] |
44 [36-56] |
46 [39-56] |
<0.001 |
45 [37-55] |
47 [39-47] |
<0.001 |
| LDL-C, mg/dL |
110 [87-133] |
100 [78-124] |
111 [88-134] |
<0.001 |
105 [82-129] |
111 [88-134] |
<0.001 |
| eGFR, mL/min/1.73m2
|
64 [50-76] |
50 [31-64] |
65 [52-77] |
<0.001 |
55 [38-68] |
65 [53-78] |
<0.001 |
| BNP, pg/mL |
71 [27-230] |
303 [103-770] |
61 [24-179] |
<0.001 |
156 [53-524] |
59 [23-167] |
<0.001 |
| LVEF <40%, no (%) |
762 (12.8) |
252 (39.4) |
510 (9.6) |
<0.001 |
362 (29.3) |
400 (8.5) |
<0.001 |
| NYHA, no (%) |
|
|
|
<0.001 |
|
|
<0.001 |
| Class I |
3679 (61.7) |
215 (33.6) |
3464 (65.0) |
|
583 (47.2) |
3096 (65.4) |
|
| Class II |
1260 (21.1) |
134 (21.0) |
1126 (21.1) |
|
248 (20.1) |
1012 (21.4) |
|
| Class III |
505 (8.5) |
99 (15.5) |
406 (7.6) |
|
164 (13.3) |
341 (7.2) |
|
| Class IV |
521 (8.7) |
191 (29.9) |
330 (6.2) |
|
239 (19.4) |
282 (6.0) |
|
| Medications, no (%)
|
|
|
|
|
|
|
|
| Aspirin |
5860 (98.2) |
586 (91.7) |
5274 (99.0) |
<0.001 |
1173 (95.1) |
4687 (99.1) |
<0.001 |
| P2Y12 inhibitor |
5601 (93.9) |
541 (84.7) |
5060 (95.0) |
<0.001 |
1107 (89.7) |
4494 (95.0) |
<0.001 |
| OAC |
397 (6.7) |
64 (10.0) |
333 (6.3) |
0.001 |
119 (9.6) |
278 (5.9) |
<0.001 |
| Beta-blocker |
2382 (39.9) |
202 (31.6) |
2180 (40.9) |
<0.001 |
473 (38.3) |
1909 (40.4) |
0.20 |
| CCB |
2358 (39.5) |
159 (24.9) |
2199 (41.3) |
<0.001 |
394 (31.9) |
1964 (41.5) |
<0.001 |
| ACE-I |
1032 (17.3) |
74 (11.6) |
958 (18.0) |
<0.001 |
189 (15.3) |
843 (17.8) |
0.04 |
| ARB |
2472 (41.4) |
195 (30.5) |
2277 (42.8) |
<0.001 |
434 (35.2) |
2038 (43.1) |
<0.001 |
| Statin |
4460 (74.8) |
268 (41.9) |
4192 (78.7) |
<0.001 |
693 (56.2) |
3767 (79.6) |
<0.001 |
| DPP4 inhibitor |
801 (13.4) |
65 (10.2) |
736 (13.8) |
0.01 |
157 (12.7) |
644 (13.6) |
0.43 |
| SGLT2 inhibitor |
78 (1.3) |
3 (0.5) |
75 (1.4) |
0.04 |
11 (0.9) |
67 (1.4) |
0.16 |
| Insulin |
352 (5.9) |
54 (8.5) |
298 (5.6) |
0.006 |
106 (8.6) |
246 (5.2) |
<0.001 |
| PCI variables
|
|
|
|
|
|
|
|
| Multivessel disease, (%) |
2582 (43.3) |
365 (57.1) |
2217 (41.6) |
<0.001 |
703 (57.0) |
1879 (39.7) |
<0.001 |
| ACS, no (%) |
3139 (52.6) |
412 (64.5) |
2727 (51.2) |
<0.001 |
708 (57.4) |
2431 (51.4) |
<0.001 |
| Rota, no (%) |
142 (2.4) |
37 (5.8) |
105 (2.0) |
<0.001 |
62 (5.0) |
80 (1.7) |
<0.001 |
| Use of DES, no (%) |
3788 (63.5) |
401 (62.8) |
3387 (63.6) |
0.70 |
766 (62.1) |
3022 (63.9) |
0.25 |
| Stent diameter, mm |
3.0 [2.75-3.5] |
3.0 [2.75-3.5] |
3.0 [2.75-3.5] |
0.35 |
3.0 [2.75-3.5] |
3.0 [2.75-3.5] |
0.52 |
| Stent length, mm |
23 [16-33] |
23 [16-33] |
23 [16-33] |
0.49 |
23 [16-32] |
23 [16-33] |
0.33 |
Data are expressed as the median [25-75th percentile] or the number (%) of patients. EP, endpoint; Other abbreviations are same as Table 1.
During the crude analysis of primary endpoints, there was a significant risk increase for elderly patients, underweight patients, those using hemodialysis, those with PAD, stroke, high BNP levels, low LVEFs, or higher NYHA classifications, those using oral anticoagulants or insulin, those with multivessel disease or ACS, and those with a history of rotational atherectomy. In contrast, there was a significant risk reduction in primary endpoints for patients with the following factors: higher BMI; larger abdominal circumference; current smoking; higher levels of triglycerides, high-density lipoprotein cholesterol, or low-density lipoprotein cholesterol; higher eGFRs; and use of aspirin, P2Y12 inhibitors, beta-blockers, CCBs, angiotensin-converting enzyme inhibitors, ARBs, statins, or dipeptidyl peptidase-4 inhibitors. During the risk analysis for the primary endpoint adjusted by the multivariable model, the risk increase was significantly pronounced for elderly patients, underweight patients, those with DM, PAD, low LVEF or ACS, and current smokers. Furthermore, this risk was attenuated for those with hypertension, higher low-density lipoprotein cholesterol levels, and eGFRs who took aspirin or oral anticoagulants.
During the crude analysis of secondary endpoints, there was a significant risk increase for patients with the following factors: elderly age; underweight status; DM; use of hemodialysis, oral anticoagulants, or insulin; PAD; stroke; higher BNP levels; low LVEFs; higher NYHA class; multivessel disease; ACS; and history of rotational atherectomy. However, there was a significant risk reduction for patients with the following factors: overweight status; larger abdominal circumference; current smoking; higher levels of triglycerides, high-density lipoprotein cholesterol, or low-density lipoprotein cholesterol; higher eGFRs; and use of aspirin, P2Y12 inhibitors, CCBs, ARBs, or statins. During the adjusted risk analysis of secondary endpoints, elderly patients, underweight patients, and those with DM, PAD, LVEF, or ACS had significant risk aggravation. Risk reduction occurred for patients with hypertension, higher low-density lipoprotein cholesterol levels, higher eGFRs, and use of aspirin (Table 3).
Table 3.
COX proportional hazards regression analysis for occurrence of Primary and Secondary endpoint
|
Primary Endpoint |
Secondary Endpoint |
| Univariable |
Multivariable |
Univariable |
Multivariable |
| HR (95% CI) |
P value
|
HR (95% CI) |
P value
|
HR (95% CI) |
P value
|
HR (95% CI) |
P value
|
| Age, per 10 years |
1.88 (1.73-2.04) |
<0.001 |
1.65 (1.50-1.81) |
<0.001 |
1.43 (1.35-1.51) |
<0.001 |
1.26 (1.19-1.34) |
<0.001 |
| Male gender |
1.02 (0.85-1.23) |
0.84 |
|
|
0.97 (0.85-1.11) |
0.97 |
|
|
| BMI |
|
|
|
|
|
|
|
|
| <18.5 |
1.91 (1.49-2.45) |
<0.001 |
1.43 (1.10-1.85) |
0.007 |
1.60 (1.31-1.94) |
<0.001 |
1.33 (1.09-1.63) |
0.006 |
| 18.5-24.9 |
Ref. |
- |
Ref. |
- |
Ref. |
- |
Ref. |
- |
| 25.0-29.9 |
0.69 (0.57-0.84) |
<0.001 |
1.01 (0.83-1.25) |
0.89 |
0.81 (0.71-0.92) |
0.002 |
0.98 (0.85-1.13) |
0.77 |
| >30.0 |
0.51 (0.32-0.82) |
0.005 |
0.98 (0.60-1.61) |
0.93 |
0.77 (0.58-1.03) |
0.07 |
1.09 (0.81-1.47) |
0.57 |
| AC, per SD |
0.80 (0.74-0.87) |
<0.001 |
|
|
0.87 (0.82-0.92) |
<0.001 |
|
|
| Hypertension |
0.85 (0.72-1.01) |
0.06 |
0.72 (0.60-0.86) |
<0.001 |
0.95 (0.84-1.08) |
0.95 |
0.85 (0.75-0.97) |
0.02 |
| DM |
1.13 (0.97-1.32) |
0.12 |
1.20 (1.02-1.42) |
0.03 |
1.27 (1.13-1.42) |
<0.001 |
1.27 (1.14-1.44) |
<0.001 |
| Hemodialysis |
3.41 (2.72-4.28) |
<0.001 |
|
|
2.61 (2.17-3.13) |
<0.001 |
|
|
| PAD |
2.90 (2.28-3.67) |
<0.001 |
1.73 (1.34-2.22) |
<0.001 |
2.37 (1.96-2.87) |
<0.001 |
1.58 (1.30-1.93) |
<0.001 |
| Stroke |
1.49 (1.17-1.90) |
0.001 |
not selected |
|
1.29 (1.08-1.56) |
0.006 |
not selected |
|
| Current smoking |
0.79 (0.66-0.94) |
0.009 |
1.35 (1.11-1.65) |
0.003 |
0.77 (0.68-0.88) |
<0.001 |
not selected |
|
| HbA1c, per SD |
0.98 (0.90-1.06) |
0.54 |
|
|
1.05 (0.99-1.10) |
0.09 |
|
|
| TG, per SD |
0.73 (0.65-0.82) |
<0.001 |
|
|
0.84 (0.78-0.91) |
<0.001 |
|
|
| HDL-C, per SD |
0.86 (0.79-0.94) |
0.001 |
|
|
0.88 (0.83-0.94) |
<0.001 |
|
|
| LDL-C, per SD |
0.76 (0.69-0.83) |
<0.001 |
0.87 (0.79-0.95) |
0.003 |
0.85 (0.80-0.91) |
<0.001 |
0.94 (0.88-0.99) |
0.04 |
| BNP, per SD |
1.41 (1.36-1.46) |
<0.001 |
|
|
1.32 (1.28-1.37) |
<0.001 |
|
|
| eGFR, per SD |
0.38 (0.34-0.42) |
<0.001 |
0.50 (0.44-0.57) |
<0.001 |
0.49 (0.45-0.53) |
<0.001 |
0.62 (0.57-0.68) |
<0.001 |
| LVEF <40% |
5.37 (4.58-6.30) |
<0.001 |
3.54 (2.96-4.24) |
<0.001 |
3.72 (3.30-4.21) |
<0.001 |
2.73 (2.39-3.12) |
<0.001 |
| NYHA HF classification |
|
|
|
|
|
|
|
|
| Class I |
Ref. |
- |
|
|
Ref. |
- |
|
|
| Class II |
1.92 (1.54-2.38) |
<0.001 |
|
|
1.33 (1.15-1.54) |
<0.001 |
|
|
| Class III |
3.65 (2.88-4.63) |
<0.001 |
|
|
2.33 (1.96-2.77) |
<0.001 |
|
|
| Class IV |
8.02 (6.60-9.75) |
<0.001 |
|
|
3.90 (3.36-4.54) |
<0.001 |
|
|
| Medications
|
|
|
|
|
|
|
|
|
| Aspirin |
0.11 (0.08-0.14) |
<0.001 |
0.23 (0.17-0.33) |
<0.001 |
0.18 (0.14-0.23) |
<0.001 |
0.33 (0.25-0.45) |
<0.001 |
| P2Y12 inhibitor |
0.31 (0.25-0.39) |
<0.001 |
|
|
0.48 (0.40-0.58) |
<0.001 |
|
|
| OAC |
1.38 (1.07-1.79) |
0.01 |
0.75 (0.56-0.99) |
0.04 |
1.41 (1.17-1.71) |
<0.001 |
not selected |
|
| Beta-blocker |
0.72 (0.61-0.85) |
<0.001 |
|
|
0.98 (0.87-1.01) |
0.68 |
|
|
| CCB |
0.46 (0.38-0.55) |
<0.001 |
|
|
0.65 (0.57-0.73) |
<0.001 |
|
|
| ACE-I |
0.64 (0.50-0.81) |
<0.001 |
|
|
0.87 (0.75-1.02) |
0.09 |
|
|
| ARB |
0.57 (0.49-0.68) |
<0.001 |
|
|
0.71 (0.63-0.80) |
<0.001 |
|
|
| Statin |
0.23 (0.20-0.27) |
<0.001 |
|
|
0.40 (0.35-0.44) |
<0.001 |
|
|
| Insulin |
1.42 (1.08-1.88) |
0.01 |
|
|
1.50 (1.23-1.84) |
<0.001 |
|
|
| DPP4 inhibitor |
0.75 (0.58-0.97) |
0.03 |
|
|
0.96 (0.81-1.13) |
0.60 |
|
|
| SGLT2 inhibitor |
0.53 (0.17-1.65) |
0.27 |
|
|
0.96 (0.53-1.75) |
0.90 |
|
|
| PCI variables
|
|
|
|
|
|
|
|
|
| Multivessel disease |
1.83 (1.57-2.14) |
<0.001 |
|
|
1.88 (1.68-2.10) |
<0.001 |
|
|
| ACS |
1.74 (1.48-2.04) |
<0.001 |
1.67 (1.41-1.99) |
<0.001 |
1.31 (1.17-1.46) |
<0.001 |
1.42 (1.27-1.60) |
<0.001 |
| Rota |
2.41 (1.73-3.36) |
<0.001 |
|
|
2.21 (1.71-2.86) |
<0.001 |
|
|
| Use of DES |
1.07 (0.91-1.25) |
0.44 |
|
|
1.03 (0.92-1.15) |
0.65 |
|
|
| Stent Diameter |
1.01 (0.92-1.10) |
0.90 |
|
|
1.01 (0.94-1.07) |
0.89 |
|
|
| Stent length |
0.99 (0.98-1.00) |
0.45 |
|
|
0.99 (0.99-1.01) |
0.44 |
|
|
Data are expressed as the Hazard ratio and 95% confidence interval. HR, hazard ratio; CI, confidence interval; SD, standard deviation; ref., reference; other abbreviations are same as Table1.
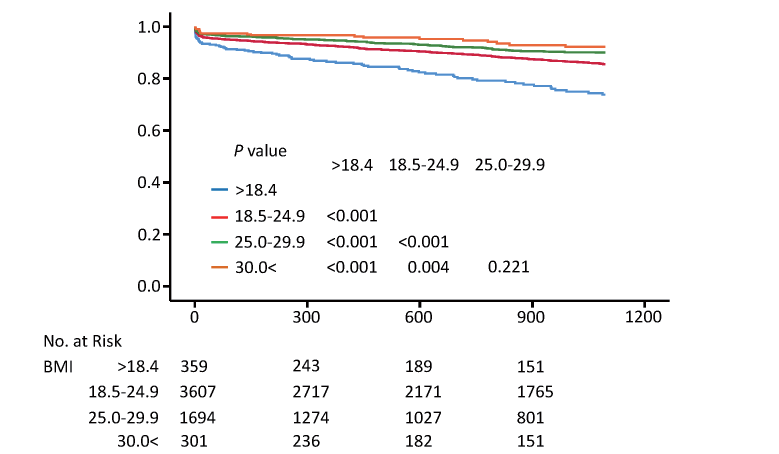
The Kaplan–Meier analysis showed a significantly higher incidence of primary endpoints in underweight patients compared with other BMI subsets (log-rank test, P<0.001 vs. BMI 18.5–24.9, P<0.001 vs. BMI 25.0–29.9, P<0.001 vs BMI >30.0) (Fig.2). Similar to the primary endpoint, there was a significantly higher incidence of secondary endpoints in underweight patients compared with other BMI subsets (log-rank test, P<0.001 vs. BMI 18.5–24.9, P<0.001 vs. BMI 25.0–29.9, P<0.001 vs. BMI >30.0) (Fig.3). On the other hand, there were no significant prognostic differences between overweight and obese patients in primary and secondary endpoints (Fig.2 and 3).
Stratified Risk Analysis according to BMI Levels Adjusted for the Multivariable Model
Supplemental Table 1 shows the crude analysis results before multivariable adjustment. Among the primary endpoints, the risk associated with underweight status was significantly more pronounced for male patients, those aged 60–74 years, and those with DM or ACS. Contrarily, the risk associated with underweight status was attenuated for female patients and those aged over 75 years (Table 4).
Supplemental Table 1.
Crude stratified COX proportional Hazard analysis according to BMI levels
|
BMI <18.5 |
BMI 18.5-24.9 |
BMI 25-29.9 |
BMI >30 |
| Primary endpoint
|
|
|
|
|
| Male |
2.17 (1.59-2.97)**
|
1.00 (Ref.) |
0.68 (0.55-0.84)**
|
0.52 (0.31-0.88)*
|
| Female |
1.67 (1.10-2.56)*
|
1.00 (Ref.) |
0.74 (0.47-1.18) |
0.74 (0.46-1.44) |
| Age 18-59 |
3.20 (1.13-9.06)*
|
1.00 (Ref.) |
0.67 (0.37-1.19) |
0.56 (0.22-1.45) |
| Age 60-74 |
2.74 (1.74-4.32)**
|
1.00 (Ref.) |
0.89 (0.65-1.24) |
0.79 (0.35-1.79) |
| Age ≥ 75 |
1.22 (0.90-1.67) |
1.00 (Ref.) |
0.85 (0.65-1.12) |
0.77 (0.36-1.63) |
| Hypertension |
1.69 (1.23-2.32)**
|
1.00 (Ref.) |
0.65 (0.52-0.82)**
|
0.35 (0.18-0.65)**
|
| Diabetes mellitus |
1.83 (1.23-2.72)**
|
1.00 (Ref.) |
0.64 (0.49-0.83)**
|
0.40 (0.21-0.76)**
|
| Current smoke |
1.67 (0.94-2.98) |
1.00 (Ref.) |
0.67 (0.46-0.98)*
|
0.60 (0.28-1.28) |
| Hemodialysis |
1.47 (0.78-2.80) |
1.00 (Ref.) |
0.55 (0.28-1.11) |
0.52 (0.13-2.11) |
| PAD |
0.64 (0.29-1.40) |
1.00 (Ref.) |
0.55 (0.29-1.02) |
0.53 (0.13-2.17) |
| Previous Stroke |
1.00 (0.36-2.77) |
1.00 (Ref.) |
0.84 (0.50-1.42) |
1.55 (0.62-3.91) |
| Low LVEF |
0.99 (0.64-1.57) |
1.00 (Ref.) |
0.80 (0.59-1.08) |
0.61 (0.29-1.30) |
| ACS |
1.75 (1.29-2.37)**
|
1.00 (Ref.) |
0.79 (0.62-1.00) |
0.58 (0.33-1.01) |
| Multivessel disease |
1.52 (1.08-2.14)*
|
1.00 (Ref.) |
0.71 (0.55-0.92)*
|
0.35 (0.16-0.73)**
|
| Secondary endpoint
|
|
|
|
|
| Male |
1.67 (1.29-2.16)**
|
1.00 (Ref.) |
0.82 (0.71-0.96)*
|
0.84 (0.62-1.15) |
| Female |
1.50 (1.10-2.04)*
|
1.00 (Ref.) |
0.72 (0.52-0.99)*
|
0.51 (0.24-1.08) |
| Age 18-59 |
1.59 (0.64-3.92) |
1.00 (Ref.) |
0.75 (0.53-1.06) |
0.66 (0.38-1.15) |
| Age 60-74 |
1.86 (1.31-2.65)**
|
1.00 (Ref.) |
1.03 (0.84-1.26) |
1.36 (0.82-1.94) |
| Age ≥ 75 |
1.23 (0.96-1.57) |
1.00 (Ref.) |
0.85 (0.68-1.05) |
0.99 (0.58-1.68) |
| Hypertension |
1.44 (1.13-1.84)**
|
1.00 (Ref.) |
0.77 (0.66-0.90)**
|
0.67 (0.48-0.93)*
|
| Diabetes mellitus |
1.67 (1.24-2.26)**
|
1.00 (Ref.) |
0.75 (0.63-0.90)**
|
0.64 (0.45-0.93)*
|
| Current smoke |
1.21 (0.73-1.98) |
1.00 (Ref.) |
0.85 (0.66-1.10) |
0.95 (0.60-1.51) |
| Hemodialysis |
1.04 (0.57-1.89) |
1.00 (Ref.) |
0.73 (0.44-1.22) |
0.70 (0.26-1.91) |
| PAD |
0.94 (0.53-1.67) |
1.00 (Ref.) |
0.80 (0.51-1.27) |
0.57 (0.18-1.82) |
| Previous Stroke |
1.30 (0.65-2.59) |
1.00 (Ref.) |
0.82 (0.54-1.23) |
1.30 (0.60-2.82) |
| Low LVEF |
1.31 (0.92-1.86) |
1.00 (Ref.) |
0.91 (0.71-1.16) |
0.95 (0.55-1.63) |
| ACS |
1.48 (1.15-1.90) **
|
1.00 (Ref.) |
0.84 (0.71-1.01) |
0.94 (0.67-1.33) |
| Multivessel disease |
1.44 (1.11-1.87) **
|
1.00 (Ref.) |
0.83 (0.69-0.99) *
|
0.75 (0.51-1.10) |
Data are expressed as the Hazard ratio and 95% confidence interval. *indicates P<0.05, **indicates P<0.01; BMI, body mass index; PAD, peripheral artery disease; LVEF, left ventricular ejection fraction; ACS, acute coronary syndrome.
Table 4.
Adjusted stratified COX proportional Hazard analysis according to BMI levels
|
BMI <18.5 |
BMI 18.5-24.9 |
BMI 25-29.9 |
BMI >30 |
| Primary Endpoint
|
|
|
|
|
| Male |
1.39 (1.07-1.81)*
|
1.00 (Ref.) |
1.02 (0.87-1.19) |
1.22 (0.89-1.69) |
| Female |
1.24 (0.90-1.72) |
1.00 (Ref.) |
0.80 (0.56-1.12) |
0.64 (0.28-1.47) |
| Age 18-59 |
1.25 (0.49-3.20) |
1.00 (Ref.) |
0.78 (0.53-1.14) |
0.73 (0.40-1.34) |
| Age 60-74 |
1.79 (1.26-2.56)**
|
1.00 (Ref.) |
1.10 (0.90-1.35) |
1.16 (0.74-1.81) |
| Age ≥ 75 |
1.12 (0.86-1.45) |
1.00 (Ref.) |
0.92 (0.73-1.15) |
1.12 (0.62-1.97) |
| Hypertension |
1.18 (0.92-1.53) |
1.00 (Ref.) |
0.94 (0.80-1.11) |
0.89 (0.55-1.18) |
| Diabetes mellitus |
1.59 (1.06-2.39)*
|
1.00 (Ref.) |
0.85 (0.63-1.13) |
0.61 (0.31-1.21) |
| Current smoke |
1.65 (0.90-3.03) |
1.00 (Ref.) |
1.04 (0.70-1.55) |
1.10 (0.48-2.60) |
| Hemodialysis |
1.47 (0.72-2.98) |
1.00 (Ref.) |
0.75 (0.37-1.54) |
0.98 (0.23-4.27) |
| PAD |
0.73 (0.33-1.64) |
1.00 (Ref.) |
0.59 (0.30-1.14) |
1.03 (0.24-4.51) |
| Previous Stroke |
0.69 (0.20-2.31) |
1.00 (Ref.) |
1.34 (0.75-2.41) |
1.88 (0.65-5.45) |
| Low LVEF |
1.04 (0.64-1.68) |
1.00 (Ref.) |
1.09 (0.78-1.53) |
0.96 (0.43-2.10) |
| ACS |
1.40 (1.01-1.94)*
|
1.00 (Ref.) |
1.21 (0.93-1.57) |
1.06 (0.60-1.86) |
| Multivessel disease |
1.34 (0.94-1.93) |
1.00 (Ref.) |
1.03 (0.79-1.36) |
0.54 (0.24-1.23) |
| Secondary Endpoint
|
|
|
|
|
| Male |
1.45 (1.11-1.89)**
|
1.00 (Ref.) |
1.01 (0.87-1.18) |
1.21 (0.88-1.66) |
| Female |
1.25 (0.91-1.73) |
1.00 (Ref.) |
0.76 (0.54-1.07) |
0.55 (0.24-1.25) |
| Age 18-59 |
1.77 (0.70-4.43) |
1.00 (Ref.) |
0.77 (0.53-1.12) |
0.72 (0.40-1.30) |
| Age 60-74 |
1.86 (1.31-2.66)**
|
1.00 (Ref.) |
1.08 (0.88-1.33) |
1.12 (0.72-1.74) |
| Age ≥ 75 |
1.09 (0.84-1.41) |
1.00 (Ref.) |
0.92 (0.73-1.15) |
0.98 (0.55-1.74) |
| Hypertension |
1.18 (0.92-1.52) |
1.00 (Ref.) |
0.94 (0.80-1.11) |
0.85 (0.60-1.19) |
| Diabetes mellitus |
1.49 (1.10-2.03)*
|
1.00 (Ref.) |
0.87 (0.72-1.06) |
0.80 (0.55-1.17) |
| Current smoke |
1.14 (0.68-1.92) |
1.00 (Ref.) |
1.07 (0.81-1.41) |
1.39 (0.84-2.30) |
| Hemodialysis |
1.13 (0.60-2.14) |
1.00 (Ref.) |
0.85 (0.51-1.43) |
0.99 (0.35-2.82) |
| PAD |
1.06 (0.59-1.90) |
1.00 (Ref.) |
0.82 (0.50-1.34) |
0.86 (0.26-2.84) |
| Previous Stroke |
1.14 (0.68-1.92) |
1.00 (Ref.) |
1.07 (0.81-1.41) |
1.39 (0.84-2.30) |
| Low LVEF |
1.38 (0.96-1.99) |
1.00 (Ref.) |
1.14 (0.87-1.49) |
1.33 (0.75-2.35) |
| ACS |
1.26 (0.97-1.64) |
1.00 (Ref.) |
1.07 (0.88-1.30) |
1.37 (0.96-1.95) |
| Multivessel disease |
1.31 (1.00-1.72)*
|
1.00 (Ref.) |
0.99 (0.82-1.19) |
0.99 (0.66-1.47) |
Data are expressed as the Hazard ratio and 95% confidence interval. *indicates P<0.05, **indicates P<0.01; HR, other abbreviations are same as Table1.
Among the secondary endpoints, the risk associated with underweight status was significantly pronounced for patients of male sex, aged 60–74 years, those with DM, and those with multivessel disease. Similar to the primary endpoint, the risk associated with underweight status was attenuated in female and elderly patients (Table 4).
Discussion
This study found that the risk associated with a low BMI significantly increased for patients who underwent PCI. Furthermore, a stratified analysis showed that the risk consistently associated with low BMI was significantly more pronounced for male patients, 60 to 74 years of age, and those with DM, among primary and secondary endpoints. These novel findings from the stratified analysis may suggest that patients with these risk factors may improve their prognoses by aggressive treatment after PCI to reduce the risk for underweight.
Low BMI was inversely associated with several common risk factors for atherosclerosis, which is consistent with previous studies15). As described, obesity has a close relationship with individual atherosclerosis risk factors; conversely, obese patients have lower mortality and cardiovascular risks than patients with low BMI, which is called the obesity paradox9). With the obesity paradox, there is a J-shape or U-shape association between BMI and mortality9). Whether the effect of low body weight on a poor prognosis is a cause or consequence remains a matter of debate; however, the existence of the obesity paradox is certain.
Additionally, the stratified analysis showed that, for the primary endpoint, the risk associated with low BMI was particularly pronounced for male patients, patients aged 60–74 years, and those with DM or ACS. Generally, female patients have lower BMI than male patients8). In other words, low BMI indicates an inherent risk for male patients. As a result, a poor prognosis may become apparent for male patients with low BMI. However, the effect of sex differences in the role of low BMI on the significant risk increase after PCI has not been fully explored.
Additionally, it has been reported that underweight male patients have a higher prevalence of cardiovascular risk than underweight female patients22). This evidence may have implications for the results of the present study.
The prevalence of frailty increases exponentially with age23). Simultaneously, the prevalence of comorbidities with diseases with poor prognoses, such as malignant cancers, infections, respiratory diseases, and chronic inflammatory disease, increases with age24). The increased prevalence of comorbidity masks the risk associated with underweight status among elderly patients. Furthermore, the risk associated with underweight status may be pronounced for patients aged 60–74 years.
Regarding the secondary endpoints and sex and age, DM and multivessel disease were independent risk factors for underweight status. In general, DM is more likely to be associated with overweight status and obesity. Although weight loss reduces the risk of DM among overweight and obese DM patients25), patients with DM have a paradoxically increased risk of underweight status after PCI. This is consistent with the results of a previous study indicating that the underweight group of DM patients was at higher risk for various adverse clinical events26).
Furthermore, a previous study reported a significant correlation of poor prognosis between acute MI and underweight status27) regarding the underweight patients with ACS. In this report, it is said that this result may be explained by the fact that patients with low BMI have reduced physiological reserve and may have a lower capacity to overcome changes in their physical condition after acute MI. Another report described this reason as follows; the reduced physiological reserve conditions were considered vulnerable to physical stress and may increase the risk for adverse clinical outcomes28).
Additionally, regarding the relationship between multivessel disease and underweight status, previous studies reported that the severity of coronary vessel lesion had inversed correlation with BMI levels29, 30). Moreover, coronary plaque was significantly vulnerable in underweight patients compared to other BMI subsets30). Among underweight patients with multivessel disease, these facts may affect the poor prognosis for secondary endpoint including revascularization and heart failure.
Because of the global aging society, the number of underweight patients with frailty should increase; therefore, it is important to consider the need for risk reduction and intervention for high-risk patients with coronary artery disease. Furthermore, it is important to accumulate knowledge of whether underweight status itself is the cause or result.
Study Limitations
This study had several limitations. First, it was not a randomized trial; therefore, the possibility of selection bias should be considered. In this sense, this study might have several bias and cofounders, even with multivariate analysis. Although the possibility of selection bias and potential confounders cannot be ruled out, the results of this study are consistent with those of several previous studies. Second, there was bias in the unmeasured confounding factors. Unfortunately, this study did not collect data about cancer because it aimed to analyze the prognosis of PCI patients. Some previous studies have reported that underweight status is associated with increased cancer risk31). However, as mentioned, an extremely low BMI had a significant impact on the prognosis for cancer; this might have affected the results of patients with low BMI. However, studies of the BMI of cancer patients also reported inconsistent results regarding the prognosis and BMI at the time of the cancer diagnosis32).
Furthermore, this study did not follow the weight history or BMI changes. Therefore, some patients who experienced weight loss caused by diseases may have been miscategorized in their BMI group, and a low BMI may reflect more advanced diseases. Some previous studies have reported the benefits of using the maximum BMI to decrease the reverse causation bias33, 34).
Finally, this study did not collect the status of frailty. Some previous studies reported the relationship between frailty and poor prognosis after PCI 35). Furthermore, other studies reported a significant correlation among frailty, low BMI, and mortality36). In this sense, frailty status may influence this study’s result.
Conclusions
In conclusion, underweight patients with several risk factors had significantly increased risk after PCI. Furthermore, the risk associated with low BMI was significantly more pronounced for men, individuals aged 60–74 years, and patients with DM or ACS.
Funding
This work was supported by JSPS KAKENHI grant numbers B2-19390209 and B-22390158.
Conflict of Interest
All authors declare no conflict of interest.
References
- 1) Manson JE., Willett WC, Stampfer MJ, Colditz GA, Hunter DJ, Hankinson SE, Hennekens CH, and Speizer FE. Body weight and mortality among women. N Engl J Med, 1995; 333: 677-685
- 2) Calle EE, Thun MJ, Petrelli JM, Rodriguez C, and Heath CW. Body-mass index and mortality in a prospective cohort of U.S. adults. N Engl J Med, 1999; 341: 1097-1105
- 3) Smith KB, and Smith MS. Obesity Statistics. Prim Care, 2016; 43: 121-135
- 4) Romero-Corral A, Montori VM, Somers VK, Korinek J, Thomas RJ, Allison TG, Mookadam F, and Lopez-Jimenez F. Association of bodyweight with total mortality and with cardiovascular events in coronary artery disease: a systematic review of cohort studies. Lancet, 2006; 368: 666-678
- 5) Obesity: preventing and managing the global epidemic. Report of a WHO consultation. World Health Organ Tech Rep Ser, 2000; 894: 1-253
- 6) Wang TY, Chen AY, Roe MT, Alexander KP, Newby LK, Smith SC, Bangalore S, Gibler WB, Ohman EM, and Peterson ED. Comparison of baseline characteristics, treatment patterns, and in-hospital outcomes of Asian versus non-Asian white Americans with non-ST-segment elevation acute coronary syndromes from the CRUSADE quality improvement initiative. Am J Cardiol, 2007; 100: 391-396
- 7) Sasazuki S, Inoue M, Tsuji I, Sugawara Y, Tamakoshi A, Matsuo K, Wakai K, Nagata C, Tanaka K, Mizoue T, Tsugane S, and Research Group for the Development and Evaluation of Cancer Prevention Strategies in Japan. Body mass index and mortality from all causes and major causes in Japanese: results of a pooled analysis of 7 large-scale cohort studies. J Epidemiol, 2011; 21: 417-430
- 8) Bhaskaran K, Dos-Santos-Silva I, Leon DA, Douglas IJ, and Smeeth L. Association of BMI with overall and cause-specific mortality: a population-based cohort study of 3·6 million adults in the UK. Lancet Diabetes Endocrinol, 2018; 6: 944-953
- 9) Ellis SG, Elliott J, Horrigan M, Raymond RE, and Howell G. Low-normal or excessive body mass index: newly identified and powerful risk factors for death and other complications with percutaneous coronary intervention. Am J Cardiol, 1996; 78: 642-646
- 10) Holroyd EW, Sirker A, Kwok CS, Kontopantelis E, Ludman PF, De Belder MA, Butler R, Cotton J, Zaman A, Mamas MA, and British Cardiovascular Intervention Society and National Institute of Cardiovascular Outcomes Research. The Relationship of Body Mass Index to Percutaneous Coronary Intervention Outcomes: Does the Obesity Paradox Exist in Contemporary Percutaneous Coronary Intervention Cohorts? Insights From the British Cardiovascular Intervention Society Registry. JACC Cardiovasc Interv, 2017; 10: 1283-1292
- 11) Oreopoulos A, Padwal R, Norris CM, Mullen JC, Pretorius V, and Kalantar-Zadeh K. Effect of obesity on short- and long-term mortality postcoronary revascularization: a meta-analysis. Obesity, 2008; 16: 442-450
- 12) Global BMI Mortality Collaboration, Di Angelantonio E, Bhupathiraju SN, Wormser D, Gao P, Kaptoge S, Berrington de Gonzalez A, Cairns BJ, Huxley R, Jackson CL, Joshy G, Lewington S, Manson JE, Murphy N, Patel AV, Samet JM, Woodward M, Zheng W, Zhou M, Bansal N, Barricarte A, Carter B, Cerhan JR, Smith GD, Fang X, Franco OH, Green J, Halsey J, Hildebrand JS, K. Jung J, Korda RJ, McLerran DF, Moore SC, O’Keeffe LM, Paige E, Ramond A, Reeves GK, Rolland B, Sacerdote C, Sattar N, Sofianopoulou E, Stevens J, Thun M, Ueshima H, Yang L, Yun YD, Willeit P, Banks E, Beral V, Chen Z, Gapstur SM, Gunter MJ, Hartge P, Jee SH, Lam TH, Peto R, Potter JD, Willett WC, Thompson SG, Danesh J, and Hu FB. Body-mass index and all-cause mortality: individual-participant-data meta-analysis of 239 prospective studies in four continents. Lancet, 2016; 388: 776-786
- 13) Gruberg L, Weissman NJ, Waksman R, Fuchs S, Deible R, Pinnow EE, Ahmed LM, Kent KM, Pichard AD, Suddath WO, Satler LF, and Lindsay J. The impact of obesity on the short-term and long-term outcomes after percutaneous coronary intervention: the obesity paradox? J Am Coll Cardiol, 2002; 39: 578-584
- 14) Herrmann J, Gersh BJ, Goldfinger JZ, Witzenbichler B, Guagliumi G, Dudek D, Kornowski R, Brener SJ, Parise H, Fahy M, McAndrew TC, Stone GW, and Mehran R. Body mass index and acute and long-term outcomes after acute myocardial infarction (from the Harmonizing Outcomes With Revascularization and Stents in Acute Myocardial Infarction Trial). Am J Cardiol, 2014; 114: 9-16
- 15) Steinberg BA, Cannon CP, Hernandez AF, Pan W, Peterson ED, and Fonarow GC. Medical therapies and invasive treatments for coronary artery disease by body mass: the “obesity paradox” in the Get With The Guidelines database. Am J Cardiol, 2007; 100: 1331-1335
- 16) Jang HY, and Kim JH. Factors Associated with Frailty According to Gender of Older Adults Living Alone. Healthcare, 2021; 9
- 17) Lee Y, Kim J, Han ES, Ryu M, Cho Y, and Chae S. Frailty and body mass index as predictors of 3-year mortality in older adults living in the community. Gerontology, 2014; 60: 475-482
- 18) UNDESA UN, Department of Economic and Social Affairs, Population Division (2019). World Population Prospects 2019: Data Booket
- 19) Horikoshi T, Nakamura T, Yoshizaki T, Nakamura J, Watanabe Y, Uematsu U, Makino A, Saito Y, Obata JE, Sawanobori T, Takano H, Umetani K, Watanabe A, Asakawa T, Sato A, and Kugiyama K. A Propensity Score Matched Analysis of Statin Effects on Major Adverse Cardiac Events after Percutaneous Coronary Intervention in Patients Over 75 Years Old. Internal Medicine, 2022; advpub
- 20) Expert Panel on Detection Ea, and Treatment of High Blood Cholesterol in Adults. Executive Summary of The Third Report of The National Cholesterol Education Program (NCEP) Expert Panel on Detection, Evaluation, And Treatment of High Blood Cholesterol In Adults (Adult Treatment Panel III). JAMA, 2001; 285: 2486-2497
- 21) Matsuo S, Imai E, Horio M, Yasuda Y, Tomita K, Nitta K, Yamagata K, Tomino Y, Yokoyama H, Hishida A, and Collaborators developing the Japanese equation for estimated GFR. Revised equations for estimated GFR from serum creatinine in Japan. Am J Kidney Dis, 2009; 53: 982-992
- 22) Consultation WE. Appropriate body-mass index for Asian populations and its implications for policy and intervention strategies. Lancet, 2004; 363: 157-163
- 23) Kojima G, Iliffe S, Taniguchi Y, Shimada H, Rakugi H, Walters K. Prevalence of frailty in Japan: A systematic review and meta-analysis. J Epidemiol, 2017; 27: 347-353
- 24) Pawelec G, Goldeck D, Derhovanessian E. Inflammation, ageing and chronic disease. Curr Opin Immunol, 2014; 29: 23-28
- 25) Mokdad AH, Ford ES, Bowman BA, Dietz WH, Vinicor F, Bales VS, and Marks JS. Prevalence of obesity, diabetes, and obesity-related health risk factors, 2001. JAMA, 2003; 289: 76-79
- 26) Lee Y, Kim J, Han ES, Ryu M, Cho Y, and Chae S. Obesity paradox in associations between body mass index and diabetes-related hospitalization and mortality in patients with type 2 diabetes: Retrospective cohort studies. Diabetes Metab, 2019; 45: 564-572
- 27) Su W, Wang M, Zhu J, Li W, Ding X, Chen H, Li HW, and Zhao XQ. Underweight Predicts Greater Risk of Cardiac Mortality Post Acute Myocardial Infarction. Int Heart J, 2020; 61: 658-664
- 28) Campbell A J, Buchner D M. Unstable disability and the fluctuations of frailty. Age Ageing, 1997; 26: 315-318
- 29) Kovacic JC, Lee P, Baber U, Karajgikar R, Evrard SM, Moreno P, Mehran R, Fuster V, Dangas G, Sharma SK, Kini AS. Inverse relationship between body mass index and coronary artery calcification in patients with clinically significant coronary lesions. Atherosclerosis, 2012; 221: 176-182
- 30) Kurihara O, Takano M, Mizuno K, Shibata Y, Matsushita M, Komiyama H, Kato K, Munakata R, Murakami D, Okamatsu K, Miyauchi Y, Hata N, Seino Y, Shimizu W. Relationship between Body Mass Index and Coronary Atherosclerosis Analyzed by Multivessel Angioscopic Study. Angioscopy, 2016; 2: 19-24
- 31) Inoue M, Sobue T, Tsugane S, and JPHC Study Group. Impact of body mass index on the risk of total cancer incidence and mortality among middle-aged Japanese: data from a large-scale population-based cohort study--the JPHC study. Cancer Causes Control, 2004; 15: 671-680
- 32) Greenlee H, Unger JM, LeBlanc M, Ramsey S, Hershman DL. Association between Body Mass Index and Cancer Survival in a Pooled Analysis of 22 Clinical Trials. Cancer Epidemiol Biomarkers Prev, 2017; 26: 21-29
- 33) Stokes A. Using maximum weight to redefine body mass index categories in studies of the mortality risks of obesity. Popul Health Metr, 2014; 12: 6
- 34) Yu E, Ley SH, Manson JE, Willett W, Satija A, Hu FB, and Stokes A. Weight History and All-Cause and Cause-Specific Mortality in Three Prospective Cohort Studies. Ann Intern Med, 2017; 166: 613-620
- 35) Murali-Krishnan R, Iqbal J, Rowe R, Hatem E, Parviz Y, Richardson J, Sultan A, and Gunn J. Impact of frailty on outcomes after percutaneous coronary intervention: a prospective cohort study. Open Heart, 2015; 2: e000294
- 36) Watanabe D, Yoshida T, Watanabe Y, Yamada Y, Kimura M, and Kyoto-Kameoka Study Group. A U-Shaped Relationship Between the Prevalence of Frailty and Body Mass Index in Community-Dwelling Japanese Older Adults: The Kyoto-Kameoka Study. J Clin Med, 2020; 9: 1367