Abstract
Aims: Thrombin exerts various pathophysiological functions by activating protease-activated receptors (PARs), and thrombin-induced activation of PARs promotes the development of non-alcoholic fatty liver disease (NAFLD). Since heparin cofactor II (HCII) specifically inactivates thrombin action, we hypothesized that plasma HCII activity correlates with the severity of NAFLD.
Methods: A cross-sectional study was conducted. Plasma HCII activity and noninvasive clinical markers of hepatic fibrosis including fibrosis-4 (FIB-4) index, NAFLD fibrosis score (NFS) and aspartate aminotransferase-to-platelet ratio index (APRI) were determined in 305 Japanese patients with type 2 diabetes mellitus (T2DM). The relationships between plasma HCII activity and the clinical markers were statistically evaluated.
Results: Multiple regression analysis including confounding factors showed that plasma HCII activity independently contributed to decreases in FIB-4 index (p<0.001), NFS (p<0.001) and APRI (p=0.004). In addition, logistic regression analysis for the prevalence of advanced hepatic fibrosis defined by the cutoff points of the clinical scores showed that plasma HCII activity was the sole and common negative factor for prevalence of advanced hepatic fibrosis (FIB-4 index: p=0.002, NFS: p=0.026 and APRI: p=0.012).
Conclusions: Plasma HCII activity was inversely associated with clinical hepatic fibrosis indices including FIB-4 index, NFS and APRI and with the prevalence of advanced hepatic fibrosis in patients with T2DM. The results suggest that HCII can serve as a novel biomarker for assessment of hepatic fibrosis of NAFLD in patients with T2DM.
See editorial vol. 30: 853-854
Introduction
Non-alcoholic fatty liver disease (NAFLD) includes non-alcoholic fatty liver (NAFL) and non-alcoholic steatohepatitis (NASH), and NASH can progress to cirrhosis and hepatocellular carcinoma. The prevalence of NAFLD has been increasing worldwide, and it is associated with components of metabolic syndrome including obesity, hyperglycemia, dyslipidemia, and hypertension1-3). In addition, it has been reported that NAFLD itself is an independent risk factor for the development of cardiovascular disease (CVD)4) and that NAFLD is associated with the prognosis of CVD independent of known risk factors5).
Although liver biopsy is the current gold standard method for staging hepatic fibrosis in patients with NAFLD, the procedure is too invasive for a first-line screening approach. In addition, histological lesions are unevenly distributed throughout the liver tissue and there is critical problem of possible interobserver and intraobserver variability in pathological diagnosis. Therefore, evaluating test accuracy with an imperfect reference standard such as a liver biopsy has the risk of underestimating NASH and hepatic fibrosis severity6). On the other hand, many noninvasive clinical scoring systems based on simple clinical or laboratory indices for estimating hepatic fibrosis have been developed. These scoring systems include fibrosis-4 (FIB-4) index7-9), NAFLD fibrosis score (NFS)10) and aspartate aminotransferase-to-platelet ratio index (APRI)11, 12). While histological fibrosis predicts disease progression, prognostication of NAFLD-related events using such noninvasive markers is an appealing alternative to liver biopsy, and direct comparisons have shown the ability of those noninvasive markers for risk stratification of patients with performance that is comparable to or even better than that of a liver biopsy13, 14).
Thrombin is a serine protease that plays an important role in the coagulation cascade pathway and it is also related to vascular inflammation through activation of thrombin receptors (known as protease activator receptors: PARs)15). Recent investigations have demonstrated that plasma levels of thrombin are increased in patients with obesity and NAFLD16, 17). Moreover, Kassel et al. showed that PAR-1 is required for liver inflammation and steatosis in mice fed a Western diet18).
Heparin cofactor II (HCII) is a serine protease inhibitor (i.e., a serpin) with a molecular weight of 65.6 kDa. HCII is synthesized by hepatocytes and secreted into the bloodstream at a concentration of approximately 1.0 µmol/L, and upon activation by binding to dermatan sulfate proteoglycans, it specifically inhibits thrombin activities in various tissue matrices19). We and others have shown that HCII exerts a negative impact on the development of CVDs20-24) and diabetic kidney disease represented by albuminuria25) and that it ameliorates insulin resistance26). Taken together, the results of studies indicate the possibility that HCII has a negative association with hepatic fibrosis of NAFLD through inactivation of thrombin action.
Aim
This study was designed to verify whether there is a correlation between plasma HCII activity and severity of NAFLD classified by noninvasive clinical indices including FIB-4 index, NFS and APRI in patients with type 2 diabetes.
Materials
Study Design, Subjects and Ethics Statement
This study was a cross-sectional study. We consecutively recruited 305 Japanese individuals (177 males and 128 females) who were outpatients or inpatients with type 2 diabetes mellitus (T2DM). The diagnosis of T2DM followed the criteria proposed by the report of the Expert Committee on the Diagnosis and Classification of Diabetes Mellitus27).
All of the subjects were older than 20 years of age and were recruited consecutively from the Department of Endocrinology and Metabolism of Tokushima University Hospital, the Anan Medical Center, Kondo Naika Hospital, and Minami Municipal National Insurance Hospital (Tokushima, Japan) between July 2017 and December 2020. The exclusion criteria for the patients with diabetes were as follows: 1) patients with advanced cancer, 2) patients with secondary diabetes such as steroid-induced diabetes or pancreatic diabetes, 3) patients who were pregnant, and 4) patients with advanced renal disease and a serum creatine level of >2.0 mg/dL.
All of the subjects enrolled in this study underwent a standardized interview and a physical examination. Current smokers were defined as subjects who had smoked within the past 2 years. Body mass index was calculated as an index of obesity. Blood pressure (BP) was measured twice in each participant in a sitting position using an automatic sphygmomanometer, and the BP values were averaged. Hypertensive patients were defined as those with systolic BP (SBP) of ≥ 140 mmHg and/or diastolic BP of ≥ 90 mmHg or those receiving antihypertensive agents. Patients with dyslipidemia were defined as those with a low-density lipoprotein cholesterol (LDL-C) level of ≥ 140 mg/dL, a triglyceride (TG) level of ≥ 150 mg/dL, a high-density lipoprotein cholesterol (HDL-C) level of <40 mg/dL, or those receiving lipid-lowering agents.
Our study followed the institutional guidelines of each hospital (Tokushima University Hospital, Anan Medical Center, Kondo Naika Hospital, and Minami Municipal National Insurance Hospital) and was approved by each hospital’s Institutional Review Board (ethics committees of Tokushima University Hospital (date of approval: July 20, 2020; approval ID 3760), of Anan Medical Center (date of approval: January 17, 2021; approval ID 6), of Kondo Naika Hospital (date of approval: November 25, 2021; approval ID: 2021-12), and of Minami Municipal National Insurance Hospital (date of approval: June December 10, 2021; approval ID: R3-1)). Prior informed consent was obtained from all patients according to the Declaration of Helsinki.
Biochemical Analyses
Blood samples were collected from each patient and used for determining blood cell counts, plasma glucose (PG), HbA1c, and serum biochemical parameters including LDL-C, TG, HDL-C, uric acid (UA), aspartate aminotransferase (AST), alanine aminotransferase (ALT), creatinine (Cr) and albumin (ALB). PG level and serum levels of LDL-C, TG, HDL-C, UA, AST, ALT, Cr and ALB were measured by enzymatic methods. HbA1c level was measured by the latex agglutination assay.
Measurements of Plasma Fibrinogen, Prothrombin Time-International Normalized Ratio (PT-INR) and Plasma HCII Activity
Blood was drawn and collected into a tube containing a 1/10 volume of 3.8% sodium citrate and was centrifuged at 2000×g for 20 minutes. Plasma was stored at −80℃ until use. Plasma fibrinogen concentrations were determined by performing thrombin coagulation tests. Prothrombin time-international normalized ratio (PT-INR) was determined by the coagulation time measurement method. Plasma HCII activities were measured on the basis of antithrombin activities in the presence of dermatan sulfate, which were determined using the Stachrom® HCII Assay Kit (Diagnostica Stago). The intra-assay and inter-assay coefficients of variation of this kit were 3.9% and 4.3%, respectively.
Determination of Severity of NAFLD Represented by FIB-4 Index, NFS and APRI
We used three clinical scoring systems including FIB-4 index, NFS and APRI for estimating hepatic fibrosis. Each index or score for assessment of the severity of NAFLD was determined by the following formulas.
*FIB-4 index=Age (years)×AST (U/L) / [platelet count (×109 / L)×√ALT (U/L)]7)
*NFS=-1.675+0.037×age (year)+0.094×BMI (kg/m2)+1.13×IFG/diabetes (yes=1, no=0)+0.99×AST / ALT ratio−0.013×platelet count (×109/L)−0.66×ALB (g/dL)10)
*APRI=100×AST (U/L) / upper limit of normal AST (U/L) / platelet count (×109/L)11)
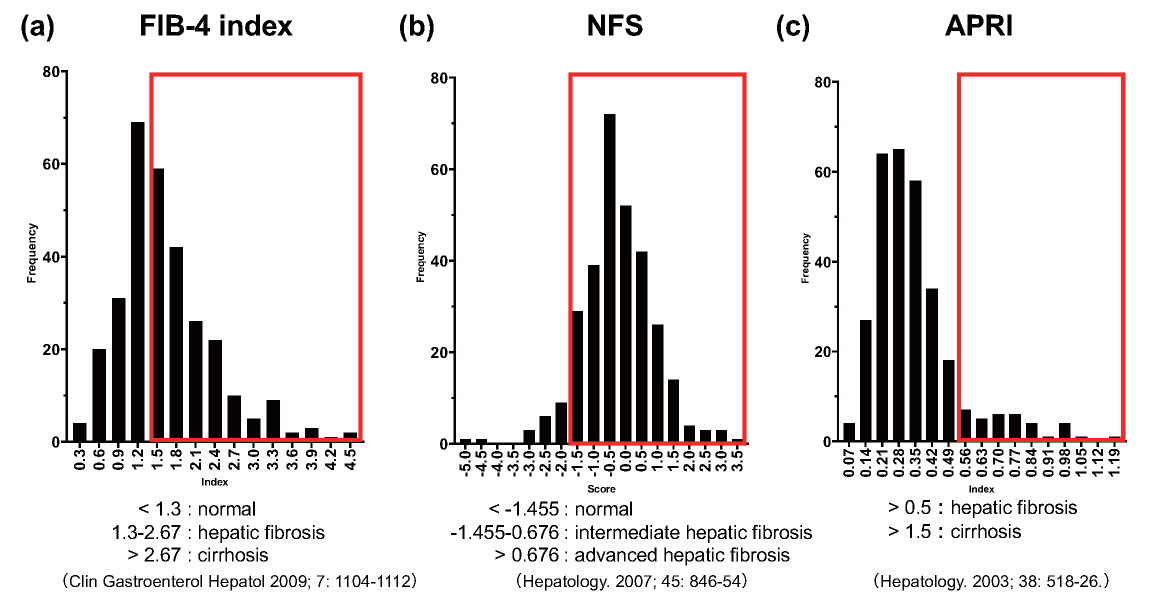
The proposed cutoff points of the clinical scores were as follows. Subjects with FIB-4 index <1.3 were considered as being at the lowest risk of hepatic fibrosis, subjects with FIB-4 index ≥ 1.3 to 2.67 were considered as having a moderate risk, and subjects with FIB-4 index >2.67 were classified as having a high risk of advanced hepatic fibrosis7). Subjects with NFS <-1.455 were classified as not having advanced hepatic fibrosis, subjects with NFS ≥ -1.455 to <0.676 were classified as having intermediate hepatic fibrosis, and subjects with NFS ≥ 0.676 were classified as having advanced hepatic fibrosis10). Subjects with APRI >0.5 were defined as having hepatic fibrosis and subjects with APRI >1.5 were defined as having cirrhosis11, 12).
Statistical Analysis
Continuous variables were averaged and expressed as means±standard deviation (SD). Categorical variables were compared by performing the χ2 test or Fisher’s exact test. For comparisons between two groups, we performed the Mann-Whitney U test or Student’s t-test for numeric variables depending on the variables’ distribution. The degrees of associations between the clinical markers of hepatic fibrosis (FIB-4 index, NFS and APRI) and each clinical variable including plasma HCII activity were determined by performing multivariate regression and logistic regression analyses. To determine optimal variables for the multivariate analyses, we selected general NAFLD risk factors, referring to previous studies28-30). In addition, to clarify the HCII contribution in an NAFLD condition, we also included ALB, PT-INR, and fibrinogen, which are useful variables to reflect hepatic synthesis capacity.
The analyses were performed by using GraphPad Prism 8 (GraphPad Software, San Diego, CA). A cutoff value for the detection of advanced hepatic fibrosis was determined by receiver operating characteristic (ROC) analysis using EZR (Saitama Medical Center, Jichi Medical University). The threshold for statistical significance was set at p<0.05.
Results
Characteristics of the Subjects
The physical and laboratory-determined characteristics of subjects enrolled in this study are shown in Table 1. On average, the females enrolled in this study had higher HDL-C levels than those in the males. The male patients showed higher casual PG levels and higher serum levels of UA and Cr than those in the female patients. No significant gender differences were observed in other biochemical and hemostatic factors including plasma HCII activity. The percentages of male patients who were current smokers and α glucosidase inhibitor users were significantly higher than the percentages of female patients. A greater percentage of female patients were statin users. The oral antidiabetic drug prescribing pattern in this study and the current prescribing situation in Japan31) were very similar.
Table 1.
Clinical Characteristics of the Subjects Enrolled in the Cross-Sectional Study
|
Total |
Male |
Female |
p value (Male vs Female)
|
| Number of Subjects |
305 |
177 |
128 |
|
| Age (years) |
66.5±10.9 |
65.1±11.2 |
68.3±10.1 |
0.026 |
| BMI (kg/m2)
|
25.6±4.8 |
25.4±4.7 |
25.9±5.0 |
0.324 |
| SBP (mmHg) |
131.2±16.6 |
131.6±16.8 |
130.5±16.2 |
0.625 |
| LDL-C (mg/dL) |
100.2±31.0 |
97.8±31.0 |
103.6±30.6 |
0.392 |
| TG (mg/dL) |
138.6±77.7 |
143.0±83.3 |
132.4±68.7 |
0.294 |
| HDL-C (mg/dL) |
54.7±14.1 |
52.3±14.5 |
58.1±12.8 |
<0.001 |
| Casual PG (mg/dL) |
151.7±52.9 |
160.0±57.1 |
140.4±43.9 |
0.001 |
| HbA1c (%) |
6.9±1.1 |
7.0±1.2 |
6.8±0.9 |
0.298 |
| UA (mg/dL) |
5.2±1.2 |
5.4±1.2 |
4.8±1.2 |
<0.001 |
| Cr (mg/dL) |
0.80±0.20 |
0.86±0.22 |
0.68±0.19 |
<0.001 |
| eGFR (ml/min/1.73m2)
|
73.4±20.2 |
74.4±20.9 |
72.1±19.0 |
0.624 |
| ALB (g/dL) |
4.20±0.30 |
4.20±0.36 |
4.16±0.33 |
0.217 |
| Plasma Fibrinogen (mg/dL) |
338.9±76.9 |
339.7±78.0 |
337.9±75.3 |
0.813 |
| PT-INR |
1.18±0.21 |
1.18±0.19 |
1.19±0.23 |
0.790 |
| Plasma HCII Activity (%)) |
94.4±17.9 |
94.0±18.1 |
95.0±17.5 |
0.472 |
| AST (U/L) |
24.9±12.1 |
25.3±13.3 |
24.2±10.0 |
0.725 |
| ALT (U/L) |
26.3±20.4 |
27.2±22.5 |
25.1±16.9 |
0.980 |
| Platelets (109/L)
|
221.8±56.4 |
216.9±53.4 |
228.6±59.5 |
0.090 |
| FIB-4 index |
1.64±0.75 |
1.67±0.83 |
1.60±0.61 |
0.864 |
| NFS |
-0.24±1.13 |
-0.24±1.16 |
-0.23±1.08 |
0.684 |
| APRI |
0.34±0.18 |
0.36±0.19 |
0.32±0.16 |
0.264 |
| Current Smoking (n, (%))
|
52 (17.0) |
48 (27.1) |
4 (3.1) |
<0.001 |
| Hypertension (n, (%))
|
215 (70.5) |
119 (67.2) |
96 (75.0) |
0.142 |
| Dyslipidemia (n, (%))
|
217 (71.1) |
118 (66.7) |
99 (77.3) |
0.042 |
| Duration of Diabetes (years) |
10.5±8.1 |
11.0±8.6 |
9.8±7.4 |
0.362 |
| ARB or ACEi (n, (%))
|
150 (49.2) |
78 (44.1) |
72 (56.3) |
0.036 |
| Ca blocker (n, (%))
|
130 (42.6) |
70 (39.5) |
60 (46.9) |
0.202 |
| β blocker (n, (%))
|
22 (7.2) |
9 (5.1) |
13 (10.2) |
0.068 |
| MR antagonist (n, (%))
|
7 (2.3) |
3 (1.7) |
4 (3.1) |
0.411 |
| Statin (n, (%))
|
147 (48.2) |
71 (40.1) |
76 (59.4) |
0.001 |
| Ezetimibe (n, (%))
|
19 (6.2) |
8 (4.5) |
11 (8.6) |
0.146 |
| Other Hypolipidemic Agents (n, (%))
|
16 (5.2) |
12 (6.8) |
4 (3.1) |
0.158 |
| Antiplatelet (n, (%))
|
36 (11.8) |
25 (14.1) |
11(8.6) |
0.089 |
| SU or Glinide (n, (%))
|
59 (19.3) |
33 (18.6) |
26 (20.3) |
0.716 |
| Metformin (n, (%))
|
150 (49.2) |
85 (48.0) |
65 (50.8) |
0.634 |
| DPP-4i (n, (%))
|
206 (67.5) |
119 (67.2) |
87 (68.0) |
0.892 |
| SGLT2i (n, (%))
|
68 (22.3) |
44 (24.9) |
24 (18.8) |
0.206 |
| αGI (n, (%))
|
66 (21.6) |
45 (25.4) |
21 (16.4) |
0.059 |
| Pioglitazone (n, (%))
|
21 (6.9) |
14 (7.9) |
7 (5.5) |
0.406 |
| Insulin (n, (%))
|
52 (17.0) |
34 (19.2) |
18 (14.1) |
0.238 |
| GLP-1RA (n, (%))
|
28 (9.2) |
15 (8.5) |
13 (10.2) |
0.616 |
The values are presented as mean±SD or n (%).
Abbreviations: ACEi; angiotensin-converting enzyme inhibitor, ALB; albumin, APRI; aspartate aminotransferase-to-platelet ratio index, ARB; angiotensin II receptor blocker, BMI; body mass index, Cr; creatinine, DPP-4i; dipeptidyl peptidase-4 inhibitor, eGFR; estimated glomerular filtration rate, FIB-4; fibrosis-4, GLP-1RA; glucagon-like peptide-1 receptor agonist, HbA1c; hemoglobin A1c, HDL-C; high-density lipoprotein cholesterol, LDL-C; low-density lipoprotein cholesterol, MR; mineral corticoid receptor, NFS; NAFLD fibrosis score, PG; plasma glucose; PT-INR; prothrombin time-international normalized ratio, SBP; systolic blood pressure, SGLT2i; sodium-glucose cotransporter 2 inhibitor, SU; sulfonyl urea, TG; triglyceride, αGI; alpha-glucosidase inhibitor
Approximately half of the subjects had a FIB-4 index greater than 1.3 and were presumed to have significant fibrosis. More than 60% of the subjects had NFS greater than -1.455 and were defined as having intermediate to advanced hepatic fibrosis. Approximately 10% of the subjects had APRI greater than 0.5 and were diagnosed as having hepatic fibrosis (Supplemental Fig.1).
Associations between Plasma HCII Activity and NAFLD Clinical Scores
Scatter plots between plasma HCII activity and each NAFLD clinical score are shown in Fig.1. Simple linear regression analysis showed that plasma HCII activity correlated negatively with FIB-4 index (p<0.001), NFS (p<0.001) and APRI (p=0.004). Multiple regression analysis showed that plasma HCII activity was found to be the sole negative factor against increments of these clinical scoring systems of NAFLD (FIB-4 index: p<0.001, NFS: p<0.001, APRI: p=0.005) (Table 2). Since it is well known that pharmacological interventions influence the severity of NAFLD in patients with diabetes, we next performed multiple regression analysis with the confirmed independent variables shown in Table 2 and the medications used in this study. Conclusively, plasma HCII activity remained a significant sole common negative factor against increment of the three NAFLD clinical scores regardless of the medications taken in the present study (FIB-4 index: p<0.001, NFS: p<0.001, APRI: p=0.004) (Table 3).
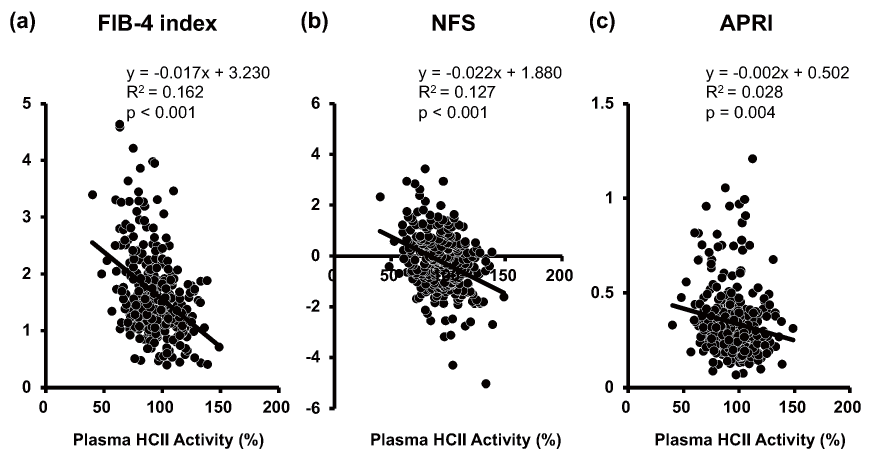
Table 2.
Multiple Regression Analysis for Determinants of NAFLD Clinical Scores
| Variables |
FIB-4 index |
NFS |
APRI |
| t value |
p value
|
t value |
p value
|
t value |
p value
|
| Age |
9.65 |
<0.001 |
11.77 |
<0.001 |
1.89 |
0.060 |
| Male |
2.70 |
0.007 |
1.87 |
0.063 |
2.47 |
0.014 |
| BMI |
1.30 |
0.195 |
8.89 |
<0.001 |
2.89 |
0.004 |
| SBP |
-0.27 |
0.785 |
0.07 |
0.942 |
-0.72 |
0.474 |
| LDL-C |
-1.29 |
0.198 |
-2.42 |
0.016 |
-0.02 |
0.984 |
| TG |
1.18 |
0.238 |
-0.11 |
0.913 |
1.55 |
0.122 |
| HDL-C |
4.04 |
<0.001 |
3.87 |
0.001 |
1.77 |
0.078 |
| HbA1c |
-1.69 |
0.092 |
-1.8 |
0.074 |
-0.07 |
0.947 |
| UA |
1.68 |
0.094 |
1.28 |
0.203 |
1.56 |
0.119 |
| Cr |
1.10 |
0.272 |
2.11 |
0.036 |
-0.86 |
0.389 |
| ALB |
-1.96 |
0.051 |
-4.2 |
<0.001 |
-0.78 |
0.435 |
| Plasma Fibrinogen |
0.27 |
0.789 |
0.33 |
0.742 |
-0.83 |
0.409 |
| PT-INR |
0.90 |
0.371 |
1.29 |
0.199 |
0.19 |
0.846 |
| Plasma HCII Activity |
-4.71 |
<0.001 |
-4.62 |
<0.001 |
-2.84 |
0.005 |
| Current Smoking |
-1.01 |
0.314 |
-0.05 |
0.961 |
-1.23 |
0.220 |
| Hypertension |
-2.00 |
0.047 |
-1.94 |
0.054 |
-0.65 |
0.519 |
| Dyslipidemia |
1.63 |
0.103 |
1.34 |
0.183 |
2.02 |
0.044 |
| Duration of Diabetes |
-1.62 |
0.107 |
-0.54 |
0.593 |
-1.46 |
0.146 |
Table 3.
Multiple Regression Analysis Including Identified Variables and Medications Used for Determinants of NAFLD Clinical Scores
| Variables |
FIB-4 index |
NFS |
APRI |
| t value |
p value
|
t value |
p value
|
t value |
p value
|
| Age |
8.98 |
<0.001 |
11.91 |
<0.001 |
1.04 |
0.300 |
| Male |
3.45 |
0.001 |
3.29 |
0.001 |
2.30 |
0.022 |
| BMI |
1.67 |
0.097 |
8.63 |
<0.001 |
3.60 |
0.001 |
| HDL-C |
3.99 |
<0.001 |
3.31 |
0.001 |
1.46 |
0.147 |
| LDL-C |
-0.59 |
0.556 |
-1.15 |
0.250 |
0.43 |
0.664 |
| ALB |
-1.85 |
0.065 |
-4.44 |
<0.001 |
-0.66 |
0.507 |
| Hypertension |
-1.04 |
0.300 |
-0.87 |
0.384 |
-0.75 |
0.452 |
| Plasma HCII Activity |
-4.97 |
<0.001 |
-4.92 |
<0.001 |
-2.91 |
0.004 |
| ARB or ACEi |
0.23 |
0.819 |
0.10 |
0.924 |
0.30 |
0.766 |
| Ca Blocker |
-0.98 |
0.327 |
-0.64 |
0.522 |
-0.80 |
0.424 |
| β blocker |
0.12 |
0.902 |
0.03 |
0.976 |
-1.56 |
0.121 |
| MR Antagonist |
-1.13 |
0.261 |
-1.17 |
0.242 |
-0.87 |
0.383 |
| Statin |
1.58 |
0.116 |
2.34 |
0.020 |
1.68 |
0.094 |
| Ezetimibe |
1.20 |
0.232 |
-0.25 |
0.801 |
1.86 |
0.064 |
| Other Hypolipidemic Agents |
0.19 |
0.847 |
-1.11 |
0.269 |
1.34 |
0.182 |
| Antiplatelet |
1.61 |
0.108 |
0.61 |
0.540 |
0.97 |
0.332 |
| SU or Glinide |
-0.87 |
0.384 |
-2.33 |
0.021 |
0.49 |
0.622 |
| Metformin |
-0.02 |
0.984 |
0.32 |
0.749 |
-0.65 |
0.520 |
| DPP-4i |
1.73 |
0.086 |
0.98 |
0.330 |
0.16 |
0.877 |
| SGLT2i |
-0.82 |
0.411 |
-0.42 |
0.673 |
-0.41 |
0.683 |
| αGI |
1.25 |
0.212 |
0.29 |
0.775 |
-1.38 |
0.170 |
| Pioglitazone |
0.25 |
0.806 |
0.02 |
0.988 |
0.15 |
0.884 |
| Insulin |
-0.06 |
0.954 |
1.38 |
0.168 |
-1.61 |
0.108 |
| GLP-1RA |
0.72 |
0.474 |
0.47 |
0.641 |
0.25 |
0.801 |
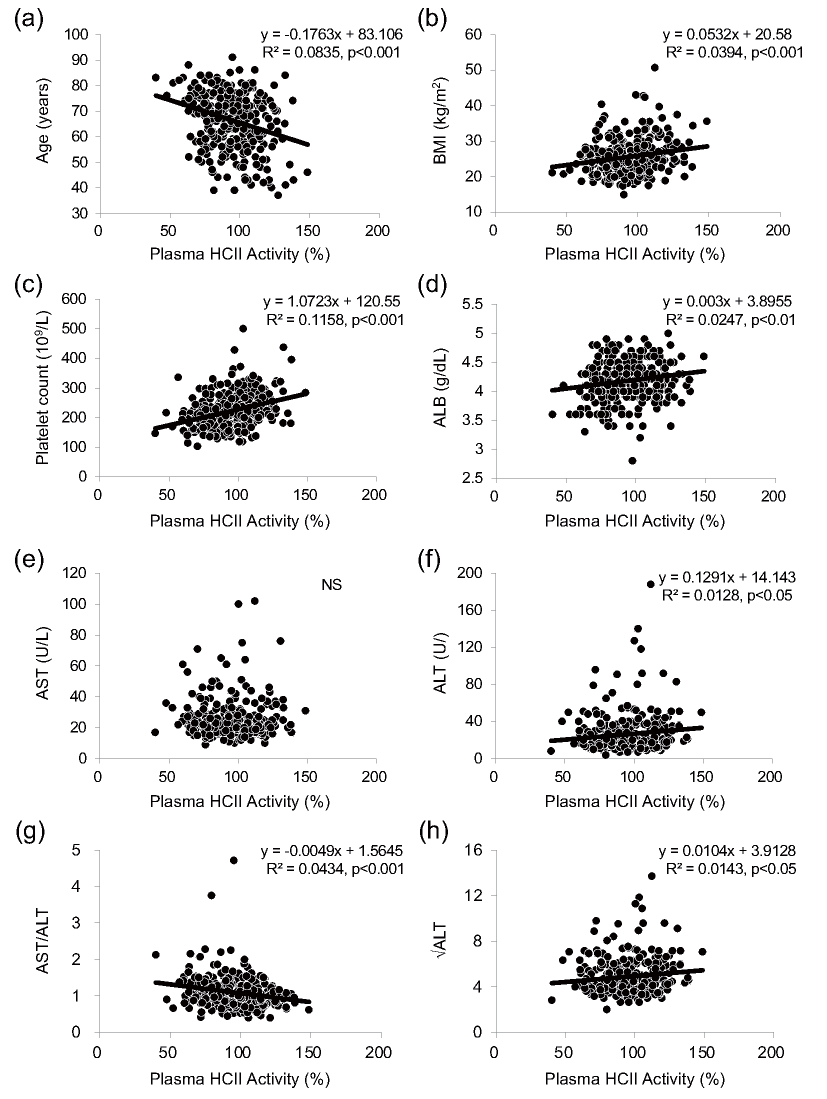
In addition, we evaluated the associations of plasma HCII activity with configuration factors of the formula for each clinical index by simple linear regression analysis and we found that plasma HCII activity had significant associations with age, BMI, platelet count, ALB, ALT, AST-to-ALT ratio and √ALT but not with AST (Supplemental Fig.2). However, multiple linear regression analysis showed no independent association of plasma HCII activity with AST or ALT (Supplemental Table 1). Since it was reported that only a small percentage of patients with steatosis or liver fibrosis had elevated levels of AST and ALT and since AST or ALT alone has been recognized as insufficient initial screening of NAFLD12), we speculate that HCII reflected the NAFLD clinical indices mainly via associations with age, platelet count and ALB but not with hepatic transaminases. Furthermore, the nonuniform relationships between plasma HCII activity and the clinical indices seemed to be related to formula differences in weighting of AST.
Supplemental Table1.
Multiple Regression Analysis for Determinants of AST and ALT
| Variables |
AST |
ALT |
| t value |
p value
|
t value |
p value
|
| Age |
0.97 |
0.330 |
-1.36 |
0.174 |
| Male |
1.98 |
0.049 |
1.34 |
0.181 |
| BMI |
3.23 |
0.001 |
4.22 |
<0.001 |
| SBP |
-0.84 |
0.400 |
-0.94 |
0.350 |
| LDL-C |
1.00 |
0.316 |
1.29 |
0.197 |
| TG |
2.01 |
0.046 |
1.93 |
0.054 |
| HDL-C |
1.23 |
0.220 |
-1.12 |
0.266 |
| HbA1c |
0.48 |
0.634 |
2.11 |
0.036 |
| UA |
1.83 |
0.069 |
1.52 |
0.129 |
| Cr |
-1.69 |
0.093 |
-1.68 |
0.095 |
| ALB |
-0.53 |
0.599 |
0.31 |
0.758 |
| Plasma Fibrinogen |
-0.72 |
0.471 |
-1.28 |
0.202 |
| PT-INR |
-0.18 |
0.858 |
-0.37 |
0.709 |
| Plasma HCII Activity |
-0.86 |
0.388 |
-0.27 |
0.785 |
| Current Smoking |
-1.50 |
0.135 |
-1.61 |
0.108 |
| Hypertension |
0.07 |
0.945 |
0.34 |
0.738 |
| Dyslipidemia |
0.97 |
0.331 |
0.66 |
0.512 |
| Duration of Diabetes |
-0.87 |
0.387 |
-0.33 |
0.744 |
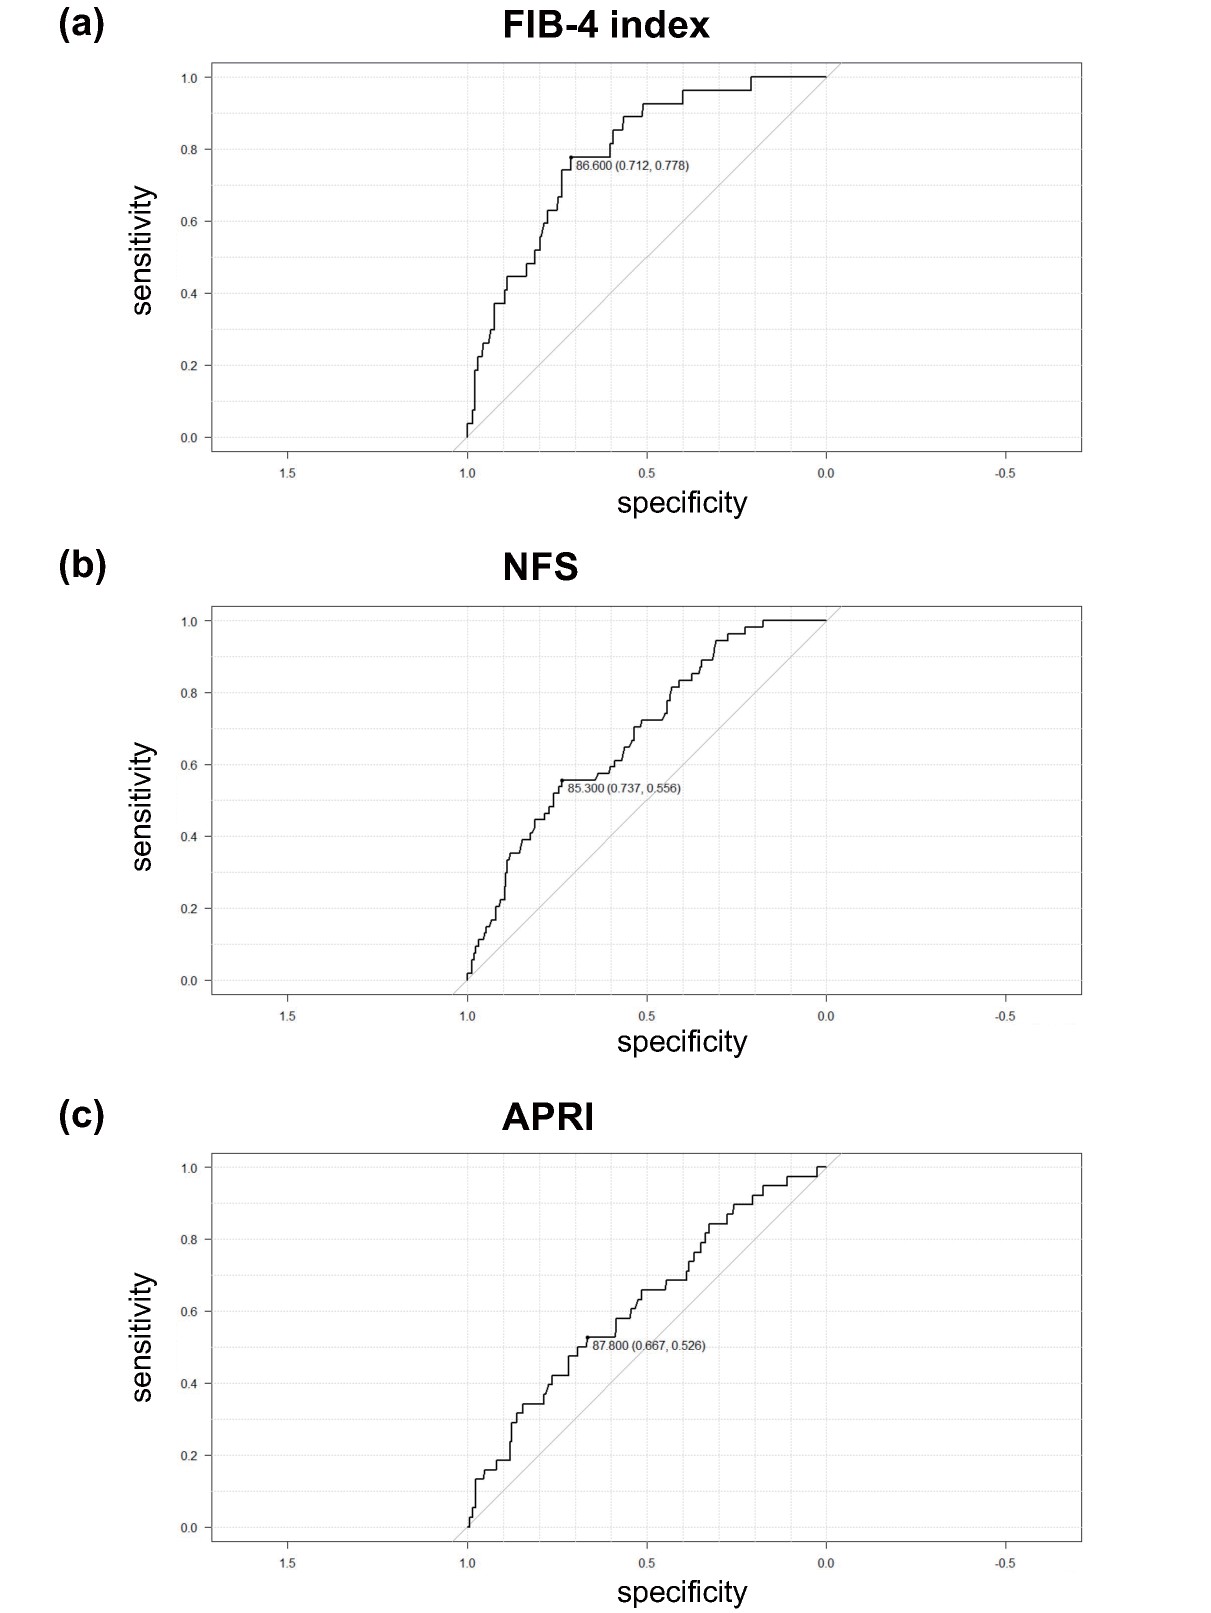
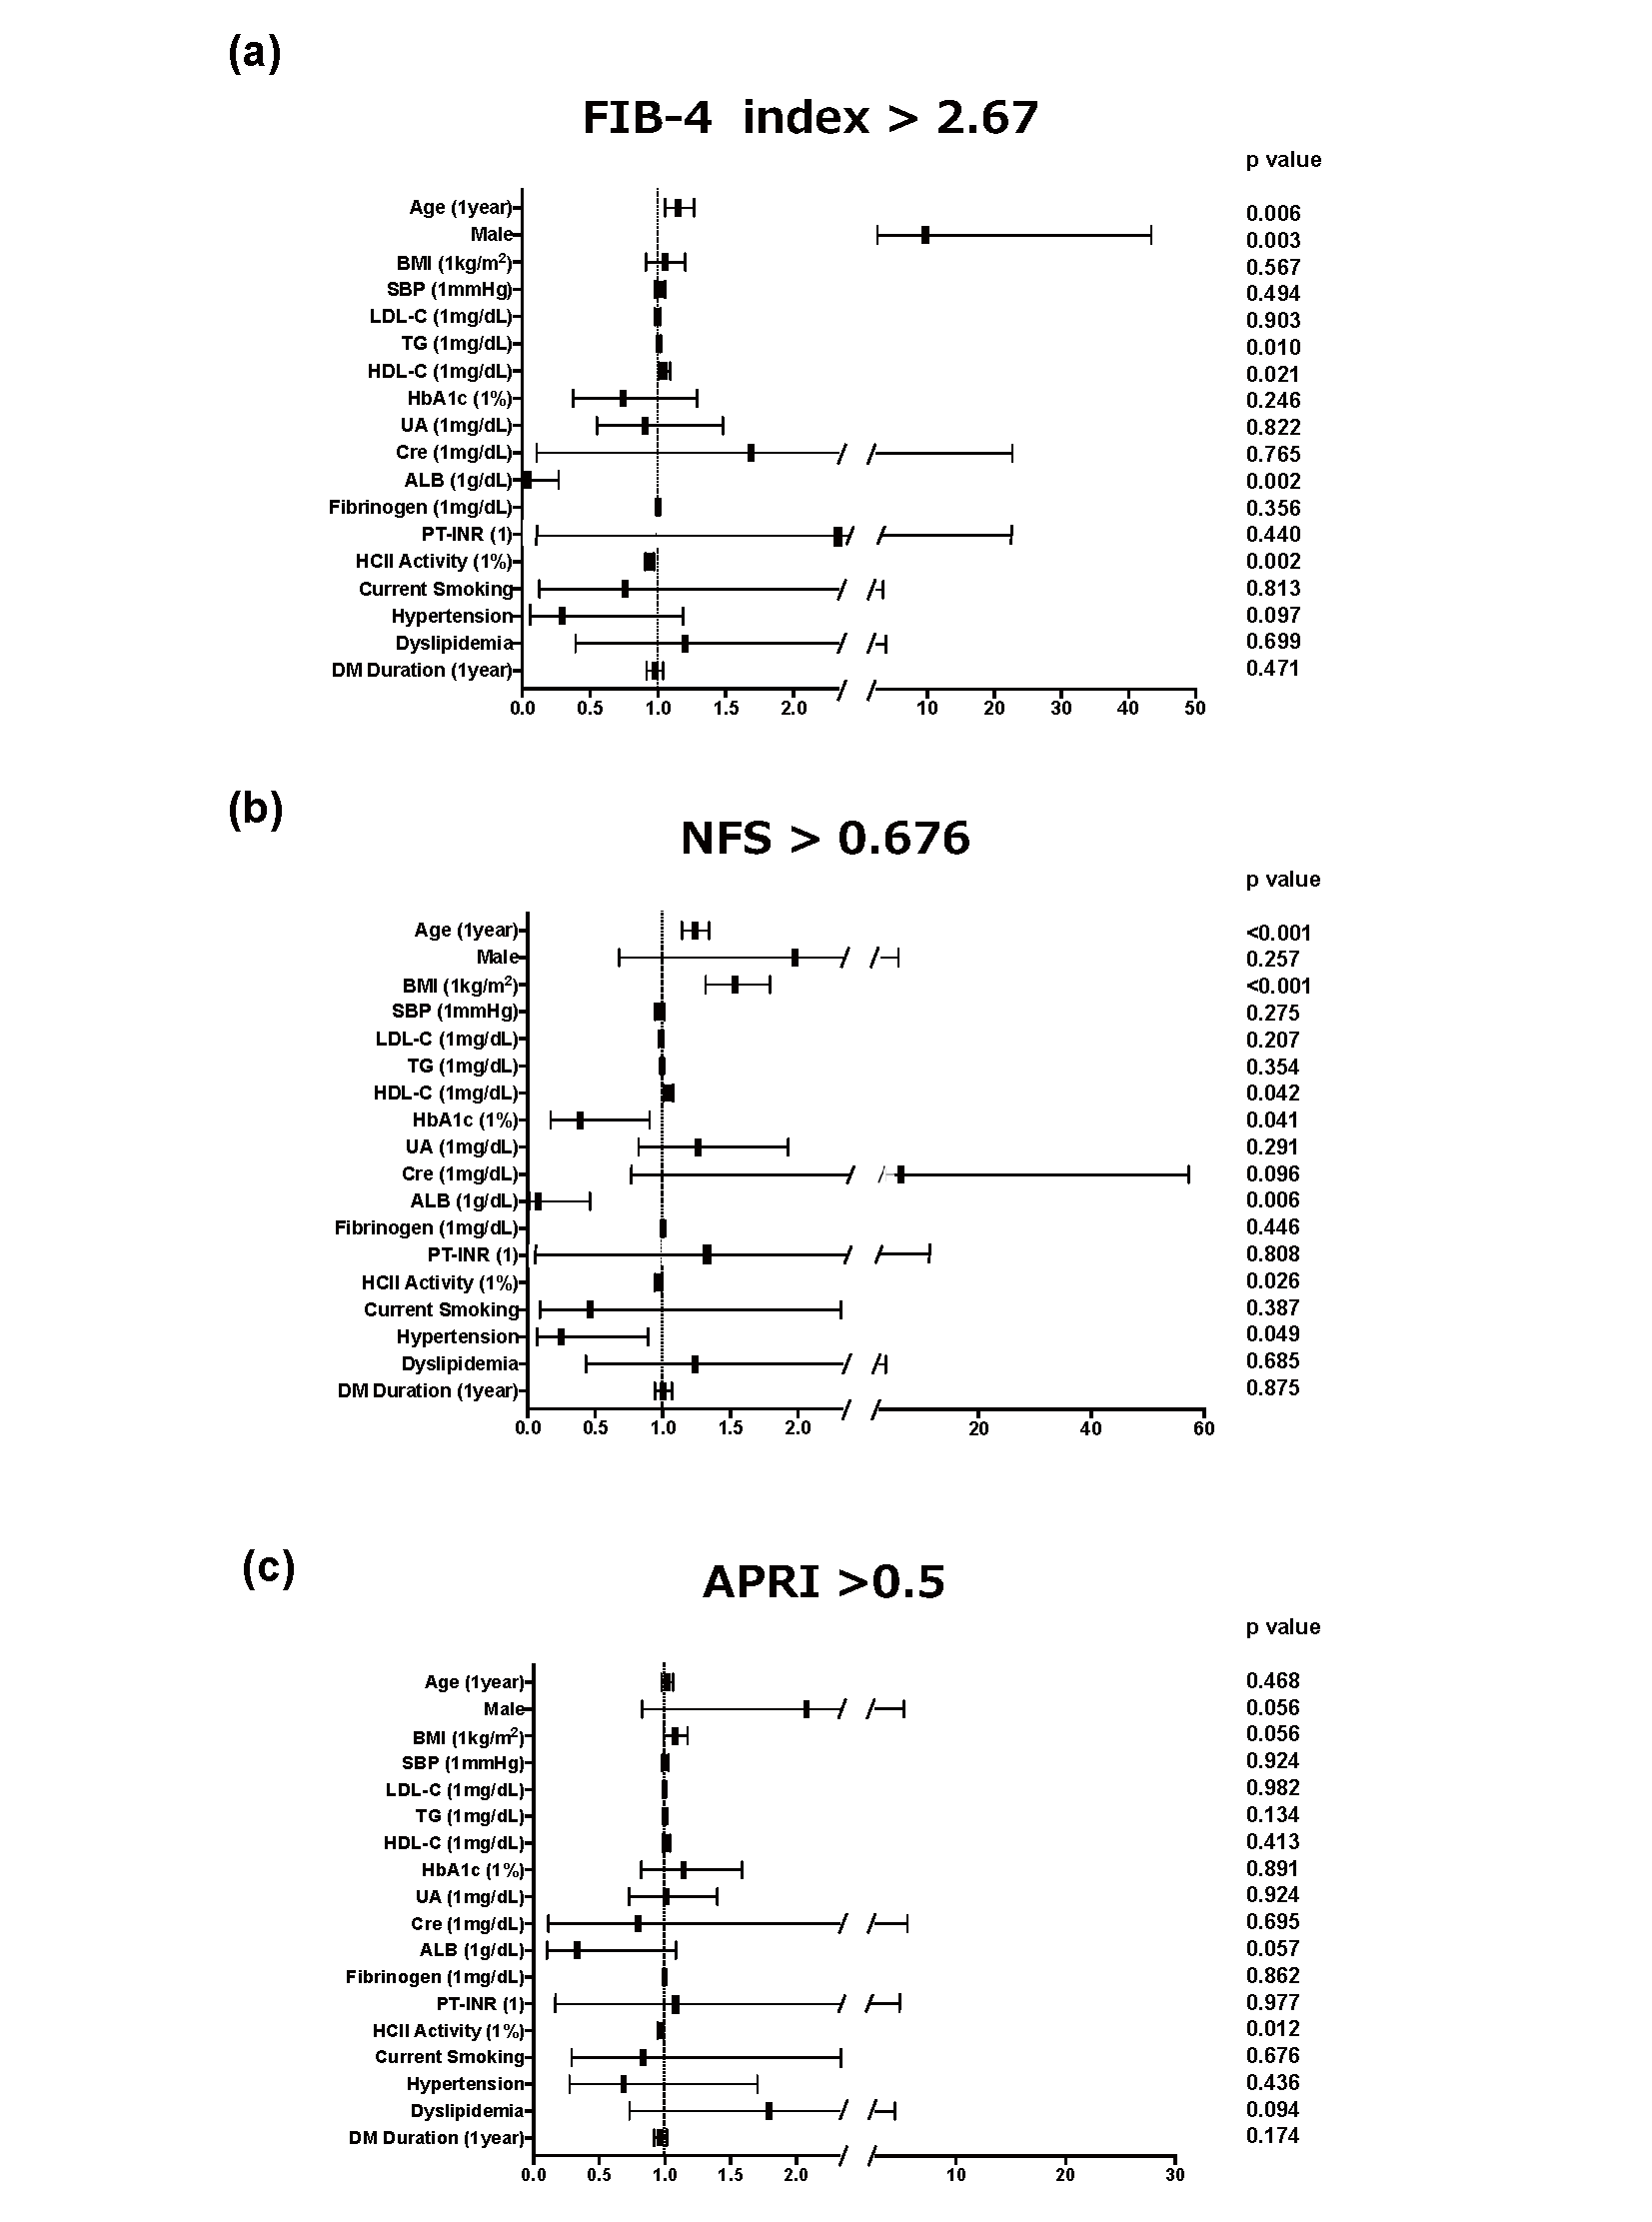
Next, we performed multiple logistic regression analysis to determine significant clinical factors for the detection of advanced hepatic fibrosis. The cutoff points we used were FIB-4 index greater than 2.67, NFS greater than 0.676 and APRI greater than 0.5, which indicate cirrhosis7), advanced hepatic fibrosis10) and hepatic fibrosis11), respectively. As shown in Fig.2, HCII was an independent and sole common negative factor for advanced hepatic fibrosis defined by the three indices (FIB-4 index: increase in odds ratio with plasma HCII at 1% activity to 0.946 (increase in odds ratio with HCII at 10% activity to 0.574), p=0.002; NFS: increase in odds ratio with plasma HCII at 1% activity to 0.971 (increase in odds ratio with HCII at 10% activity to 0.745), p=0.026; APRI: increase in odds ratio with plasma HCII at 1% activity to 0.971 (increase in odds ratio with HCII at 10% to 0.745), p=0.012). In addition, we performed ROC analysis to determine the optimal cutoff point for the detection of advanced hepatic fibrosis in each clinical index and found that the optimal cutoff points were ≤ 86.6% for FIB-4 index, ≤ 85.3% for NFS and ≤ 87.8% for APRI (Supplemental Fig.3).
Discussion
Previous studies have demonstrated that an aberrant coagulation state is closely associated with the development of NAFLD17, 32) and that patients with metabolic syndrome generate greater amounts of thrombin than do patients without metabolic syndrome33). Kopec et al. reported that mice fed a high-fat diet (HFD) showed hepatic inflammation with increased macrophage accumulation, increased hepatic fibrin deposition, and increasing plasma thrombin-antithrombin III complex levels, a stable marker of thrombin generation. In addition, treatment with dabigatran, which is a synthetic direct thrombin inhibitor, significantly reduced hepatic inflammation, hepatic fibrin deposition, hepatocellular injury, and steatosis in mice fed an HFD34). These findings are consistent with the notion that thrombin activation plays a pivotal role in the development of NAFLD. Kassel et al. reported that monocyte chemotactic protein 1 (MCP-1) plays a role in the development of hepatic steatosis and insulin resistance by causing infiltration of macrophages into adipose tissue or the liver18). In our previous study, we found that MCP-1 gene expression in 3T3-L1 adipocytes is markedly increased by thrombin treatment35). These observations suggest that thrombin-PAR system activation is associated with increased adiposity and enhanced expression of MCP-1 in the liver.
We generated heterozygous HCII-deficient mice and demonstrated that the mutant mice manifested exaggerated cardiovascular remodeling22, 36-38) and enhanced insulin resistance with increased gluconeogenesis26). In addition, we previously found that cuff injury and HFD feeding prominently augmented MCP-1 gene expression in arterial walls and in epidydimal fat of heterozygous HCII-deficient mice, respectively22, 26). Taken together, the results indicate the possibility that HCII is negatively involved in the pathogenesis of NAFLD via inactivation of the thrombin-MCP-1 axis.
Limitations
A limitation of this study is that the results cannot be extended to the general population because (i) we enrolled only patients with T2DM and (ii) we previously found that subjects without cardiovascular risk factors (including diabetes) had higher plasma HCII activity levels than those in subjects with one or more cardiovascular risk factors21, 26). Furthermore, because this study did not include imaging examinations to evaluate fibrosis and stiffness of the liver such as elastography using ultrasound or MRI, association analysis between plasma HCII activity and severity of liver stiffness evaluated by those noninvasive imaging devices would corroborate our hypothesis. Finally, since this cross-sectional study is not able to clarify the causal relationship between plasma HCII activity and the development of NAFLD, additional large-scale and longitudinal analysis is essential to clarify this clinical question.
Conclusion
The present study demonstrated that plasma HCII activity has an inverse association with the severity of NAFLD in patients with T2DM. In diabetic patients with low plasma HCII activity, early comprehensive intervention including lifestyle modifications and available pharmacological treatment might be needed for patients with T2DM who are suffering from NAFLD.
Acknowledgements
The authors are very grateful to Dr. Masashi Akaike, Dr. Shusuke Yagi, and Ms. Kazue Ishikawa for their help with this study. We would like to thank S.E.S Translation and Proofreading Services for English language editing.
Conflicts of Interest
K.A. has received research funding and speaker honoraria from Teijin Pharma Ltd., Nippon Boehringer Ingelheim Co., Ltd., and Ono Pharmaceutical Co., Ltd. M.A. received research funding from Teijin Pharma Ltd. and Ono Pharmaceutical Co., Ltd. No other potential conflicts of interest relevant to this article were reported.
Funding
This work was supported by Japan Society for the Promotion of Science (JSPS) KAKENHI Grant Number 22K08033 and a scholarship grant (TJNS20210506009) from Teijin Pharma, Ltd., a research grant (RS2021A000343586) from Nippon Boehringer Ingelheim Co., Ltd., a research grant from Taisho Pharmaceutical Co., Ltd and a research grant (ONOS20200609014) from Ono Pharmaceutical Co., Ltd.
References
- 1) Fan JG and Farrell GC: Epidemiology of non-alcoholic fatty liver disease in China. J Hepatol, 2009; 50: 204-210
- 2) Fan JG, Li F, Cai XB, Peng YD, Ao QH and Gao Y: The importance of metabolic factors for the increasing prevalence of fatty liver in Shanghai factory workers. J Gastroenterol Hepatol, 2007; 22: 663-668
- 3) Hamaguchi M, Kojima T, Takeda N, Nakagawa T, Taniguchi H, Fujii K, Omatsu T, Nakajima T, Sarui H, Shimazaki M, Kato T, Okuda J and Ida K: The metabolic syndrome as a predictor of nonalcoholic fatty liver disease. Ann Intern Med, 2005; 143: 722-728
- 4) Targher G, Day CP and Bonora E: Risk of cardiovascular disease in patients with nonalcoholic fatty liver disease. N Engl J Med, 2010; 363: 1341-1350
- 5) Maurantonio M, Ballestri S, Odoardi MR, Lonardo A and Loria P: Treatment of atherogenic liver based on the pathogenesis of nonalcoholic fatty liver disease: a novel approach to reduce cardiovascular risk? Arch Med Res, 2011; 42: 337-353
- 6) Lee J, Vali Y, Boursier J, Spijker R, Anstee QM, Bossuyt PM and Zafarmand MH: Prognostic accuracy of FIB-4, NAFLD fibrosis score and APRI for NAFLD-related events: A systematic review. Liver Int, 2021; 41: 261-270
- 7) Shah AG, Lydecker A, Murray K, Tetri BN, Contos MJ, Sanyal AJ and Nash Clinical Research N: Comparison of noninvasive markers of fibrosis in patients with nonalcoholic fatty liver disease. Clin Gastroenterol Hepatol, 2009; 7: 1104-1112
- 8) McPherson S, Stewart SF, Henderson E, Burt AD and Day CP: Simple non-invasive fibrosis scoring systems can reliably exclude advanced fibrosis in patients with non-alcoholic fatty liver disease. Gut, 2010; 59: 1265-1269
- 9) Sumida Y, Yoneda M, Hyogo H, Itoh Y, Ono M, Fujii H, Eguchi Y, Suzuki Y, Aoki N, Kanemasa K, Fujita K, Chayama K, Saibara T, Kawada N, Fujimoto K, Kohgo Y, Yoshikawa T, Okanoue T and Japan Study Group of Nonalcoholic Fatty Liver D: Validation of the FIB4 index in a Japanese nonalcoholic fatty liver disease population. BMC Gastroenterol, 2012; 12: 2
- 10) Angulo P, Hui JM, Marchesini G, Bugianesi E, George J, Farrell GC, Enders F, Saksena S, Burt AD, Bida JP, Lindor K, Sanderson SO, Lenzi M, Adams LA, Kench J, Therneau TM and Day CP: The NAFLD fibrosis score: a noninvasive system that identifies liver fibrosis in patients with NAFLD. Hepatology, 2007; 45: 846-854
- 11) Wai CT, Greenson JK, Fontana RJ, Kalbfleisch JD, Marrero JA, Conjeevaram HS and Lok AS: A simple noninvasive index can predict both significant fibrosis and cirrhosis in patients with chronic hepatitis C. Hepatology, 2003; 38: 518-526
- 12) Lomonaco R, Godinez Leiva E, Bril F, Shrestha S, Mansour L, Budd J, Portillo Romero J, Schmidt S, Chang KL, Samraj G, Malaty J, Huber K, Bedossa P, Kalavalapalli S, Marte J, Barb D, Poulton D, Fanous N and Cusi K: Advanced Liver Fibrosis Is Common in Patients With Type 2 Diabetes Followed in the Outpatient Setting: The Need for Systematic Screening. Diabetes Care, 2021; 44: 399-406
- 13) Sebastiani G, Alshaalan R, Wong P, Rubino M, Salman A, Metrakos P, Deschenes M and Ghali P: Prognostic Value of Non-Invasive Fibrosis and Steatosis Tools, Hepatic Venous Pressure Gradient (HVPG) and Histology in Nonalcoholic Steatohepatitis. PLoS One, 2015; 10: e0128774
- 14) Sanyal AJ, Harrison SA, Ratziu V, Abdelmalek MF, Diehl AM, Caldwell S, Shiffman ML, Aguilar Schall R, Jia C, McColgan B, Djedjos CS, McHutchison JG, Subramanian GM, Myers RP, Younossi Z, Muir AJ, Afdhal NH, Bosch J and Goodman Z: The Natural History of Advanced Fibrosis Due to Nonalcoholic Steatohepatitis: Data From the Simtuzumab Trials. Hepatology, 2019; 70: 1913-1927
- 15) Popovic M, Smiljanic K, Dobutovic B, Syrovets T, Simmet T and Isenovic ER: Thrombin and vascular inflammation. Mol Cell Biochem, 2012; 359: 301-313
- 16) Potze W, Siddiqui MS, Boyett SL, Adelmeijer J, Daita K, Sanyal AJ and Lisman T: Preserved hemostatic status in patients with non-alcoholic fatty liver disease. J Hepatol, 2016; 65: 980-987
- 17) Tripodi A, Fracanzani AL, Primignani M, Chantarangkul V, Clerici M, Mannucci PM, Peyvandi F, Bertelli C, Valenti L and Fargion S: Procoagulant imbalance in patients with non-alcoholic fatty liver disease. J Hepatol, 2014; 61: 148-154
- 18) Kassel KM, Owens AP, 3rd, Rockwell CE, Sullivan BP, Wang R, Tawfik O, Li G, Guo GL, Mackman N and Luyendyk JP: Protease-activated receptor 1 and hematopoietic cell tissue factor are required for hepatic steatosis in mice fed a Western diet. Am J Pathol, 2011; 179: 2278-2289
- 19) Aihara K: Heparin cofactor II attenuates vascular remodeling in humans and mice. Circ J, 2010; 74: 1518-1523
- 20) Takamori N, Azuma H, Kato M, Hashizume S, Aihara K, Akaike M, Tamura K and Matsumoto T: High plasma heparin cofactor II activity is associated with reduced incidence of in-stent restenosis after percutaneous coronary intervention. Circulation, 2004; 109: 481-486
- 21) Aihara K, Azuma H, Takamori N, Kanagawa Y, Akaike M, Fujimura M, Yoshida T, Hashizume S, Kato M, Yamaguchi H, Kato S, Ikeda Y, Arase T, Kondo A and Matsumoto T: Heparin cofactor II is a novel protective factor against carotid atherosclerosis in elderly individuals. Circulation, 2004; 109: 2761-2765
- 22) Aihara K, Azuma H, Akaike M, Ikeda Y, Sata M, Takamori N, Yagi S, Iwase T, Sumitomo Y, Kawano H, Yamada T, Fukuda T, Matsumoto T, Sekine K, Sato T, Nakamichi Y, Yamamoto Y, Yoshimura K, Watanabe T, Nakamura T, Oomizu A, Tsukada M, Hayashi H, Sudo T, Kato S and Matsumoto T: Strain-dependent embryonic lethality and exaggerated vascular remodeling in heparin cofactor II-deficient mice. J Clin Invest, 2007; 117: 1514-1526
- 23) Aihara K, Azuma H, Akaike M, Kurobe H, Takamori N, Ikeda Y, Sumitomo Y, Yoshida S, Yagi S, Iwase T, Ishikawa K, Sata M, Kitagawa T and Matsumoto T: Heparin cofactor II is an independent protective factor against peripheral arterial disease in elderly subjects with cardiovascular risk factors. J Atheroscler Thromb, 2009; 16: 127-134
- 24) Vicente CP, He L and Tollefsen DM: Accelerated atherogenesis and neointima formation in heparin cofactor II deficient mice. Blood, 2007; 110: 4261-4267
- 25) Hara T, Uemoto R, Sekine A, Mitsui Y, Masuda S, Kurahashi K, Yoshida S, Otoda T, Yuasa T, Kuroda A, Ikeda Y, Endo I, Honda S, Yoshimoto K, Kondo A, Tamaki T, Matsumoto T, Matsuhisa M, Abe M and Aihara KI: Plasma heparin cofactor II activity is inversely associated with albuminuria and its annual deterioration in patients with diabetes. J Diabetes Investig, 2021; 12: 2172-2182
- 26) Kurahashi K, Inoue S, Yoshida S, Ikeda Y, Morimoto K, Uemoto R, Ishikawa K, Kondo T, Yuasa T, Endo I, Miyake M, Oyadomari S, Matsumoto T, Abe M, Sakaue H and Aihara KI: The Role of Heparin Cofactor in the Regulation of Insulin Sensitivity and Maintenance of Glucose Homeostasis in Humans and Mice. J Atheroscler Thromb, 2017; 24: 1215-1230
- 27) American Diabetes A: 2. Classification and Diagnosis of Diabetes. Diabetes Care, 2016; 39 Suppl 1: S13-22
- 28) Friedman SL, Neuschwander-Tetri BA, Rinella M and Sanyal AJ: Mechanisms of NAFLD development and therapeutic strategies. Nat Med, 2018; 24: 908-922
- 29) Younossi Z, Anstee QM, Marietti M, Hardy T, Henry L, Eslam M, George J and Bugianesi E: Global burden of NAFLD and NASH: trends, predictions, risk factors and prevention. Nat Rev Gastroenterol Hepatol, 2018; 15: 11-20
- 30) Ioannou GN: Epidemiology and risk-stratification of NAFLD-associated HCC. J Hepatol, 2021; 75: 1476-1484
- 31) Yagi N, Komiya I, Arai K, Oishi M, Fukumoto Y, Shirabe S, Yokoyama H, Yamazaki K, Sugimoto H and Maegawa H: Current status of oral antidiabetic drug prescribing patterns based on the body mass index for Japanese type 2 diabetes mellitus patients and yearly changes in diabetologists’ prescribing patterns from 2002 to 2019 (JDDM61). J Diabetes Investig, 2022; 13: 65-73
- 32) Verrijken A, Francque S, Mertens I, Prawitt J, Caron S, Hubens G, Van Marck E, Staels B, Michielsen P and Van Gaal L: Prothrombotic factors in histologically proven nonalcoholic fatty liver disease and nonalcoholic steatohepatitis. Hepatology, 2014; 59: 121-129
- 33) Fritsch P, Kleber M, Rosenkranz A, Fritsch M, Muntean W, Mangge H and Reinehr T: Haemostatic alterations in overweight children: associations between metabolic syndrome, thrombin generation, and fibrinogen levels. Atherosclerosis, 2010; 212: 650-655
- 34) Kopec AK, Joshi N, Towery KL, Kassel KM, Sullivan BP, Flick MJ and Luyendyk JP: Thrombin inhibition with dabigatran protects against high-fat diet-induced fatty liver disease in mice. J Pharmacol Exp Ther, 2014; 351: 288-297
- 35) Mihara M, Aihara K, Ikeda Y, Yoshida S, Kinouchi M, Kurahashi K, Fujinaka Y, Akaike M and Matsumoto T: Inhibition of thrombin action ameliorates insulin resistance in type 2 diabetic db/db mice. Endocrinology, 2010; 151: 513-519
- 36) Ikeda Y, Aihara K, Yoshida S, Iwase T, Tajima S, Izawa-Ishizawa Y, Kihira Y, Ishizawa K, Tomita S, Tsuchiya K, Sata M, Akaike M, Kato S, Matsumoto T and Tamaki T: Heparin cofactor II, a serine protease inhibitor, promotes angiogenesis via activation of the AMP-activated protein kinase-endothelial nitric-oxide synthase signaling pathway. J Biol Chem, 2012; 287: 34256-34263
- 37) Sumitomo-Ueda Y, Aihara K, Ise T, Yoshida S, Ikeda Y, Uemoto R, Yagi S, Iwase T, Ishikawa K, Hirata Y, Akaike M, Sata M, Kato S and Matsumoto T: Heparin cofactor II protects against angiotensin II-induced cardiac remodeling via attenuation of oxidative stress in mice. Hypertension, 2010; 56: 430-436
- 38) Ise T, Aihara K, Sumitomo-Ueda Y, Yoshida S, Ikeda Y, Yagi S, Iwase T, Yamada H, Akaike M, Sata M and Matsumoto T: Plasma heparin cofactor II activity is inversely associated with left atrial volume and diastolic dysfunction in humans with cardiovascular risk factors. Hypertens Res, 2011; 34: 225-231