Original Article
Continuous and Marked Increase of Japanese HDL Associates Paradoxically with their Nutritional Shift
2023 Volume 30 Issue 8 Pages 919-933


Details
2023 Volume 30 Issue 8 Pages 919-933
Aims: Plasma HDL has evidently increased for decades among Japanese, exclusively in HDL particles containing apoA-I but not A-II. Its metabolic background is yet to be elucidated.
Methods: Trends in plasma lipoproteins were analyzed by examining data on total cholesterol, triglyceride and HDL-cholesterol, which are available in the public database of the National Health and Nutrition Examination Survey of Japan (NHNESJ) and in the clinical data of SRL Co., from 1989 to 2019, estimating cholesterol (C) in non-HDL, VLDL, LDL, and sub-fractions of LDL using the equations by Sampson et al. Food intake and supply data in NHNSJ and in the UN Food and Agriculture Organization were also analyzed in relation to the lipoprotein analysis.
Results: HDL-C levels showed a steady increase in men and women throughout the period as per the data retrieved in NHNSJ and SRL data. It is noted to be higher in women than men (from 46.8 to 52.7, and from 58.4 to 68.3 in mg/dl, respectively). Triglyceride and VLDL-C were higher in men but sex difference was not apparent in non-HDL-C and LDL-C levels, while these parameters slightly decreased in both sexes. The increase in HDL was most prominent in women in the age of 50 - 59 (from 57.0 to 73.4). The age-dependent HDL trend was reversed among women during the study period, as increasing instead of decreasing. This increase in HDL was found to coincide with lowered fish/meat ratio in food intake among Japanese.
Conclusion: Marked increase in plasma HDL among Japanese is age- and sex-dependent and exhibited an apparent paradoxical association with lowered fish/meat ratio in their diet. Further investigation is required to elucidate the background for these findings.
See editorial vol. 30: 861-862
Abbreviations: HDL-C, HDL cholesterol; NHNESJ, National Health and Nutrition Examination Survey of Japan; UNFAO, United Nations Food and Agriculture Organization; apolipoprotein, apo; LpAI, HDL containing apoA-I but not apoA-II; LpAI:AII, HDL containing both apoA-I and apoA-II; VLDL-C, LDL-C, lbLDL-C and sdLDL-C, cholesterol contents of VLDL, LDL, large buoyant and small dense LDLs, respectively
Plasma HDL concentration is a widely-recognized negative risk factor for atherosclerotic diseases including coronary heart diseases while increase in LDL is a positive risk factor. Lowering LDL levels has been shown to reduce the risk and the treatment of elevated LDL-concentration thus becoming one of the standard approach for atherosclerosis risk management. In the populations like Japanese where elevated LDL may not be a leading risk for atherosclerosis but low HDL may contribute more, increasing plasma HDL is hoped to achieve more efficient outcome in the risk reduction1). However, raising HDL-cholesterol (HDL-C) has failed to be proven as a risk reduction strategy for atherosclerosis2, 3). Some epidemiological data indicated very high plasma HDL-C may even be a positive atherosclerosis risk4-7). One of the reasons for this is that metabolism of HDL is more complicated and involves many more factors than that of LDL and therefore it is difficult to set an appropriate or optimum target(s) for intervention. Thus, a role of HDL is still puzzling in its relation to atherogenesis.
Substantial and steady increase in plasma HDL-C was noted among Japanese for over two decades, as reported in 2014 8). This trend was confirmed in several data sets from various cohort studies including that of National Health and Nutrition Examination Survey of Japan (NHNESJ). The change was unlikely to be the artifacts caused by change of HDL-C assay systems as the trend remained the same without discontinuity synchronizing with introduction of any new HDL-C assay method and the similar trend was confirmed in plasma apolipoprotein (apo) A-I concentration1, 8). The trend remained to reach the increase as much as 10 % and 15 % in men and women, respectively, for 25 years9). This increased already-high Japanese HDL levels further nearing 70 mg/dL in women1). Interestingly, this increase was only noted in apoA-I, but not apoA-II which rather decreased. Accordingly, LpAI (HDL containing apoA-I but not apoA-II)10) has almost doubled while LpAI:AII (HDL containing the both) tended to decrease during this period in Japan11). The trend of plasma HDL elevation is also observed in some other regions and countries but the extent of the increase was at most a few percent for decades in most of these countries except for a few like New Zealand, Switzerland and United Kingdom, much less than Japan9, 11-15). No specific factor has been identified for the background to account for this peculiar change in lipoprotein metabolism among Japanese. It is yet to be known whether these mysterious findings are beneficial for Japanese public health.
The Ministry of Health, Labor and Welfare of Japan has annually conducted NHNESJ since 1946, a comprehensive nationwide survey of health and nutritional parameters of up to 5000 subjects randomly selected, in which plasma lipid and lipoprotein data are available since 1989. A commercial clinical laboratory SRL also gathers the data on lipid and lipoproteins for years. These data have been accessed for investigation as regards HDL increase to find any specific factor to account for its background mechanism.
The results of the NHNESJ are published by National Health and Nutritional Institute and the data regarding lipid and lipoprotein were made available since 1989 16), total cholesterol, HDL-C and triglyceride, as the average and standard deviation for the whole surveyed population, men and women and those in each age group. The data excluding the subjects taking lipid-related drugs are also available since 2003. The lipid data from clinical laboratory since 1984 were provided by SRL Co11) as of those for men and women. The food intake data in NHNESJ are based on individual eating record and available as the average and standard deviation for men and women since 1960 and their age group breakdown since 1995 17). Food supply data are also made available for individual nations in United Nations Food and Agriculture Organization (UNFAO) data base18). The data for fishery and meat products were extracted from these databases. Percentage of drinkers and smokers was also examined being acquired from the NHNESJ data base16, 17) as those who regularly drink more than 180 ml saké or equivalent and those who have a habit of regular smoking, respectively, according to the questionnaire survey as far as available. Body mass index (BMI) data was also extracted from the NHNESJ data16, 17).
Processing of the Database DataThe average values were used for analysis. Non-HDL-C was calculated as total cholesterol minus HDL-C. Cholesterol contents of VLDL, LDL, and large buoyant and small dense LDLs (VLDL-C, LDL-C, lbLDL-C and sdLDL-C, respectively) were calculated from the plasma lipid data according to the equations recently proposed by Sampson et al.19) and validated for HPLC analysis20). The data sets available for analysis were those of average values but not individual values of measurement. Therefore, changes and differences were not subjects of general statistical analysis. Chronological trends were described by regression and correlation coefficients of these average values. Therefore, the conclusions are all observational and descriptive. The protocol was approved by Chubu University Ethics committee for Studies on Human Resources (approval #20200021).
Chronological profile of plasma lipid and lipoproteins of Japanese men and women are illustrated in Fig.1 and Fig.2, as per the NHNESJ and SRL data. The former data are shown as average of the whole cohort population and of those who were not taking lipid-related medication separately. Fig.1 shows the substantial and continuous increase in HDL-C in both men and women over the period the data are available for, both in all NHNESJ and SRL data sets. Excluding the data with lipid-related medication does not cause significant difference; thus, the finding seems unrelated to the wide use of such medications. The average HDL-C increased from 51.5 to 57.5 mg/dl and from 58.2 to 68.2 mg/dl by 6 and 10 mg/dl or 12 and 17 % in men and women, respectively, for the period of analysis of 30 years. In contrast, non-HDL-C, a parameter for apoB-containing lipoprotein, shows neither difference between men and women nor chronological trend of change for the period where HDL-C substantially increased. Plasma triglyceride was found to be higher in men than women by some 30 mg/dl, showing no apparent trend of change during the study period.

Top, HDL-C; middle nonHDL-C (TC – HDL-C); bottom, triglyceride. NHNESJ data are shown for all the subjects and those excluding the ones taking lipid-related medications. In linear regression lines, x is year and y is HDL-C (mg/dL) with r2 values.

In linear regression lines, x is year and y is HDL-C (mg/dL) with r2 values.
Fig.2 demonstrates chronological trend of in LDL-C, VLDL-C, lbLDL-C and sdLDL-C estimated according to calculation proposed by Sampson et al.19). LDL-C showed neither difference between sexes nor apparent trend of increase or decrease during the period of time for the study. VLDL-C was found to be high in men by 6 mg/dl from women, reflecting the difference in triglyceride. On the other hand, women had higher level of lbLDL-C and lower sdLDL-C level apparently reflecting higher triglyceride in men.
Age-Specific Change in HDL-CIncrease in HDL-C was further analyzed with respect to breakdown by age group of 20-29, 30-39, 40-49, 50-59, 60-69 and above 70 years old for men and women. The results are demonstrated in Fig.3. The increase in HDL-C was not apparent in the age group of 20-19 both in men and women, and the rate of increase gets higher as age advances. The highest increase rate was reached at the age group of 50-59, and the rate gradually declined in the age groups of 60-69 and over 70. The highest increase was by 7.9 and 16.5 mg/dl or 15 % and 29 % for the period in men and women in the age group of 50-59, reaching the average HDL-C as high as 59.2 and 73.4 mg/dl, respectively.
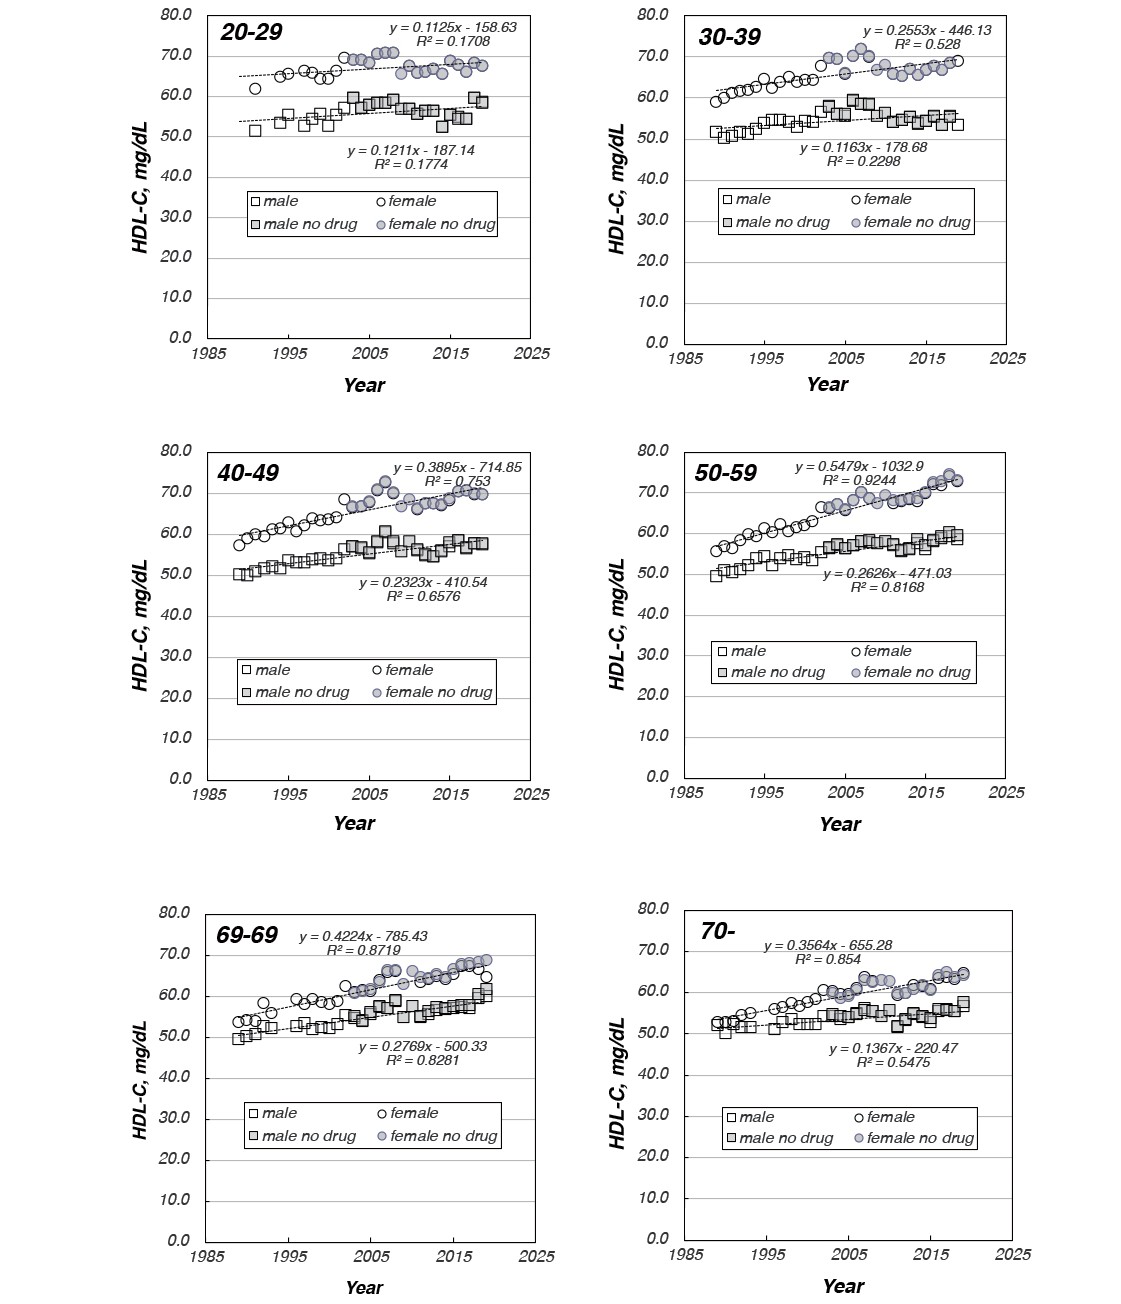
In linear regression lines, x is year and y is HDL-C (mg/dL) with r2 values.
Age distribution profiles of HDL-C are shown in Fig.4 for every 10 years and around. HDL-C did not show any remarkable peculiar age profile in men and it was noted to gradually increase in all ages of men over the period of the study. The magnitude of increase was somewhat larger in the higher age groups of 50-59 and 60-69. In contrast, the age profile of HDL-C in women showed a unique change. At around the year 1990 (1989-1991), HDL-C gradually decreased along with aging. At around 2000 (1999-2001) the decreasing trend almost disappeared and the profile seemed flat up to the age 50-59 and then started a gradual decline. The trend became rather increased by the years around 2010 (2009-2011) and the increase was more apparent in the year 2019. Relative rate of HDL-C increase to the level of 1989 was estimated in each age group from the least square regression line and shown in the third panel of Fig.4, graphically demonstrating the trend described above.

Relative increase rates are calculated for each age group from the data shown in Figure 2 and shown in the bottom panel.
HDL-C has been known to be influenced by some lifestyle-related factors such as alcohol consumption, smoking and obese tendency. Percentage of drinkers and smokers, and BMI were extracted from the NHNESJ data base as far as available, and analyzed how these factors are associated with HDL-C elevation in each sex and age group (Supplementary Figs.1, 2 and 3). The data for alcohol consumption and smoking may be less reliable as these were collected on a subjective manner via self-reported questionnaires. The number of drinkers increased in women especially in the age groups of 40-69 while it was largely stable among men except for moderate increase in the 50-59 and 60-59 age groups. This is reflected in its positive correlation with HDL-C in some age groups of women, but the magnitude of change is not parallel between alcohol consumption and HDL-C among these age groups. Since the quantitative data for drinking are available only after 2003 in NHNESJ, the results should not be overinterpreted (Supplementary Fig.1). Smoking rate data are more complicated. The rate was noted to markedly decrease among men throughout the study period, wherein it showed slight inverse correlation with HDL-C. In contrast, it once increased and turned to decrease among women in the age groups of 20-39 while it was stable in other age groups though it stayed very low overall. Therefore, no apparent its correlation was observed with HDL-C in women (Supplementary Fig.2). BMI data are more objective and reliable as it is based on physical measurement. BMI constantly increased in men throughout the study period showing a positive correlation with HDL-C. In women, it was largely stable in the age groups of 20-29 and over 60 and rather decreased in the age groups of 30-59, noting an apparent negative correlation between the parameters in the ages of 30-59 for women (Supplementary Fig.3).

Drinkers data were taken from the NHNESJ database as those who claim daily intake more than 180 ml saké or equivalent according to questionnaire. The data were available only after 2003. Change in HDL-C versus the percentage of regular drinkers is displayed in the main graph and chronological change in the drinkers is shown as the inset.

Smokers data were taken from the NHNESJ database as those who claim daily smoking according to questionnaire. Change in HDL-C versus the percentage of regular smokers is displayed in the main graph and chronological change in the smokers is shown as the inset.

BMI data were calculated from the height and weight data from NHNESJ database. Change in HDL-C versus BMI is displayed in the main graph and chronological change in the smokers is shown as the inset.
Increase in plasma HDL-C among Japanese is thus of long-term and large-scale. It shows a unique profile with respect to sex difference and age profiles. These findings indicate the presence of a profound change in the metabolic background of their populational or environmental scale. Since several potential contribution factors have been practically excluded such as popularized use of lipid-related medications, rate of drinking and smoking or increase of exercise, change in nutritional background has been investigated by examining the food intake of this population. Drastic change in food intake tool after the end of the war to 1970s in Japan by increasing fat and protein intake along with decrease in carbohydrate and salt intake and became stable throughout seventies and eighties. The second fundamental change has been noted since the deregulation in the import of meat in 1990, as increased consumption of meat product and a significant decrease in eating fishery product was observed, resulting in sharp decrease in fish/meat ratio21). Therefore, this parameter has been examined in detail in relation to the increase in HDL-C.
Consumption of fishery and meat products in NHNESJ data are shown in Supplementary Fig.4. Both increased until the middle of 1970s and became stabilized until early 1990s. Meat consumption then started increasing whereas fish consumption began decreasing. These trends can still be noted up to date. Resulting from these changes, the ratio of fish/meat sharply decreased from 4 to 1.3 until it was stabilized in the middle seventies and then started declining again at around middle 1990s. Chronological change in fish and meat consumption data are shown per the age groups in Supplementary Fig.5, indicating the changes are seen in all age groups but the earlier, more rapid and more prominent in the younger age groups. Since the NHNESJ data are based on eating record of individual subjects, the results were validated by analyzing the data extracted from the UNFAO national food supply data base. Supplementary Fig.6 shows the chronological changes in fishery and meat products supply and their ratio in various countries including Japan. This analysis validated the NHNESJ data via data from UNFAO for Japan and no other country underwent such drastic change as Japan in the past 30 years. Fig.5 shows a decrease in fish/meat ratio in each age group in the upper panel indicating that the slope for the rate of decease is age-dependent. It shows the slower decrease in the younger age groups as it was already low at the starting point. The lower panel shows the relation of the HDL-C increase rate to the fish/meat decrease rate. There is apparent strong relation between these two parameters both in males and females.

Intake of fish and meat in the NHNESJ database (g/capita/day) for all, male (M) and female (F) (top panel), and the ratio of fish and meat (F/M derived from the data in the top panel) (bottom panel)

Intake of fish and neat in each age group of the NHNESJ database (g/capita/day) for male (M) and female (F)

The bottom panel is the ratio of fish to meat.

The top panel shows the fish meat ratio in food intake of Japanese in each age group taken from NHNESJ database. The bottom panel demonstrate the relation of the decreasing rate of the fish/meat ratio to the increase rate of HDL-C for age groups.
HDL-C exhibited remarkable and continuous increase among Japanese for the past 30 years. The increase was linear over the period and there was peculiar difference between the sexes and among the age groups. The rate of increase was more remarkable in women than men. The age profile of HDL-C in men is rather flat and the increase took place slightly more in the higher age groups. In contrast, HDL-C in women used to decrease by aging 30 years ago but it increased more significantly in the higher age groups resulting in the alteration of this age profile from decreasing to increasing by aging. In contrast, plasma profiles of other lipoprotein fractions have not showed any substantial change among Japanese.
When we found this trend of HDL increase for the first time, we had serious concern as regards the standardization of the HDL-C assay methods, as new techniques had been introduced one after another in the period, such as various methods of apoB-lipoprotein precipitation by combination of different polysaccharides and divalent cations and, more recently, the so-called homogeneous procedures which include various techniques of blocking particular lipoprotein fractions from enzymatic cholesterol quantitation. We excluded this possibility by two lines of evidence; the increase in HDL-C was seamlessly linear throughout the period of 30 years without stepwise change at any timing of the introduction of new technology8), and apoA-I, another independent HDL parameter, also increased in parallel with HDL-C8). The data presented here further supported this conclusion that the change is real, as the relative rate of increase was unequal among the various groups of the subjects such as sexes and ages. It was astonishing that the increase in HDL in Japan was shown entirely dependent on the increase of the HDL sub-fraction LpAI, particles having apoA-I but not apoA-II, that it almost doubled in 30 years, while LpAI:AII, those having both, rather decreased11).
The magnitude of HDL increase in Japan is much more significant than many other countries and regions where various extents of HDL-C increase have been reported9, 11-14). According to a meta-analysis by Ezzati and his colleagues, similar extent of the increase was found in New Zealand, Switzerland and United Kingdom14). In contrast, HDL showed only moderate increase in the United States at most by 4 % and 5 % in men and women, respectively, for the period 1988-2002, respectively12, 13), and almost flat in more recent years 2007-2018 15).
Simultaneous changes in public healthcare parameters may be considered as potential contribution factors, such as widened use of anti-lipid drugs, lifestyle changes including increase in alcoholic consumption, decrease in smoking and change in BMI, the obesity index, by increase in physical exercise, heath-oriented food culture, etc. However, it is unlikely that any of them may account for HDL increase. No notable difference was seen in this trend even after excluding those who take lipid-related medication9). Smoking rate did not decrease among Japanese women during this period22). Increase in physical activity was also unlikely to cause this change as exercise activity must be increased to jogging tens of kilometers a day in order to raise HDL by 10 %23). The data in NHNESJ showed complicated correlation between the parameters for drinking, smoking and BMI with the continuous increase in HDL-C (Supplementary Figs.1, 2 and 3). The change in lifestyle reflected in these parameters may partially contribute to the change in HDL-C but none of them likely plays a predominant role. By considering the peculiar profiles of HDL increase among the sex and age groups, we must take it into account that certain fundamental and population-wide changes in metabolism among Japanese.
One of the potential factors that may cause such change is alteration of the nutritional background. Gross trend of nutritional balance has changed dramatically after the World War II with increasing intake of protein and fat and decreasing intake of carbohydrate resulting in the increase of total calorie intake. This change has been stabilized in the 1970s and no significant change has been seen thereafter. However, deregulation of meat products import around 1990 triggered insidious but drastic change. Rapid and unique shift in Japanese nutritional background has begun and remained since then as sharp decrease of the fish/meat ratio in food consumption was noted, that is more than 50 % by now. This trend was found in the data of food intake in HNESJ based on individual eating record17), and this was further validated by the data in the UNFAO data base of nations’ food supply18) (Supplementary Fig.1, 2, 3). It should be noticed that Japan exhibits the most extreme change among other nations (Supplementary Fig.3). The rate of this decrease was age-dependent and more rapid change took place in the older age groups (Fig.5 and Supplementary Fig. 2). Interestingly, the lowered rate in fish/meat ratio was proportional to the increasing rate of HDL-C (Fig.5). The increase of HDL-C and the decrease of fish/meat ratio in food intake are both very unique in Japanese with respect to their magnitude of extent. This relationship is apparently opposite and contradictory to the previous reports that intake of omega-3 fatty acid intake or fishery products tend to increase plasma HDL (summarized in the review by Abdelhamid et al.24)). It is not very easy to conceive any rationale to interpret this apparently strange and paradoxical association. Potential confounding factors may not be just nutritional but also environmental or socioeconomical factors.
Whether this long-term trend of HDL increase has impact on Japan’s public health is yet to be elucidated. This change most likely influences atherosclerotic diseases, especially coronary heart diseases (CHD). According to the official statistics of Japan, death by CHD and myocardial infarction (MI) indeed started declining since 1990s25, 26) (Supplementary Fig.7). Many factors may have contributed to this desirable trend including risk reduction by alteration of one’s lifestyle and use of medications and by development of life-saving clinical technologies, and increase in HDL may have to be taken into account. However, it is not rational to conclude that apparent nutritional change normally considered as a counteracting factor to reduction of CHD may lead to the increase in HDL in spite of their strong correlation. Increase in HDL does not necessarily mean a beneficial phenomenon for Japanese public health. It may be concerned whether it is any kind of result from environmental crisis such as unknown chemical pollution, energy overuse or climate change.
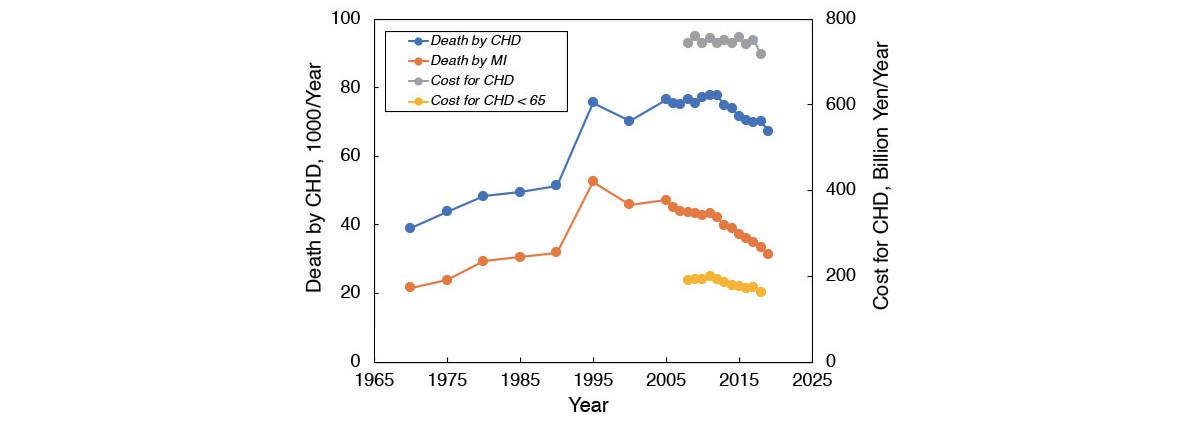
The figure is taken from the reference by the author (Yokoyama, J. Atheroscler. Thromb. 29: 815-816, 2022). The data are taken from Statistics Japan (reference 24).
The current results of the analysis should trigger further investigation on nutritional and/or environmental regulation of plasma lipoprotein metabolism, especially on HDL metabolism. The countries showing high rate of HDL increase, such as New Zealand, Switzerland and The United kingdom, are urged to analyze their own data in relation to their potential background from various points of view including those with respect to biological, environmental and socioeconomical factors. It is yet to be known whether or not these changes are beneficial for public health.
The data for the analyses are available at the websites of National Institute of Health and Nutritional (NIHN) and of Food and Agriculture Organization Statistics (FAOSTAT) as indicated in the reference list, except for those provided by SRL Co.
This work was supported by a grant-in-aid from MEXT Japan (21K11586). The author is grateful to SRL Co. for their kindly providing their clinical laboratory data for the analysis.
The author has no conflict of interest.