Abstract
Aims: Plaque erosion (PE) is one of the main plaque phenotypes of acute coronary syndrome (ACS). However, the underlying plaque component and distribution have not been systematically analysed. This study aims to investigate the distribution of lipid and calcium content in culprit lesions assessed by optical coherence tomography (OCT) in patients with PE and explore its relationship with prognosis in a cohort of ST segment elevation myocardial infarction (STEMI) patients.
Methods: A prospective cohort of 576 patients with STEMI was enrolled in our study. After exclusion, 152 PE patients with clear underlying plaque components were ultimately analysed. The culprit lesion was divided into the border zone, external erosion zone and erosion site in the longitudinal view. Each pullback of the culprit lesions was assessed by 3 independent investigators frame-by-frame, and the quantity and distribution of lipid and calcium components were recorded.
Results: Of the 152 PE patients, lipid and calcium contents were more likely to exist in the external erosion zone than in the other regions. In particular, a high level of lipid content proximal to the erosion site was significantly associated with plaque vulnerability and a higher incidence of MACEs.
Conclusion: This study revealed that high level of lipid content in the proximal external erosion zone was related to high-risk plaque characteristics and poor prognosis, which provided a novel method for risk stratification and precise management in patients with plaque erosion.
See editorial vol. 31: 15-16
Introduction
Plaque rupture (PR) and plaque erosion (PE) are two main plaque phenotypes in patients with acute coronary syndrome (ACS)1). The former is characterized by endothelium disruption with a large underlying lipid pool, while the latter usually presents as thrombosis adhering to fibrotic plaques with intact fibrous caps. Patients with PE usually have a better prognosis than those with PR because of the lower lipid burden and vulnerable features2). However, in the past few years, many studies based on intracoronary imaging have demonstrated that some erosion also occurs on the surface of large lipid plaques3, 4). Moreover, high-risk characteristics such as TCFAs and macrophages can also exist in eroded plaques5). According to the underlying plaque components, plaque erosion is usually categorized into PE with fibrous plaque and lipid-rich plaque (LRP)3). However, the concept of LRP is quite obscure and has had various standards in different studies3, 6, 7). In fact, the composition of eroded plaque is usually heterogeneous, which makes it difficult to analyse quantitatively. Therefore, the distribution of lipid content in PE has not yet been systematically investigated. In addition, whether the lipid components of PE are related to clinical outcome and plaque features is still unknown.
The main objective of the present study is to describe the distribution of different plaque components in culprit lesions of PE and their relationship with clinical outcomes. Herein, we enrolled 152 STEMI patients with PE based on optical coherence tomography (OCT) images and divided the culprit lesions into several zones for quantitative analysis. The proportion of lipid and calcium components in each zone was further calculated after adjustment for the length of the lesion.
Method
Study Population
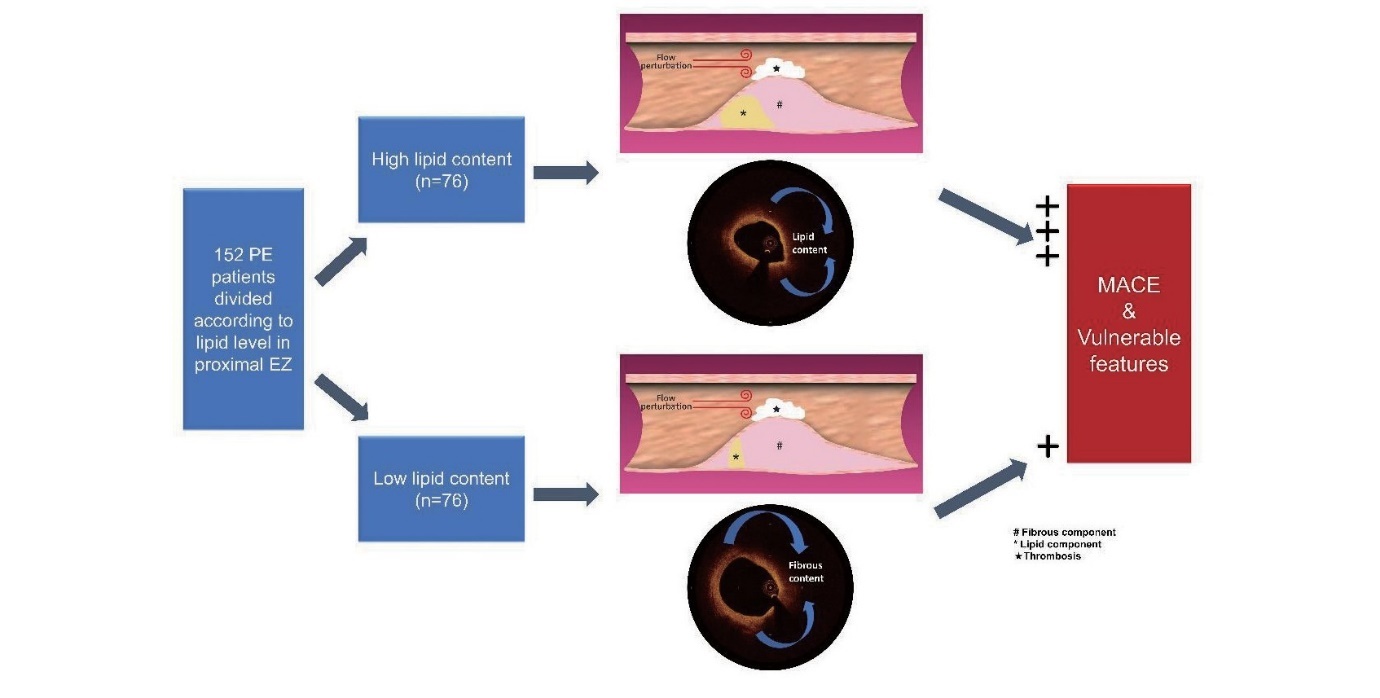
From March 2017 to January 2020, 576 patients with STEMI who underwent OCT imaging of culprit lesions in Fuwai Hospital were consecutively recruited (Fuwai Hospital OCTAMI Registry, clinical trials.gov: NCT03593928). After excluding patients without preintervention OCT images (n=14), patients with poor OCT image quality (n=93), patients with in-stent restenosis (n=48), patients with other plaque phenotypes (n=241) and patients with unclear plaque composition (n=28), the remaining 152 patients with plaque erosion and a clear underlying structure in their culprit lesions were ultimately included for analysis. The study flow chart is displayed in Fig.1. This study was performed in accordance with the Declaration of Helsinki and was approved by the Ethics Committee of Fuwai Hospital. All patients provided written informed consent.
OCT Image Acquisition and Analysis
Patients were administered 300 mg aspirin, 180 mg ticagrelor, or 600 mg clopidogrel, and 100 IU/kg heparin before the interventional procedure. Percutaneous coronary intervention was performed via radial or femoral access. Thrombus aspiration was used to reduce the thrombus burden and restore the antegrade coronary flow. OCT images of the culprit lesions were acquired with the frequency domain ILUMIEN OPTIS OCT system and a dragon fly catheter (St. Jude Medical, Westford, MA) after the antegrade blood flow was restored, according to the intracoronary imaging technique previously described. All OCT images were anonymously analysed on a St Jude OCT Offline Review Workstation by 3 independent investigators blinded to the other data. According to the previously established criteria8), PR was identified by a disrupted fibrous cap with clear cavity formation. Thin-cap fibroatheroma (TCFA) was defined as LRP with the thinnest part of the fibrous cap being <65 µm. The fibrous cap thickness was measured in triplicate at the thinnest part of the fibrous cap of the culprit plaque, and the average value was calculated. The length of the culprit lesion was measured as the span of the entire culprit plaque in the longitudinal view. Calcification within plaques was identified by the presence of well-delineated, low-backscattering heterogeneous regions. Microchannels were defined as tubule luminal structures without a connection to the vessel lumen that did not produce a signal that was recognized in more than three consecutive cross-sectional OCT images. Cholesterol crystals were defined as linear, highly backscattering structures within the plaque. Macrophage infiltration was defined as signal-rich, distinct or confluent punctate regions above the intensity of background speckle noise with backwards shadowing. The minimal lumen area (MLA) was evaluated along the length of the target lesion.
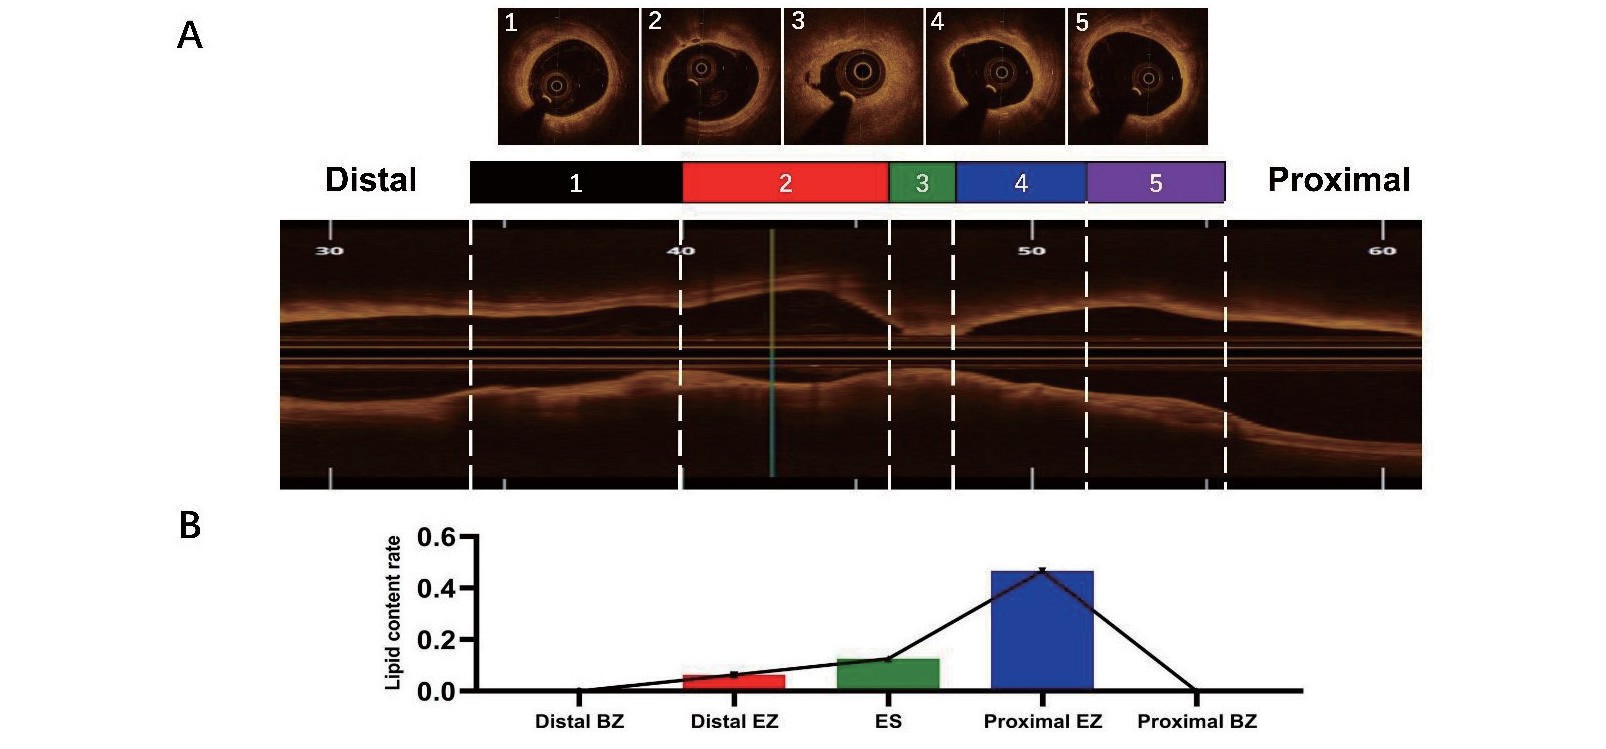
PE in our study was defined as the presence of an attached thrombus overlying an intact and visible plaque. The culprit lesion of PE was divided into three parts according to previous study9). First, the extent of the culprit lesion was defined as the whole culprit plaque between the normal vascular structure of its two sides. If normal segment of culprit vessel was not found, both borders of each erosion site (ES) were evaluated according to reference vessel diameter (RVD) which was defined those three layers of vascular structure or at least 180° of external elastic lamina (EEL) can be visualized10). If EEL is invisible, RVD was determined on basis of comparatively regular and normal vessel segment besides culprit lesion. ES was determined by OCT and coronary angiography, which presented as the heaviest thrombosis adhesion and minimal lumen size which was relatively smaller than adjacent region. Two edges of ES were identified as the proximal and distal erosion borders. The segments between the margins of the culprit lesion and the borders of ES were further divided into two halves. The zone extending from the erosion border to halfway to the culprit margin was called the extended erosion zone (EZ). The remaining zone from the EZ border to the culprit margin was defined as the border zone (BZ). The lipid, fibrous and calcified components of each zone were investigated frame by frame, and the proportion of each component was calculated on the basis of the whole frames in each zone (Fig.2).
MACEs were defined as composite all-cause death, recurrence of myocardial infarction, heart failure and stroke. Follow-up was performed by well-trained physicians who were blinded to the routine clinical data at 1, 6, and 12 months after discharge via outpatient visits or phone interviews and then annually after 1-year follow-up.
Results
Patient Baseline Characteristics and OCT Features
The enrolled patients with PE were predominantly men (n=118, 77.6%) with a mean age of 56.8 (±12.0) years. The prevalence of cardiovascular risk factors, including hypertension, dyslipidaemia and diabetes, was 58.6%, 88.8% and 26.3%, respectively. Other information on the laboratory and angiography data are presented in Table 1. The OCT features of the population are shown in Table 2. The mean longitudinal culprit lesion extension and minimum lumen area were 16.7 (±7.3 mm) and 1.7 (±0.6 mm2), respectively. Lipid and calcium components were present in 126 (82.9%) and 114 (75%) patients, respectively. High-risk features, including TCFAs, macrophages, cholesterol crystals and microchannels, were found in 23 (15.1%), 56 (36.8%), 18 (11.8%), and 37 (24.3%) patients, respectively.
Table 1.Baseline characteristics of the study cohort
| Variable |
PE patients (n = 152)
|
| Patient characteristics |
|
| Age (mean±SD) |
56.8±12.0 |
| Male, n (%)
|
118 (77.6) |
| BMI (mean±SD) |
25.6±3.2 |
| Past history |
|
| Hypertension, n (%)
|
89 (58.6) |
| Dyslipidemia, n (%)
|
135 (88.8) |
| Diabetes mellitus, n (%)
|
40 (26.3) |
| Stroke, n (%)
|
12 (7.9) |
| CKD, n (%)
|
4 (2.6) |
| Myocardial infarction, n (%)
|
11 (7.2) |
| PCI, n (%)
|
14 (9.2) |
| Laboratory data |
|
| Total cholesterol (mmol/L) |
4.5±1.0 |
| LDL cholesterol (mmol/L) |
2.8±0.9 |
| HDL cholesterol (mmol/L) |
1.1 (0.9-1.2) |
| TG (mmol/L) |
1.4 (0.9-2.0) |
| Serum creatinine (mmol/L) |
78.3 (68.0-90.7) |
| Leukocytes (10^9/L) |
9.5 (7.9-12.2) |
| hs-CRP (mg/dL) |
6.6 (3.1-10.8) |
| HbA1c (%) |
6.0 (5.6-7.0) |
| Peak cTNI (ng/ml) |
22.7 (8.1-44.1) |
| Peak NT-proBNP (pg/ml) |
1185.2 (526,5-2659.2) |
| LVEF (%) |
56.0 (52.0-60.0) |
| Angiography data |
|
| Culprit vessel |
|
| LAD, n (%)
|
72 (47.4) |
| LCX, n (%)
|
26 (17.1) |
| RCA, n (%)
|
54 (35.5) |
| TIMI flow |
|
| 0 |
100 (65.8) |
| 1 |
6 (3.9) |
| 2 |
15 (9.9) |
| 3 |
31 (20.4) |
| Lesion length, mm |
25.0 (16.0-33.0) |
| Lesion diameter, mm |
3.0 (2.5-3.5) |
| Stent, n (%)
|
144 (94.7) |
| IABP, n (%)
|
5 (3.3) |
Continuous data are presented as median (interquartile range). Categorical data are presented as number (%). BMI, body mass index; PCI, percutaneous coronary intervention; CKD, chronic kidney disease; HDL, high density lipoprotein; LDL, low density lipoprotein; TG, triglyceride; hs-CRP, high sensitive C-reactive protein; HbA1c, Hemoglobin A1c; cTNI, cardiac troponin I; LVEF, left ventricle ejection fraction; LAD, left anterior descending artery; LCX, left circumflex artery; RCA, right coronary artery; TIMI, thrombolysis in myocardial infarction; IABP, Intra-aortic balloon pump.
Table 2.OCT characteristics of culprit lesion within the study cohort
| OCT-culprit lesion characteristics |
PE patients (n = 152)
|
| Longitudinal extension (mm; median [25th, 75th percentile])
|
30.8 (22.5, 40.9) |
| Length of lipid component (mm; median [25th, 75th percentile]) |
7.6 (3.1,13.0) |
| Length of fibrous component (mm; median [25th, 75th percentile]) |
30.0 (21.9, 40.6) |
| Length of calcified component (mm; median [25th, 75th percentile]) |
4.4 (0.2, 21.2) |
| Minimal lumen area (mm2; mean±SD)
|
1.7±0.6 |
| Lipid components present, n (%)
|
126 (82.9) |
| Calcified components present, n (%)
|
114 (75.0) |
| FCT (μm; median [25th, 75th percentile]) |
110 (80,160) |
| Thin cap fibroatheroma, n (%)
|
23 (15.1) |
| Macrophages present, n (%)
|
56 (36.8) |
| Cholesterol crystal, n (%)
|
18 (11.8) |
| Microchannel, n (%)
|
37 (24.3) |
| Thrombus, n (%)
|
150 (98.7) |
Continuous data are presented as median (interquartile range). Categorical data are presented as number (%). OCT, optical coherence tomography; PE, plaque erosion; FCT, fibrous cap thickness.
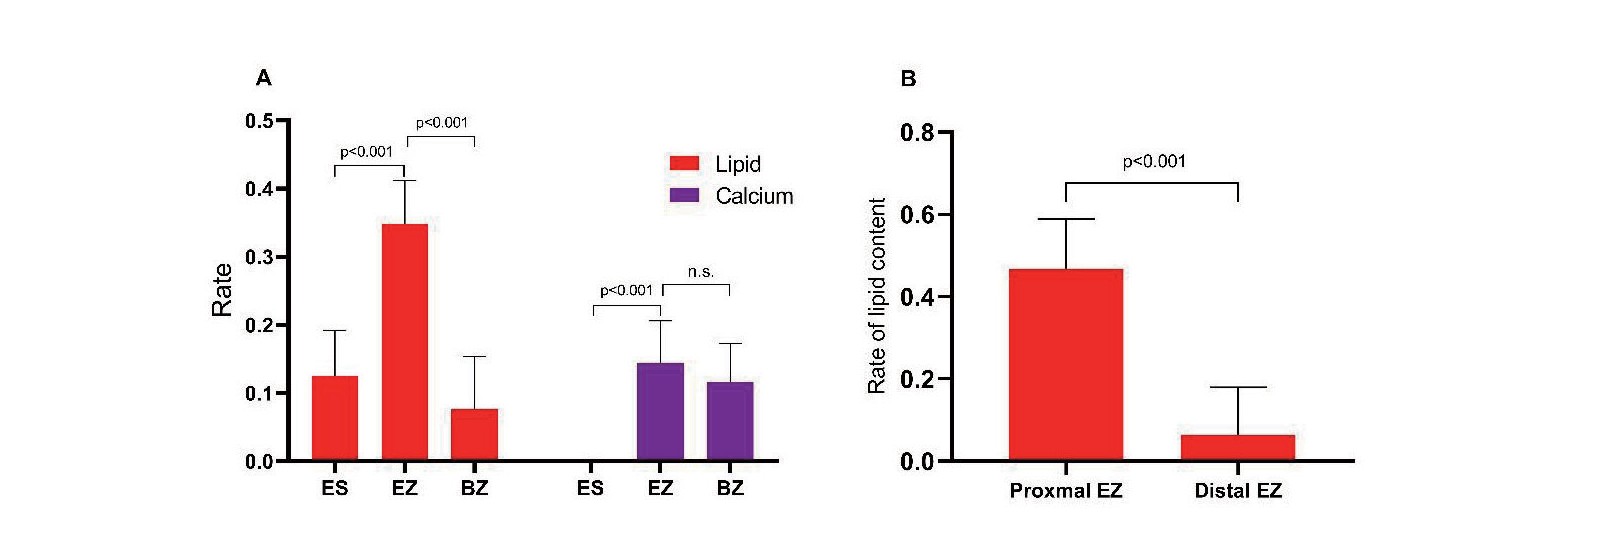
Plaque composition was analysed by longitudinally separating the three distinct zones in the whole culprit lesions. The proportion of lipid content in the extended erosion zone was significantly higher than that in the border zone and erosion site (34.8% vs. 7.7% vs. 12.5%, p<0.001). Moreover, the amount of calcium in the EZ and BZ was significantly higher than that in the ES (14.4% vs. 0, p=0.001, 11.6% vs. 0, p=0.017, respectively) (Table 3A) (Fig.3A). Next, we separated the EZ and BZ into proximal and distal portions and computed the lipid and calcified content, respectively. The results showed that the lipid content in the proximal zone was significantly greater than that in the distal zone both in the EZ [46.7% (0-84.9%) vs. 6.4% (0-42.6%), p<0.001] and the BZ [0(0-35.7%) vs. 0(0-15.2%), p=0.005] (Fig.3B). However, there was no significant difference in the calcified content between these two groups (Table 3B).
Table 3.Distribution of lipid and calcified component in distinct zone of culprit lesions. (A) Differences of lipid and calcified component among erosion site, border zone and extended erosion zone within culprit lesions of plaque erosion; (B) Differences of lipid and calcified component between proximal and distal side within extended erosion zone and border zone
| (A) Differences of lipid and calcified component among erosion site, border zone and extended erosion zone within culprit lesions of plaque erosion (n = 152)
|
| Parameters |
Region of culprit lesion |
p value
|
| ES |
EZ |
BZ |
ES vs EZ vs BZ |
ES vs EZ |
ES vs BZ |
EZ vs BZ |
| Lipid component (%) |
12.5 (0-41.1) |
34.8 (7-59.8) |
7.7 (0-28.2) |
<0.001 |
<0.001 |
0.015 |
<0.001 |
| Calcium component (%) |
0 (0-22.8) |
14.4 (0-37.0) |
11.6 (0-43.5) |
0.016 |
0.001 |
0.017 |
0.817 |
EZ, extended erosion zone; BZ, border zone; ES, erosion site
| (B) Differences of lipid and calcified component between proximal and distal side within extended erosion zone and border zone (n = 152)
|
| Parameters |
Side of EZ |
p value
|
Side of BZ |
p value
|
|
| Proximal |
Distal |
Proximal |
Distal |
| Lipid component (%) |
46.7 (0-84.9) |
6.4 (0-42.6) |
<0.001 |
0 (0-35.7) |
0 (0-15.2) |
0.005 |
|
| Calcified component (%) |
0 (0-47.5) |
0 (0-36.9) |
0.198 |
0 (0-41.6) |
0 (0-28.5) |
0.220 |
|
EZ, extended erosion zone; BZ, border zone; ES, erosion site
Follow-Up Analysis
The median time to follow-up was 2.97 years (interquartile range: 2.01 to 3.05 years). A Kaplan-Meier (KM) curve was drawn according to the lipid levels of different regions of the culprit lesion. No significant difference in MACEs was observed between the areas of high or low levels of lipid content in the ES, EZ, BZ or the whole culprit lesion (Fig.4). When the EZ was divided into proximal and distal parts, the results showed that the areas with a high level of lipid content in the proximal EZ had a higher incidence of MACEs than the areas with a low level (log rank p=0.0158) (Fig.5). Univariate regression analysis showed that lipid% in the proximal EZ was significantly associated with MACEs. Moreover, this association was preserved after adjustment for variables including age, sex, cardiovascular risk factors, inflammation level and heart function (Table 4).

Table 4.Cox Regression Analyses of lipid% in proximal EZ for MACE
| Model |
HR |
p value
|
| Unadjusted |
3.201 (1.179-8.687) |
0.022 |
| Model 1 |
2.843 (1.041-7.766) |
0.042 |
| Model 2 |
3.068 (1.025-9.186) |
0.045 |
| Model 3 |
3.742 (1.217-11.500) |
0.021 |
Hazard ratio (HR) shown were for lipid% in proximal EZ as a categorical variable through median value (46.7%). Model 1 adjusted for age and sex. Model 2 adjusted for all factors in model 1 plus hypertension, diabetes mellitus, hyperlipidemia, and smoking. Model 3 adjusted for all factors in model 2 plus high-sensitivity C-reactive protein level and left ventricle ejection fraction. EZ, extended erosion zone; MACE, major adverse cardiac event.
Subsequently, we separated the whole cohort into two groups according to median value of lipid% in proximal EZ. Baseline features were similar between these two groups while the OCT findings showed that vulnerable characteristics including presence of lipid components, TCFA and macrophage were significantly higher in high level of lipid content than low level (89.5% vs. 76.3%, p=0.031; 21.1% vs. 9.2%, p=0.042; 47.4% vs. 26.3, p=0.007, respectively) (Fig.6). Moreover, FCT in high level of lipid content is significantly thinner than that of low level (105µm vs. 140µm, p=0.001) (Table 5).
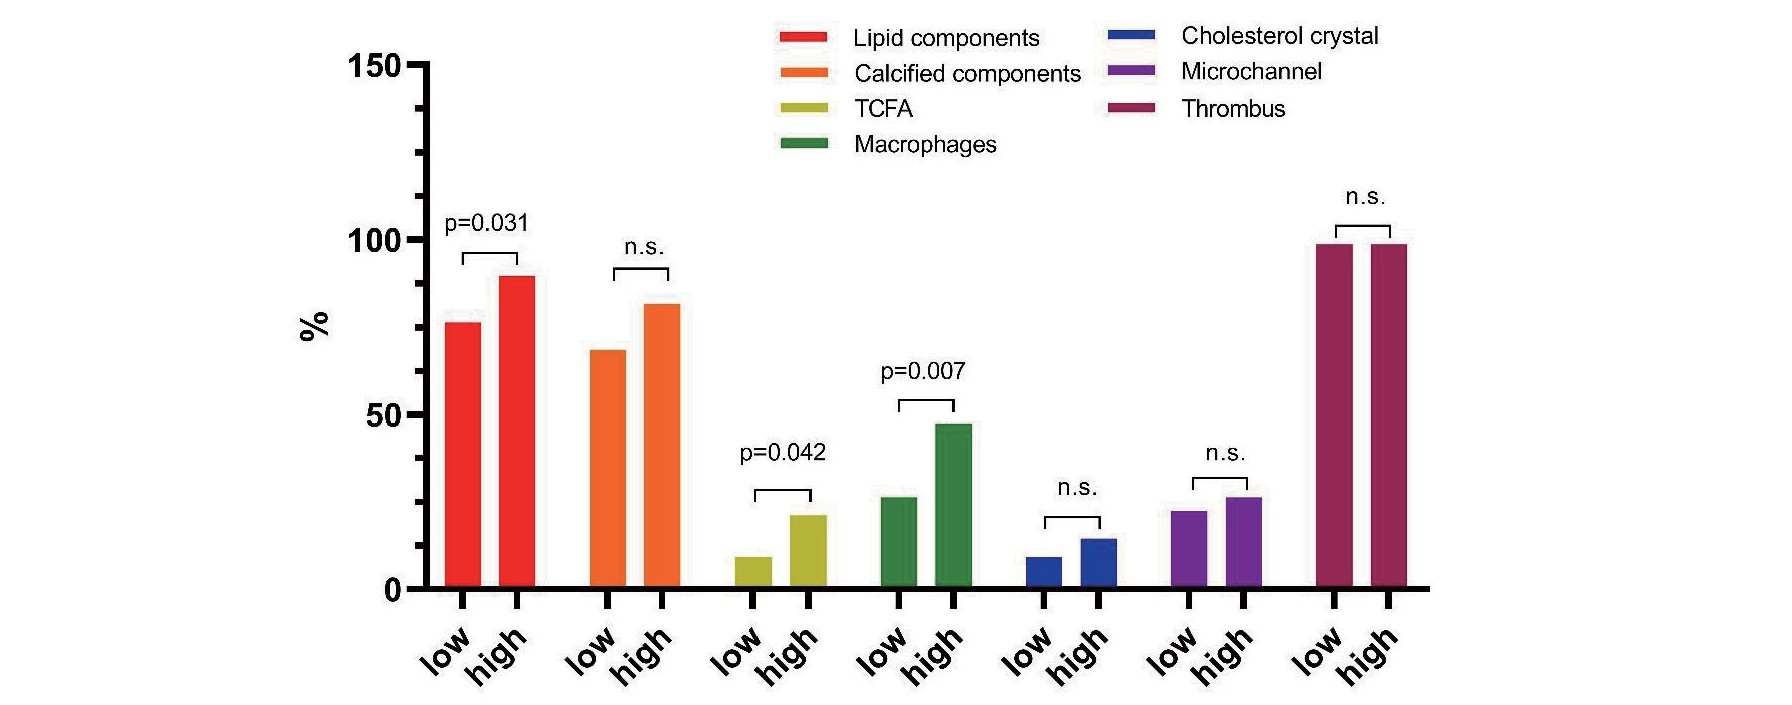
Table 5.Baseline and OCT features in low and high level of lipid content in proximal EZ
| Variables |
Proximal EZ lipid content |
p value
|
| Low level (n = 76)
|
High level (n = 76)
|
| Patient characteristics |
|
|
|
| Age (mean±SD) |
55.3±12.5 |
58.4±11.4 |
0.058 |
| Male, n (%)
|
59 (77.6) |
59 (77.6) |
1 |
| BMI (mean±SD) |
25.4±3.3 |
25.7±3.0 |
0.605 |
| Past history |
|
|
|
| Smoking, n (%)
|
57 (75.0) |
57 (75.0) |
1 |
| Hypertension, n (%)
|
48 (63.2) |
41 (53.9) |
0.249 |
| Dyslipidemia, n (%)
|
69 (90.8) |
66 (86.8) |
0.440 |
| Diabetes mellitus, n (%)
|
22 (28.9) |
18 (23.7) |
0.461 |
| Stroke, n (%)
|
7 (9.2) |
5 (6.6) |
0.547 |
| CKD, n (%)
|
2 (2.6) |
2 (2.6) |
1 |
| Myocardial infarction, n (%)
|
5 (6.6) |
6 (7.9) |
0.754 |
| PCI, n (%)
|
7 (9.2) |
7 (9.2) |
1 |
| Laboratory data |
|
|
|
| Total cholesterol (mmol/L) |
4.4 (3.8-5.1) |
4.4 (3.9-5.0) |
0.941 |
| LDL cholesterol (mmol/L) |
2.8±0.9 |
2.9±0.9 |
0.896 |
| HDL cholesterol (mmol/L) |
1.0 (0.9-1.2) |
1.1 (1.0-1.3) |
0.010 |
| TG (mmol/L) |
1.6 (1.0-2.1) |
1.3 (0.8-2.0) |
0.096 |
| Serum creatinine (mmol/L) |
77.5 (66.7-90.2) |
80.4 (68.8-93.9) |
0.325 |
| WBC (109/L) |
9.8±3.2 |
10.3±3.2 |
0.197 |
| hs-CRP (mg/dL) |
5.9 (2.6-10.8) |
7.5 (3.4-10.9) |
0.344 |
| HbA1c (%) |
6.1 (5.6-6.9) |
6.0 (5.5-7.1) |
0.544 |
| Peak cTNI (ng/ml) |
38.4 (20.3-69.8) |
46.1 (24.8-62.7) |
0.452 |
| Peak NT-proBNP (pg/ml) |
1185.2 (513.8-2215.9) |
1244.7 (545.5-3152.3) |
0.267 |
| LVEF (%) |
55.4±5.9 |
55.0±7.1 |
0.654 |
| Angiography data |
|
|
|
| Culprit vessel |
|
|
0.777 |
| LAD, n (%)
|
35 (46.1) |
37 (48.7) |
|
| LCX, n (%)
|
12 (15.8) |
14 (18.4) |
|
| RCA, n (%)
|
29 (38.2) |
25 (32.9) |
|
| TIMI flow |
|
|
0.286 |
| 0 |
54 (71.1) |
46 (60.5) |
|
| 1 |
4 (5.3) |
2 (2.6) |
|
| 2 |
5 (6.6) |
10 (13.2) |
|
| 3 |
13 (17.1) |
18 (23.7) |
|
| Lesion length, mm |
3.0 (2.5-3.3) |
3.0 (2.7-3.5) |
0.162 |
| Lesion diameter, mm |
26.0 (19.0-35.0) |
22.0 (15.3-32.0) |
0.447 |
| Stent, n (%)
|
70 (93.3) |
74 (97.4) |
0.238 |
| IABP, n (%)
|
3 (4.0) |
2 (2.6) |
0.638 |
| OCT findings |
|
|
|
| Minimum lumen area (mm2; mean±SD)
|
1.6±0.6 |
1.7±0.5 |
0.601 |
| Length of lipid component |
|
|
|
| (mm; median [25th, 75th percentile]) |
3.2 (0, 7.5) |
10.5 (7.7, 16.6) |
<0.001 |
| Length of fibrous component |
|
|
|
| (mm; median [25th, 75th percentile]) |
30.3 (22.9, 43.8) |
29.5 (21.1, 38.8) |
0.279 |
| Length of calcified component |
|
|
|
| (mm; median [25th, 75th percentile]) |
3.8 (0, 9.0) |
4.8 (1.1, 13.9) |
0.160 |
| Lipid components present, n (%)
|
58 (76.3) |
68 (89.5) |
0.031 |
| Calcified components present, n (%)
|
52 (68.4) |
62 (81.6) |
0.061 |
| FCT (μm; median [25th, 75th percentile]) |
140 (80,295) |
105 (70,130) |
0.001 |
| Thin cap fibroatheroma, n (%)
|
7 (9.2) |
16 (21.1) |
0.042 |
| Macrophages present, n (%)
|
20 (26.3) |
36 (47.4) |
0.007 |
| Cholesterol crystal, n (%)
|
7 (9.2) |
11 (14.5) |
0.315 |
| Microchannel, n (%)
|
17 (22.4) |
20 (26.3) |
0.571 |
| Thrombus, n (%)
|
75 (98.7) |
75 (98.7) |
1.000 |
Continuous data are presented as median (interquartile range). Categorical data are presented as number (%). OCT, optical coherence tomography; EZ, extended erosion zone; BMI, body mass index; PCI, percutaneous coronary intervention; CKD, chronic kidney disease; WBC, white blood cell; HDL, high density lipoprotein; LDL, low density lipoprotein; TG, triglyceride; hs-CRP, high sensitive C-reactive protein; HbA1c, Hemoglobin A1c; cTNI, cardiac troponin I; LVEF, left ventricle ejection fraction; LAD, left anterior descending artery; LCX, left circumfex artery; RCA, right coronary artery; TIMI, thrombolysis in myocardial infarction; IABP, Intra-aortic balloon pump; FCT, fibrous cap thickness.
Discussion
The present study demonstrated for the first time the plaque components and distribution in the whole culprit lesion of PE. The main results of this study revealed that the lipid and calcium contents were extensively but not uniformly distributed in culprit lesions of plaque erosion. The lipid and calcified content usually existed in the external erosion zone, especially at the proximal side of the erosion site. The level of lipid content in the proximal extended erosion zone is significantly associated with the prognosis of patients. These findings provide some evidence for clarifying the mechanism, morphology and risk stratification for plaque erosion.
LRP is Related to Poor Prognosis
It has been well acknowledged that thin-capped LRP is a strong label of plaque instability and indicates poor prognosis both in culprit and nonculprit lesions3, 11), especially in the left anterior descending artery12). Although PE was previously characterized by more fibrotic content and the absence of a large necrotic core, an increasing number of studies have reported that culprit lesions in PE also present as LRP and TCFA3, 4). A previous study demonstrated that patients with LRP had poorer outcomes than those without LPR in the population of ACS with an intact fibrous cap3). Moreover, a recent OCT study demonstrated that PE patients with LRP have more vulnerable plaque features and a high level of pancoronary inflammation in their nonculprit plaques than those with fibrotic plaque13). Interestingly, the presence of LRP in culprit eroded plaques are higher than that in nonculprit plaques14). Recent clinical research reported that PE with LRP usually showed more critical stenosis than PE without LRP7). Although experimental and clinical studies have demonstrated that the mechanism of PE is related to blood flow disturbance, endothelial apoptosis and TLR stimulation15-17), how different underlying plaques impact PE formation has not been fully investigated. Some evidence has shown that flow disturbance resulting from nearby bifurcations is the cause of plaque erosion on fibrous plaques, while severe lumen stenosis is the cause of PE on LRP7).
Spatial Distribution of Lipid Contents in Plaque Erosion
Although LPR played a significant role in the aetiology and prognosis of PE, the standard of LRP was not uniform in previous studies, and the extent and location of lipid components in culprit lesions were not well unified. In this study, the distribution and proportion of lipid and calcium content in the patients with PE were computed for quantitative analysis. A previous study revealed that the proximal segments had more LRPs than the nonproximal segments in nonculprit lesions18). Moreover, an intracoronary imaging study demonstrated that proximal lesions in coronary trees except the left main coronary artery were associated with more acute coronary events19, 20). The composition of eroded plaques are not homogeneous but usually a mixture of lipid, fibrous and calcium contents21). The heterogeneity of plaques is prone to cause plaque destabilization and a worse prognosis22). In the present study, spatial differences in the lipid and calcium distributions in the culprit lesions of plaque erosion were observed, and the location of the erosion site was discordant with the highest lipid or calcium content. Similarly, several studies have convincingly shown that the MLA does not match the location of the highest plaque burden, maximum plaque structure stress or highest lipid core burden index23-25). In plaques associated with MACE, high plaque structural stress usually occurs away from the MLA but is located upstream or downstream26). Additionally, the site of MLA is not concordant with other vulnerable features, such as large LRP and maximum plaque burden23). Therefore, the culprit lesion was more likely to present as a complex ‘mountain range’ but not a single ‘volcano’26).
Role of Proximal Lipid Content in Treatment and Prognosis
Components of atherosclerotic plaques in different regions usually exhibit distinct features. Carotid atherosclerotic plaques in the proximal region show a higher incidence of intraplaque haemorrhage and a thin fibrous cap compared with the distal side27). The surrounding region of the plaque rupture site showed a high prevalence of coexisting lipid and calcified contents9). In addition, in patients with ACS, proximal segments of the coronary artery had more LRPs than nonproximal segments19). In our study, the lipid and calcium contents were mainly located on the proximal side near the erosion site. Moreover, a high level of lipid content in the proximal side of the MLA is significantly related to more vulnerable plaque features and adverse clinical outcomes. The possible mechanism may involve plaque destabilization or inappropriate stent implantation impacted by LRP on the proximal side28).
It is well acknowledged that the therapeutic strategies and effects are impacted by the plaque phenotype and composition. The incidence of unfavourable OCT findings after stenting was higher in patients with PR than in those with PE29). Patients with PE may benefit from antithrombotic therapy without stenting during at least four years of follow-up30). The presence of LRP in culprit lesions was reported to lead to in-stent plaque prolapse, incomplete stent apposition and edge dissection28, 31, 32). In addition, the risk of no-reflow and increment of cardiac biomarkers was also higher in patients with LRP33, 34). In a recent study, patients with plaque erosion were shown to have poor prognosis if their underlying plaque phenotype was lipid rich3). Our results showed that the prevalence of lipid contents beside the MLA was significantly higher than that in the other regions, which suggested that the proximal large lipid plaque should be considered for stent implantation. Further studies are needed to determine a precise interventional strategy to address culprit lesions of distinct plaque components.
The current study provided in vivo evidence of the plaque compositional distribution in patients with PE. Both the lipid content and its location played an important role in predicting prognosis. The lipid burden and other vulnerable features in the proximal region near the erosion site should be considered. Establishment of risk stratification and precise treatment in patients with PE according to the plaque structure and characteristics is warranted.
Conclusion
Lipid and calcified contents were frequently seen in the culprit lesion of plaque erosion, particularly in the surrounding region of the erosion sites. A high level of lipid content on the proximal side near the erosion sites is significantly related to poor clinical outcomes in PE patients.
Limitation
First, this study was a single-centre study, and 10%~20% of the patients were excluded from the final analysis due to obscure underlying plaque constituents. Therefore, selection bias cannot be excluded. Second, the accuracy of OCT to identify plaque erosion and its plaque composition remains uncertain, and our study provided no pathological evidence so some of the cases may have been misjudged. Third, some interventional procedures, such as guidewire entry and thrombus aspiration before OCT examination, may change the structure of the underlying plaque. Finally, a validation cohort to confirm the prognostic value of the proximal lipid content in addition to the lipid content in the erosion sites was lacking, which we hope to establish in further investigation.
Funding
This study was supported by the Chinese Academy of Medical Sciences Innovation Fund for Medical Sciences (2016-I2 M-1–009), National Natural Science Funds (number: 81970308), the Fund of “Sanming” Project of Medicine in Shenzhen (number: SZSM201911017) and Shenzhen Key Medical Discipline Construction Fund (number: SZXK001).
Conflicts of Interest
None
References
- 1) Farb A, Tang AL, Burke AP, Sessums L, Liang Y, Virmani R. Sudden coronary death. Frequency of active coronary lesions, inactive coronary lesions, and myocardial infarction. Circulation, 1995; 92: 1701-1709
- 2) Niccoli G, Montone RA, Di Vito L, Gramegna M, Refaat H, Scalone G, Leone AM, Trani C, Burzotta F, Porto I, Aurigemma C, Prati F, Crea F. Plaque rupture and intact fibrous cap assessed by optical coherence tomography portend different outcomes in patients with acute coronary syndrome. Eur Heart J, 2015; 36: 1377-1384
- 3) Hoshino M, Yonetsu T, Usui E, Kanaji Y, Ohya H, Sumino Y, Yamaguchi M, Hada M, Hamaya R, Kanno Y, Murai T, Lee T, Kakuta T. Clinical Significance of the Presence or Absence of Lipid-Rich Plaque Underneath Intact Fibrous Cap Plaque in Acute Coronary Syndrome. J Am Heart Assoc, 2019; 8: e011820
- 4) Yamaguchi M, Sugiyama T, Hoshino M, Kanaji Y, Hada M, Usui E, Yonetsu T, Kakuta T. Two distinct phenotypes of plaque erosion assessed by multimodality intracoronary imaging: a case series. Eur Heart J Case Rep, 2020; 4: 1-5
- 5) Araki M, Yonetsu T, Kurihara O, Nakajima A, Lee H, Soeda T, Minami Y, Higuma T, Kimura S, Takano M, Yan BP, Adriaenssens T, Boeder NF, Nef HM, Kim CJ, McNulty I, Crea F, Kakuta T, Jang IK. Age and Phenotype of Patients With Plaque Erosion. J Am Heart Assoc, 2021; 10: e020691
- 6) Waksman R, Torguson R, Spad MA, Garcia-Garcia H, Ware J, Wang R, Madden S, Shah P, Muller J. The Lipid-Rich Plaque Study of vulnerable plaques and vulnerable patients: Study design and rationale. Am Heart J, 2017; 192: 98-104
- 7) Fang C, Lu J, Zhang S, Wang J, Wang Y, Li L, Wang Y, Jiang S, Yin Y, Guo J, Lei F, Yu H, Wei G, Yao Y, Chen T, Ren X, Xing L, Tu Y, Hou J, Dai J, Yu B. Morphological Characteristics of Eroded Plaques with Noncritical Coronary Stenosis: An Optical Coherence Tomography Study. J Atheroscler Thromb, 2022; 29: 126-140
- 8) Tearney GJ, Regar E, Akasaka T, Adriaenssens T, Barlis P, Bezerra HG, Bouma B, Bruining N, Cho JM, Chowdhary S, Costa MA, de Silva R, Dijkstra J, Di Mario C, Dudek D, Falk E, Feldman MD, Fitzgerald P, Garcia-Garcia HM, Gonzalo N, Granada JF, Guagliumi G, Holm NR, Honda Y, Ikeno F, Kawasaki M, Kochman J, Koltowski L, Kubo T, Kume T, Kyono H, Lam CC, Lamouche G, Lee DP, Leon MB, Maehara A, Manfrini O, Mintz GS, Mizuno K, Morel MA, Nadkarni S, Okura H, Otake H, Pietrasik A, Prati F, Raber L, Radu MD, Rieber J, Riga M, Rollins A, Rosenberg M, Sirbu V, Serruys PW, Shimada K, Shinke T, Shite J, Siegel E, Sonoda S, Suter M, Takarada S, Tanaka A, Terashima M, Thim T, Uemura S, Ughi GJ, van Beusekom HM, van der Steen AF, van Es GA, van Soest G, Virmani R, Waxman S, Weissman NJ, Weisz G, International Working Group for Intravascular Optical Coherence T. Consensus standards for acquisition, measurement, and reporting of intravascular optical coherence tomography studies: a report from the International Working Group for Intravascular Optical Coherence Tomography Standardization and Validation. J Am Coll Cardiol, 2012; 59: 1058-1072
- 9) Abdelwahed YS, Nelles G, Frick C, Seppelt C, Meteva D, Stahli BE, Rai H, Riedel M, Skurk C, Rauch-Krohnert U, Haghikia A, Sinning D, Dreger H, Knebel F, Trippel T, Krisper M, Klotsche J, Joner M, Landmesser U, Leistner DM. Coexistence of calcified- and lipid-containing plaque components and their association with incidental rupture points in acute coronary syndrome-causing culprit lesions: results from the prospective OPTICO-ACS study. Eur Heart J Cardiovasc Imaging, 2022; 23: 1598-1605
- 10) Shlofmitz E, Jeremias A, Parviz Y, Karimi Galougahi K, Redfors B, Petrossian G, Edens M, Matsumura M, Maehara A, Mintz GS, Stone GW, Shlofmitz RA, Ali ZA. External elastic lamina vs. luminal diameter measurement for determining stent diameter by optical coherence tomography: an ILUMIEN III substudy. Eur Heart J Cardiovasc Imaging, 2021; 22: 753-759
- 11) Xing L, Higuma T, Wang Z, Aguirre AD, Mizuno K, Takano M, Dauerman HL, Park SJ, Jang Y, Kim CJ, Kim SJ, Choi SY, Itoh T, Uemura S, Lowe H, Walters DL, Barlis P, Lee S, Lerman A, Toma C, Tan JWC, Yamamoto E, Bryniarski K, Dai J, Zanchin T, Zhang S, Yu B, Lee H, Fujimoto J, Fuster V, Jang IK. Clinical Significance of Lipid-Rich Plaque Detected by Optical Coherence Tomography: A 4-Year Follow-Up Study. J Am Coll Cardiol, 2017; 69: 2502-2513
- 12) Kuku KO, Garcia-Garcia HM, Doros G, Mintz GS, Ali ZA, Skinner WH, Artis AK, Ten Cate T, Powers E, Wong SC, Wykrzykowska J, Dube S, Kazziha S, van der Ent M, Shah P, Sum S, Torguson R, Di Mario C, Waksman R. Predicting future left anterior descending artery events from non-culprit lesions: insights from the Lipid-Rich Plaque study. Eur Heart J Cardiovasc Imaging, 2022; 23: 1365-1372
- 13) Cao M, Zhao L, Ren X, Wu T, Yang G, Du Z, Yu H, Dai J, Li L, Wang Y, Wei G, Ma L, Xing L, Tu Y, Fang S, Tian J, Jia H, Mintz GS, Yu B. Pancoronary Plaque Characteristics in STEMI Caused by Culprit Plaque Erosion Versus Rupture: 3-Vessel OCT Study. JACC Cardiovasc Imaging, 2021; 14: 1235-1245
- 14) Cao M, Wu T, Zhao J, Du Z, Wang Z, Li L, Wei G, Tian J, Jia H, Mintz GS, Yu B. Focal Geometry and Characteristics of Erosion-Prone Coronary Plaques in vivo Angiography and Optical Coherence Tomography Study. Front Cardiovasc Med, 2021; 8: 709480
- 15) Franck G, Mawson T, Sausen G, Salinas M, Masson GS, Cole A, Beltrami-Moreira M, Chatzizisis Y, Quillard T, Tesmenitsky Y, Shvartz E, Sukhova GK, Swirski FK, Nahrendorf M, Aikawa E, Croce KJ, Libby P. Flow Perturbation Mediates Neutrophil Recruitment and Potentiates Endothelial Injury via TLR2 in Mice: Implications for Superficial Erosion. Circ Res, 2017; 121: 31-42
- 16) Pedicino D, Vinci R, Giglio AF, Pisano E, Porto I, Vergallo R, Russo G, Ruggio A, D’Aiello A, Flego D, Annibali G, Trotta F, Piacentini R, Niccoli G, Liuzzo G, Crea F. Alterations of Hyaluronan Metabolism in Acute Coronary Syndrome: Implications for Plaque Erosion. J Am Coll Cardiol, 2018; 72: 1490-1503
- 17) Yamamoto E, Thondapu V, Poon E, Sugiyama T, Fracassi F, Dijkstra J, Lee H, Ooi A, Barlis P, Jang IK. Endothelial Shear Stress and Plaque Erosion: A Computational Fluid Dynamics and Optical Coherence Tomography Study. JACC Cardiovasc Imaging, 2019; 12: 374-375
- 18) Shlofmitz E, Mintz GS, Torguson R, Zhang C, Shea C, Shah P, Doros G, Ali ZA, Artis A, Singh V, Skinner W, Cate TT, Di Mario C, Garcia-Garcia HM, Waksman R. Longitudinal Distribution of Lipid-Rich Plaque in Nonculprit Lesions: A Lipid Rich Plaque Study Subanalysis. JACC Cardiovasc Imaging, 2022; 15: 168-170
- 19) Wykrzykowska JJ, Mintz GS, Garcia-Garcia HM, Maehara A, Fahy M, Xu K, Inguez A, Fajadet J, Lansky A, Templin B, Zhang Z, de Bruyne B, Weisz G, Serruys PW, Stone GW. Longitudinal distribution of plaque burden and necrotic core-rich plaques in nonculprit lesions of patients presenting with acute coronary syndromes. JACC Cardiovasc Imaging, 2012; 5: S10-18
- 20) Fujii K, Kawasaki D, Masutani M, Okumura T, Akagami T, Sakoda T, Tsujino T, Ohyanagi M, Masuyama T. OCT assessment of thin-cap fibroatheroma distribution in native coronary arteries. JACC Cardiovasc Imaging, 2010; 3: 168-175
- 21) Jia H, Abtahian F, Aguirre AD, Lee S, Chia S, Lowe H, Kato K, Yonetsu T, Vergallo R, Hu S, Tian J, Lee H, Park SJ, Jang YS, Raffel OC, Mizuno K, Uemura S, Itoh T, Kakuta T, Choi SY, Dauerman HL, Prasad A, Toma C, McNulty I, Zhang S, Yu B, Fuster V, Narula J, Virmani R, Jang IK. In vivo diagnosis of plaque erosion and calcified nodule in patients with acute coronary syndrome by intravascular optical coherence tomography. J Am Coll Cardiol, 2013; 62: 1748-1758
- 22) Costopoulos C, Maehara A, Huang Y, Brown AJ, Gillard JH, Teng Z, Stone GW, Bennett MR. Heterogeneity of Plaque Structural Stress Is Increased in Plaques Leading to MACE: Insights From the PROSPECT Study. JACC Cardiovasc Imaging, 2020; 13: 1206-1218
- 23) Varshney AS, Coskun AU, Siasos G, Maynard CC, Pu Z, Croce KJ, Cefalo NV, Cormier MA, Fotiadis D, Stefanou K, Papafaklis MI, Michalis L, VanOosterhout S, Mulder A, Madder RD, Stone PH. Spatial relationships among hemodynamic, anatomic, and biochemical plaque characteristics in patients with coronary artery disease. Atherosclerosis, 2021; 320: 98-104
- 24) Stone PH, Maehara A, Coskun AU, Maynard CC, Zaromytidou M, Siasos G, Andreou I, Fotiadis D, Stefanou K, Papafaklis M, Michalis L, Lansky AJ, Mintz GS, Serruys PW, Feldman CL, Stone GW. Role of Low Endothelial Shear Stress and Plaque Characteristics in the Prediction of Nonculprit Major Adverse Cardiac Events: The PROSPECT Study. JACC Cardiovasc Imaging, 2018; 11: 462-471
- 25) Lee JM, Choi G, Hwang D, Park J, Kim HJ, Doh JH, Nam CW, Na SH, Shin ES, Taylor CA, Koo BK. Impact of Longitudinal Lesion Geometry on Location of Plaque Rupture and Clinical Presentations. JACC Cardiovasc Imaging, 2017; 10: 677-688
- 26) Stone PH. The Hazardous Longitudinal Heterogeneity of Plaques: A Complex Mountain Range, Not a Single Volcano. JACC Cardiovasc Imaging, 2020; 13: 1219-1220
- 27) Crombag G, Aizaz M, Schreuder F, Benali F, van Dam-Nolen DHK, Liem MI, Lucci C, van der Steen AF, Daemen M, Mess WH, van der Lugt A, Nederkoorn PJ, Hendrikse J, Hofman PAM, van Oostenbrugge RJ, Wildberger JE, Kooi ME. Proximal Region of Carotid Atherosclerotic Plaque Shows More Intraplaque Hemorrhage: The Plaque at Risk Study. AJNR Am J Neuroradiol, 2022; 43: 265-271
- 28) Bernelli C, Shimamura K, Komukai K, Capodanno D, Saia F, Garbo R, Burzotta F, Sirbu V, Coccato M, Campo G, Vignali L, Yamamoto H, Niccoli G, Ladich E, Biondi-Zoccai G, Guagliumi G. Impact of Culprit Plaque and Atherothrombotic Components on Incomplete Stent Apposition in Patients With ST-Elevation Myocardial Infarction Treated With Everolimus-Eluting Stents- An OCTAVIA Substudy. Circ J, 2016; 80: 895-905
- 29) Hu S, Zhu Y, Zhang Y, Dai J, Li L, Dauerman H, Soeda T, Wang Z, Lee H, Wang C, Zhe C, Wang Y, Zheng G, Zhang S, Jia H, Yu B, Jang IK. Management and Outcome of Patients With Acute Coronary Syndrome Caused by Plaque Rupture Versus Plaque Erosion: An Intravascular Optical Coherence Tomography Study. J Am Heart Assoc, 2017; 6
- 30) He L, Qin Y, Xu Y, Hu S, Wang Y, Zeng M, Feng X, Liu Q, Syed I, Demuyakor A, Zhao C, Chen X, Li Z, Meng W, Xu M, Liu H, Ma L, Dai J, Xing L, Yu H, Hou J, Jia H, Mintz GS, Yu B. Predictors of non-stenting strategy for acute coronary syndrome caused by plaque erosion: four-year outcomes of the EROSION study. EuroIntervention, 2021; 17: 497-505
- 31) Bryniarski KL, Tahk SJ, Choi SY, Soeda T, Higuma T, Yamamoto E, Xing L, Dai J, Zanchin T, Lee H, Jang IK. Clinical, angiographic, IVUS, and OCT predictors for irregular protrusion after coronary stenting. EuroIntervention, 2017; 12: e2204-e2211
- 32) Uzu K, Shinke T, Otake H, Takaya T, Osue T, Iwasaki M, Kinutani H, Konishi A, Kuroda M, Takahashi H, Terashita D, Hirata KI, Saito S, Nakamura M, Shite J, Akasaka T. Morphological and pharmacological determinants of peri-procedural myocardial infarction following elective stent implantation: Optical coherence tomography sub-analysis of the PRASFIT-Elective study. J Cardiol, 2017; 70: 545-552
- 33) Negishi Y, Ishii H, Suzuki S, Aoki T, Iwakawa N, Kojima H, Harada K, Hirayama K, Mitsuda T, Sumi T, Tanaka A, Ogawa Y, Kawaguchi K, Murohara T. The combination assessment of lipid pool and thrombus by optical coherence tomography can predict the filter no-reflow in primary PCI for ST elevated myocardial infarction. Medicine (Baltimore), 2017; 96: e9297
- 34) Yamamoto M, Seino Y, Otsuka T, Kurihara O, Negishi K, Murakami D, Takano M, Mizuno K. Identification of high-risk plaques associated with peri-procedural myocardial injury following elective percutaneous coronary intervention: assessment by high-sensitivity troponin-T measurements and optical coherence tomography. Int J Cardiol, 2013; 168: 2860-2862