Abstract
Aim: This study aimed to investigate the association between vitamin D deficiency and novel biomarkers of atherogenic dyslipidemia among young adults.
Method: A total of 976 young adults were recruited between 2011 and 2019. Their serum 25(OH)D levels were measured, and lipid profile markers, including low-density lipoprotein cholesterol (LDL-C), low-density lipoprotein triglyceride (LDL-TG), and small-dense low-density lipoprotein cholesterol (sdLDL-C), were assessed as novel biomarkers of atherogenic dyslipidemia. Multivariable linear regression was used to analyze the association between vitamin D levels and lipid profile markers. Odds ratios were calculated to assess the risk of atherogenic dyslipidemia in individuals with serum 25(OH)D levels below 30 ng/mL compared to those with levels above 30 ng/mL. Structural equation modeling (SEM) was employed to explore potential mediation pathways.
Results: The study found a significant association between vitamin D levels and lower levels of LDL-C, LDL-TG, sdLDL-C, non-high-density lipoprotein cholesterol (non-HDL-C), triglycerides, and total cholesterol. Individuals with serum 25(OH)D levels below 30 ng/mL exhibited significantly higher odds ratios for developing atherogenic dyslipidemia in a dose–response pattern compared to those with vitamin D levels above 30 ng/mL. Notably, structural equation modeling (SEM) analysis revealed that vitamin D did not affect atherogenic lipid markers through the mediation of insulin resistance markers or high-sensitivity C-reactive protein.
Conclusion: This study provides evidence of an association between vitamin D deficiency and atherogenic dyslipidemia in young adults. It further highlights that individuals with serum 25(OH)D levels below 30 ng/mL are at a significantly higher risk of developing atherogenic dyslipidemia in a dose–response manner compared to those with higher vitamin D levels. These findings underscore the potential role of vitamin D in dyslipidemia management and emphasize the importance of maintaining sufficient vitamin D levels for cardiovascular health in young adults.
See editorial vol. 31: 520-521
Introduction
Cardiovascular disease (CVD) stands as a global health menace, accounting for nearly 17.92 million deaths annually1). Among the myriad of risk factors, dyslipidemia, which is characterized by abnormal lipid levels in the bloodstream, plays a pivotal role in the development and progression of cardiovascular diseases This condition expedites lipid deposition and inflammation within the vessel walls, fostering the onset of atherosclerosis, a significant precursor to CVD2). Elevated levels of low-density lipoprotein cholesterol (LDL-C) have been consistently associated with increased risk of CVD mortality3). While interventions targeting dyslipidemia can alleviate these risks, other types of atherogenic dyslipidemia4), notably small-dense low-density lipoprotein cholesterol (sdLDL-C) and low-density lipoprotein triglyceride (LDL-TG), introduce residual threats. Atherogenic dyslipidemia is more atherogenic than LDL-C alone because of the higher cholesterol content, higher affinity for arterial intima, easier transcytosis, and more tentative direct phagocytosis by macrophages in the arterial intima5).
The onset of dyslipidemia is influenced by a confluence of factors ranging from age, dietary habits, genetic predispositions, cigarette smoking, diabetes mellitus6), to more intricate factors such as insulin resistance7). A burgeoning body of evidence has highlighted that vitamin D deficiency potentially aggravates dyslipidemia8).
Vitamin D is a lipid-soluble vitamin. The major source of vitamin D is cholecalciferol (vitamin D3) through dermal synthesis after exposure to sunlight UV radiation. Ergocalciferol (vitamin D2) is a plant-derived form of vitamin and is often used as a vitamin supplement. Vitamin D3 and vitamin D2 are transformed into serum 25-hydroxyvitamin D3 (25(OH)D3) and 25-hydroxyvitamin D2 (25(OH)D2) by 25-hydroxylase. The half-life of 25(OH)D2 is significantly shorter than that of 25(OH)D3. Measurement of 25-hydroxyvitamin D (25(OH)D) significantly encompasses the combined levels of 25(OH)D3 and 25(OH)D2. Then, 25(OH)D is transformed into 1,25-dihydroxyvitamin D (1, 25(OH)2D) by 1α-hydroxylase9).
In addition, to bone metabolism, vitamin D has many extra-skeletal functions. Vitamin D can penetrate the cell membrane and bind to its vitamin D receptor (VDR), and the vitamin D–VDR complex can regulate various gene expressions and signal transduction pathways10). Vitamin D exerts anti-inflammatory effects by inhibiting the NF-κB pathway and proinflammatory cytokine production11). It can also significantly decrease oxidative stress and increase nitric oxide levels12). Previous studies have associated vitamin D deficiency with impaired vascular endothelial function13). Mendelian randomization analyses revealed evidence of an inverse association between vitamin D deficiency and high-sensitivity C-reactive protein (hs-CRP) levels14). These are all possible mechanisms of the association between vitamin D and dyslipidemia10).
Serum 25(OH)D is known to be the best marker for evaluating the status of vitamin D. Most studies define a 25(OH)D level lower than 20 ng/mL (50 nmol/L) as vitamin D deficiency15). Furthermore, a 25(OH)D level between 20 ng/mL (50 nmol/L) and 30 ng/mL (75 nmol/L) is considered as vitamin D insufficiency. A 25(OH)D level lower than 12 ng/mL (30 nmol/L) is regarded as severe vitamin D deficiency due to an increased risk for osteomalacia and nutritional rickets. The USA, Canada, and Europe have been reported to have a high prevalence (between 24% and 40%) of vitamin D deficiency16).
Large randomized clinical trials did not show a benefit of vitamin D supplementation for major cardiovascular events in the older general population17). However, previous studies demonstrated an association between vitamin D deficiency and sdLDL-C in middle-aged adults18). A study involving 136 Japanese men also showed an association between vitamin D deficiency and unfavorable lipid profiles19). Furthermore, a small randomized clinical trial showed that vitamin D supplementation can decrease oxidized low-density lipoprotein levels in patients with diabetes20).
Recognizing this gap and the potential ramifications of vitamin D on atherogenic dyslipidemia from early life, our study extends its focus on young adults. Our objective is to shed light on how serum 25(OH)D levels modulate atherogenic dyslipidemia, providing insights into the genesis of CVDs in younger populations.
Materials and Methods
Subjects and Study Design
Our study enrolled 976 young adults aged 20 to 45 years old between 2011 and 2019. The participants were recruited from a community-based population. Most of them were participants of a previous nationwide screening program. They represented the general young adult population in Taipei, Taiwan. The involvement of the participants in a nationwide screening program helps reduce the likelihood of selection volunteer bias. The study population consisted of 407 men (41.70%) and 569 women (58.30%). Individuals with congestive heart failure, cerebrovascular disease, or active cancer were excluded. This study was approved by the Institutional Review Board of Nation Taiwan University Hospital. Written informed consent was obtained from each participant before enrollment in this study.
Assessment of Clinical Information and Risk Stratification
Information on basic CVD risk factors, such as age, sex, weight, height, medical history, smoking habits, alcohol consumption, and current medications, were collected from the participants. Blood pressure was measured twice using a standardized method, and participants with a reading of ≥ 140/90 mmHg or were taking antihypertensive medications were defined as having hypertension. Information regarding lifestyle and socioeconomic status was obtained through a self-report questionnaire and included cigarette smoking, alcohol consumption, household income, and exercise habits. The participants were considered smokers if they regularly smoked and alcohol drinkers if they consumed two or more standard alcoholic drinks per week. The demographic and anthropometric data of the participants, including body mass index (BMI) and waist circumference, were obtained from the medical records archive of the National Taiwan University Hospital. Obesity was defined as BMI ≥ 27 kg/m2.
Measurement of Serum Levels of Vitamin D and Lipid Profile Markers
Blood samples were collected from each participant after overnight fasting for at least 10–14 h and stored at −80℃. The serum levels of total 25(OH)D (calcidiol), including 25(OH)D2 and 25(OH)D3, were measured using a commercially available TOTAL Liaison chemiluminescence analyzer (Liaison, Diasorin S.p.A., Saluggia, Italy) to represent the individual vitamin D status of each participant21). Because vitamin D status is influenced by sun exposure, participants were recruited each year between March and September. To minimize bias resulting from seasonal variations in vitamin D status, all data in our study were collected specifically during spring and summer. This approach ensured the mitigation of any potential impact of seasonal differences on vitamin D levels.
The serum levels of total cholesterol (TCHO), TG, high-density lipoprotein cholesterol (HDL-C), and LDL-C were quantified via a homogeneous enzymatic method using commercial kits (Denka Seiken Co., Ltd.). Quantification was performed using a Toshiba automatic chemistry analyzer FR-200 (Toshiba Company, Tokyo, Japan). The serum levels of LDL-TG and sdLDL-C were measured using the sd-LDL-EX “SEIKEN” protocol on a Toshiba FR-200 automatic chemistry analyzer (Toshiba Company, Tokyo, Japan). The serum levels of LDL-TG and sdLDL-C were measured using automated detergent-based homogeneous methods (Denka Seiken, Tokyo, Japan).
Statistical Analysis
Continuous variables were expressed as means±standard deviations. Categorical variables were expressed as numbers (percentages). Analysis of variance for continuous variables and Pearson’s chi-squared test for categorical variables were used to evaluate the differences and trends between groups having different serum 25(OH)D levels. Univariable linear regression was employed to evaluate the association between lipid markers and CVD risk factors. Significant variables were then further analyzed via multivariable linear regression using multiple models. To further confirm the associations, nonlinear regression analyses and investigation of scatterplots for serum 25(OH)D levels and lipid markers were conducted. Logistic regression was employed to evaluate the odds ratio of having atherogenic dyslipidemia between groups with different 25(OH)D levels. Specifically, the binary responsible variable was 1 for each atherogenic dyslipidemia marker outer than its normal range and 0 otherwise; the major independent variables were three dichotomic variables indicating serum 25(OH)D levels of <12, 12–20, and 20–30 ng/mL with >30 ng/mL as reference; covariates of age, sex, BMI, systolic blood pressure, serum creatinine, homeostasis model assessment for insulin resistance (HOMA-IR), serum calcium level, alcohol consumption, cigarette smoking, educational level, and regular exercise habits were included for adjustment. The odds ratio of having atherogenic dyslipidemia for an interquartile range of 25(OH)D level from other fitted logistic regression models with 25(OH)D was reported as a continuous independent variable. Sensitivity analysis was employed to identify possible sensitive subgroups.
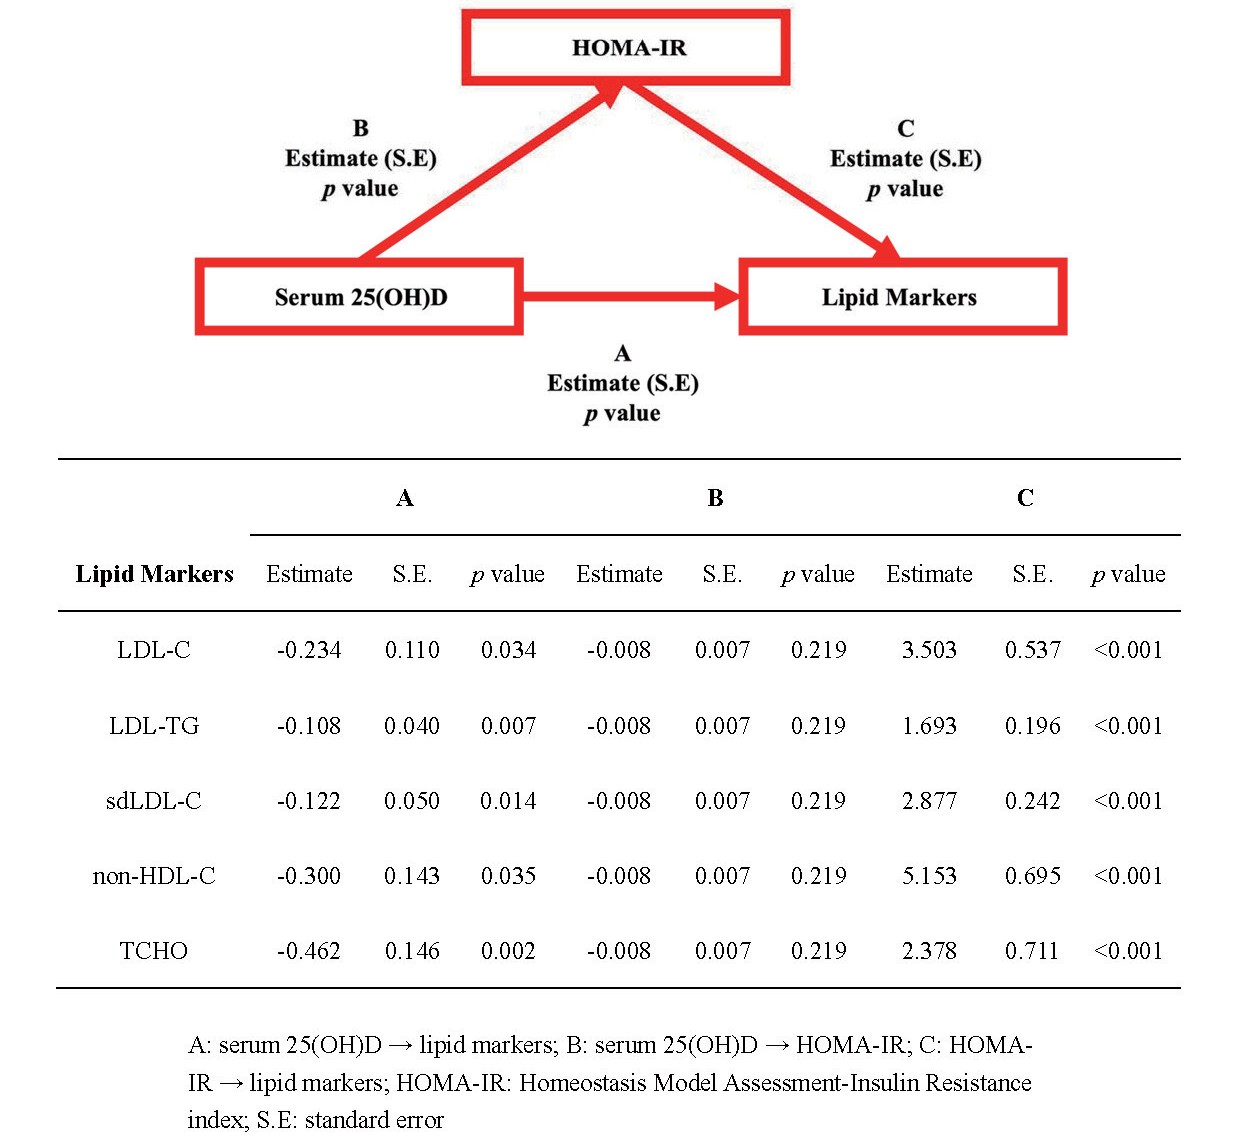
We used SEM to examine the associations among serum 25(OH)D levels, dyslipidemia, and insulin resistance. Our hypothesis posited that atherogenic dyslipidemia markers were influenced by vitamin D status directly and indirectly through the mediator of insulin resistance. Additionally, we explored the associations between serum 25(OH)D, hs-CRP, and markers of atherogenic dyslipidemia using SEM analyses. To account for potential confounding factors, such as age, sex, BMI, systolic blood pressure, serum creatinine, hs-CRP, serum calcium level, alcohol consumption, cigarette smoking, educational level, and regular exercise habit, adjustments were made for both hypotheses. SEM analysis was conducted using Amos 26.0 (IBM SPSS, Chicago). All data were analyzed using IBM SPSS Statistics for Windows, version 28.0 (IBM Corp., Armonk, NY). A p-value less than 0.05 was considered statistically significant.
Results
Relationship between Vitamin D Levels and Cardiovascular Disease Risk Factors
The study population was divided into four groups according to their serum 25(OH)D levels (Table 1), using specific cutoff points of 12, 20, and 30 ng/mL according to clinical guidelines. The p-value for trend analysis indicated that individuals with higher serum 25(OH)D levels tended to be older, have smoking habit, men, and have higher levels of hs-CRP and serum calcium. The study also found that vitamin D deficiency was associated with higher LDL-C, LDL-TG, sdLDL-C, non-HDL, and TCHO levels. However, no significant differences were observed in other factors such as BMI, blood pressure, serum creatinine, TG levels, blood sugar levels, insulin resistance, serum albumin and phosphate concentration, alcohol consumption, exercise habits, educational level, or oral multivitamin supplementation between groups with different serum 25(OH)D levels (Table 1).
Table 1.Comparisons of cardiovascular risk factors between different groups by 25(OH)D concentrations
| Variables |
Overall N= 976 |
25(OH)D groups, ng/mL |
p for trend
|
|
<12
N= 205 (21.0%)
|
12-20
N= 345 (35.4%)
|
20-30
N= 344 (35.2%)
|
>30
N= 82 (8.4%)
|
| Age, years |
31.94±4.50 |
31.64±4.59 |
31.54±4.34 |
32.35±4.61 |
32.65±4.32 |
0.033 |
| Men |
407 (41.70%) |
70 (34.15%) |
117 (33.91%) |
168 (48.84%) |
52 (63.41%) |
<0.001 |
| BMI, kg/m2
|
23.04±4.28 |
23.07±4.47 |
22.96±4.33 |
22.97±4.02 |
23.61±4.68 |
0.344 |
| SBP, mmHg |
115.48±13.80 |
115.59±14.90 |
115.43±12.89 |
115.12±13.79 |
116.95±14.85 |
0.494 |
| DBP, mmHg |
65.73±9.56 |
66.33±10.87 |
65.79±8.68 |
65.26±9.46 |
65.91±10.08 |
0.639 |
| Creatinine, mg/dL |
0.88±0.92 |
0.90±1.34 |
0.90±1.13 |
0.84±0.17 |
0.91±0.20 |
0.932 |
| Glucose, mg/dL |
86.77±20.12 |
86.13±20.86 |
88.58±27.85 |
85.45±9.21 |
85.45±9.21 |
0.749 |
| HbA1C, % |
5.62±0.67 |
5.63±0.66 |
5.64±0.90 |
5.58±0.90 |
5.58±0.39 |
0.645 |
| Insulin, mIU/L |
10.59±6.08 |
11.18±7.15 |
10.48±5.76 |
10.04±4.89 |
11.85±8.39 |
0.522 |
| HOMA-IR |
2.33±1.83 |
2.42±1.90 |
2.37±2.19 |
2.15±1.17 |
2.62±2.22 |
0.598 |
| hsCRP, mg/dL |
0.15±0.24 |
0.11±0.17 |
0.15±0.28 |
0.14±0.22 |
0.20±0.28 |
0.008 |
| LDL-C, mg/dL |
106.6±31.42 |
106.5±32.77 |
109.6±32.49 |
105.5±30.18 |
98.15±26.89 |
0.020 |
| LDL-TG, mg/dL |
12.55±11.66 |
14.34±16.41 |
12.39±5.50 |
11.91±5.79 |
11.40±5.02 |
0.045 |
| sdLDL-C, mg/dL |
22.97±14.86 |
24.08±19.62 |
22.98±12.95 |
23.15±14.23 |
19.38±10.13 |
0.019 |
| non-HDL-C, mg/dL |
128.7±41.75 |
129.9±44.88 |
131.3±47.90 |
127.6±34.88 |
118.8±29.51 |
0.026 |
| TG, mg/dL |
91.04±63.96 |
92.91±69.39 |
90.09±67.64 |
92.41±64.40 |
84.62±61.30 |
0.136 |
| TCHO, mg/dL |
188.2±41.63 |
191.0±43.34 |
192.3±48.53 |
185.3±34.02 |
175.9±30.78 |
0.002 |
| Albumin, g/dL |
4.72±0.26 |
4.72±0.30 |
4.70±0.26 |
4.73±0.23 |
4.73±0.29 |
0.627 |
| Calcium, mg/dL†
|
9.32±0.37 |
9.31±0.38 |
9.28±0.37 |
9.35±0.34 |
9.39±0.39 |
0.037 |
| Phosphate, mg/dL |
3.54±0.54 |
3.55±0.55 |
3.60±0.55 |
3.48±0.50 |
3.54±0.55 |
0.523 |
| Smoking, yes |
132 (13.52%) |
18 (8.78%) |
47 (13.62%) |
49 (14.24%) |
18 (21.95%) |
0.006 |
| Alcohol consumption |
303 (31.05%) |
60 (29.27%) |
108 (31.30%) |
108 (31.40%) |
27 (32.93%) |
0.550 |
| Exercise habit |
567 (58.09%) |
115 (56.10%) |
198 (57.39%) |
207 (60.17%) |
47 (57.32%) |
0.470 |
| Education, ≥ 12 years |
882 (90.37%) |
190 (92.68%) |
304 (88.12%) |
314 (91.28%) |
74 (90.24%) |
0.826 |
| Oral Supplement*
|
116 (11.92%) |
25 (12.20%) |
43 (12.46%) |
38 (11.05%) |
10 (12.20%) |
0.629 |
ANOVA for continuous variables, chi-square test for categorical variables. Continuous variables: means±standard deviations, categorial variables: numbers (percentages)
Abbreviation: 25(OH)D: 25-hydroxyvitamin D in ng/mL, BMI: body mass index, SBP: systolic blood pressure, DBP: diastolic blood pressure, HOMA-IR: Homeostatic Model Assessment for Insulin Resistance, hsCRP: high-sensitivity C-reactive protein, LDL-C: low-density lipoprotein cholesterol, LDL-TG: low-density lipoprotein triglycerides, sdLDL-C: small dense LDL cholesterol, non-HDL-C: non-HDL cholesterol, TG: tri- glycerides, TCHO: total cholesterol, Smoking: active smoking (yes/no), Alcohol consumption: regular social drinking (yes/no), Exercise: regular exercise (yes/no), Education: Bachelor’s degree or higher (yes/no).
*: regular oral multivitamin supplementation upon enrollment
†: serum calcium level, measured by mg/dL, corrected by serum albumin level if serum albumin level below 4.0 g/dL
Univariable linear regression showed that the levels of LDL-C, LDL-TG, sdLDL-C, non-HDL-C, TG, and TCHO were all negatively associated with vitamin D levels (Table 2). Additionally, these lipid markers were positively associated with older age, male sex, higher BMI, higher blood pressure, higher blood sugar, insulin resistance, serum calcium level, and hsCRP levels. The study also found that cigarette smoking was associated with higher LDL-C, LDL-TG, and sdLDL-C levels. Moreover, higher serum creatinine had an association with higher LDL-C, LDL-TG, sdLDL-C, and non-HDL-C levels.
Table 2.The relationship between lipid profile markers and CVD risk factors using univariate linear regression models
|
LDL-C |
LDL-TG |
sdLDL-C |
| Beta (SE) |
p value
|
Beta (SE) |
p value
|
Beta (SE) |
p value
|
| 25(OH)D, ng/mL |
-0.262 (0.112) |
0.020 |
-0.122 (0.042) |
0.003 |
-0.145 (0.053) |
0.006 |
| Age, years |
0.844 (0.222) |
<0.001 |
0.200 (0.083) |
0.016 |
0.486 (0.105) |
<0.001 |
| Men |
12.30 (2.002) |
<0.001 |
1.945 (0.755) |
0.010 |
6.990 (0.939) |
<0.001 |
| BMI, kg/m2
|
1.707 (0.229) |
<0.001 |
0.744 (0.084) |
<0.001 |
1.254 (0.104) |
<0.001 |
| SBP, mmHg |
0.495 (0.071) |
<0.001 |
0.167 (0.027) |
<0.001 |
0.329 (0.033) |
<0.001 |
| DBP, mmHg |
0.860 (0.101) |
<0.001 |
0.289 (0.038) |
<0.001 |
0.521 (0.047) |
<0.001 |
| Creatinine, mg/dL |
2.026(1.093) |
0.064 |
0.913(0.405) |
0.024 |
1.120(0.516) |
0.030 |
| Glucose, mg/dL |
0.170 (0.050) |
<0.001 |
0.082 (0.018) |
<0.001 |
0.187 (0.023) |
<0.001 |
| HbA1C, % |
6.382 (1.490) |
<0.001 |
1.899 (0.574) |
0.001 |
5.895 (0.710) |
<0.001 |
| Insulin, mIU/L |
1.030 (0.162) |
<0.001 |
0.542 (0.059) |
<0.001 |
0.848 (0.074) |
<0.001 |
| HOMA-IR |
3.549 (0.538) |
<0.001 |
1.713 (0.196) |
<0.001 |
2.901 (0.243) |
<0.001 |
| Calcium, mg/dL†
|
11.63 (2.276) |
<0.001 |
0.421 (1.022) |
0.680 |
6.154 (1.287) |
<0.001 |
| hsCRP, mg/dL |
14.993 (4.192) |
<0.001 |
7.546 (1.548) |
<0.001 |
10.972 (1.966) |
<0.001 |
| Smoking, yes |
6.369 (2.937) |
0.030 |
2.510 (1.090) |
0.021 |
5.813 (1.380) |
<0.001 |
| Alcohol consumption |
-4.394 (2.171) |
0.043 |
-0.668 (0.809) |
0.409 |
-0.969 (1.030) |
0.347 |
| Exercise habit |
3.482 (2.036) |
0.088 |
-1.260 (0.756) |
0.096 |
-0.470 (0.965) |
0.626 |
| Education, ≥ 12 years |
-6.533 (3.404) |
0.055 |
-1.621 (1.265) |
0.200 |
-2.106 (1.611) |
0.192 |
|
Non-HDL-C |
TG |
TCHO |
|
Beta (SE) |
p value
|
Beta (SE) |
p value
|
Beta (SE) |
p value
|
| 25(OH)D, ng/mL |
-0.385 (0.149) |
0.010 |
-1.850 (0.915) |
0.044 |
-0.516 (0.149) |
0.001 |
| Age, years |
1.225 (0.295) |
<0.001 |
-0.021 (1.819) |
0.991 |
1.028 (0.295) |
<0.001 |
| Men |
15.44 (2.666) |
<0.001 |
50.61 (16.51) |
0.002 |
1.098 (2.704) |
0.685 |
| BMI, kg/m2
|
2.692 (0.300) |
<0.001 |
10.84 (1.880) |
<0.001 |
0.926 (0.310) |
0.003 |
| SBP, mmHg |
0.675 (0.094) |
<0.001 |
2.032 (0.590) |
0.001 |
0.247 (0.096) |
0.010 |
| DBP, mmHg |
1.076 (0.135) |
<0.001 |
1.740 (0.855) |
0.042 |
0.500 (0.138) |
<0.001 |
| Creatinine, mg/dL |
3.271(1.450) |
0.024 |
8.490(8.895) |
0.340 |
1.747(1.449) |
0.228 |
| Glucose, mg/dL |
0.309 (0.066) |
<0.001 |
1.329 (0.405) |
0.001 |
0.202 (0.066) |
0.002 |
| HbA1C, % |
12.90 (1.955) |
<0.001 |
120.9 (11.60) |
<0.001 |
9.376 (1.970) |
<0.001 |
| Insulin, mIU/L |
1.503 (0.215) |
<0.001 |
3.685 (1.343) |
0.006 |
0.550 (0.219) |
0.012 |
| HOMA-IR |
5.120 (0.712) |
<0.001 |
13.26 (4.449) |
0.003 |
2.390 (0.724) |
0.001 |
| Calcium, mg/dL†
|
15.61 (3.548) |
<0.001 |
24.40 (7.558) |
0.001 |
16.28 (3.560) |
<0.001 |
| hsCRP, mg/dL |
27.78 (5.536) |
<0.001 |
106.0 (35.14) |
0.002 |
11.03 (5.580) |
0.048 |
| Smoking, yes |
7.456 (3.904) |
0.056 |
22.57 (23.93) |
0.346 |
-1.037 (3.900) |
0.790 |
| Alcohol consumption |
-3.945 (2.889) |
0.172 |
24.54 (17.69) |
0.166 |
-5.713 (2.876) |
0.047 |
| Exercise habit |
-1.405 (2.709) |
0.604 |
-4.061 (16.58) |
0.807 |
-1.500 (2.701) |
0.579 |
| Education, ≥ 12 years |
-3.638 (4.530) |
0.422 |
-4.658 (27.73) |
0.867 |
1.662 (4.519) |
0.713 |
Abbreviations: SE: standard error; please refer to Table 1 for other abbreviations.
†: serum calcium level, measured by mg/dL, corrected by serum albumin level if serum albumin level below 4.0 g/dL
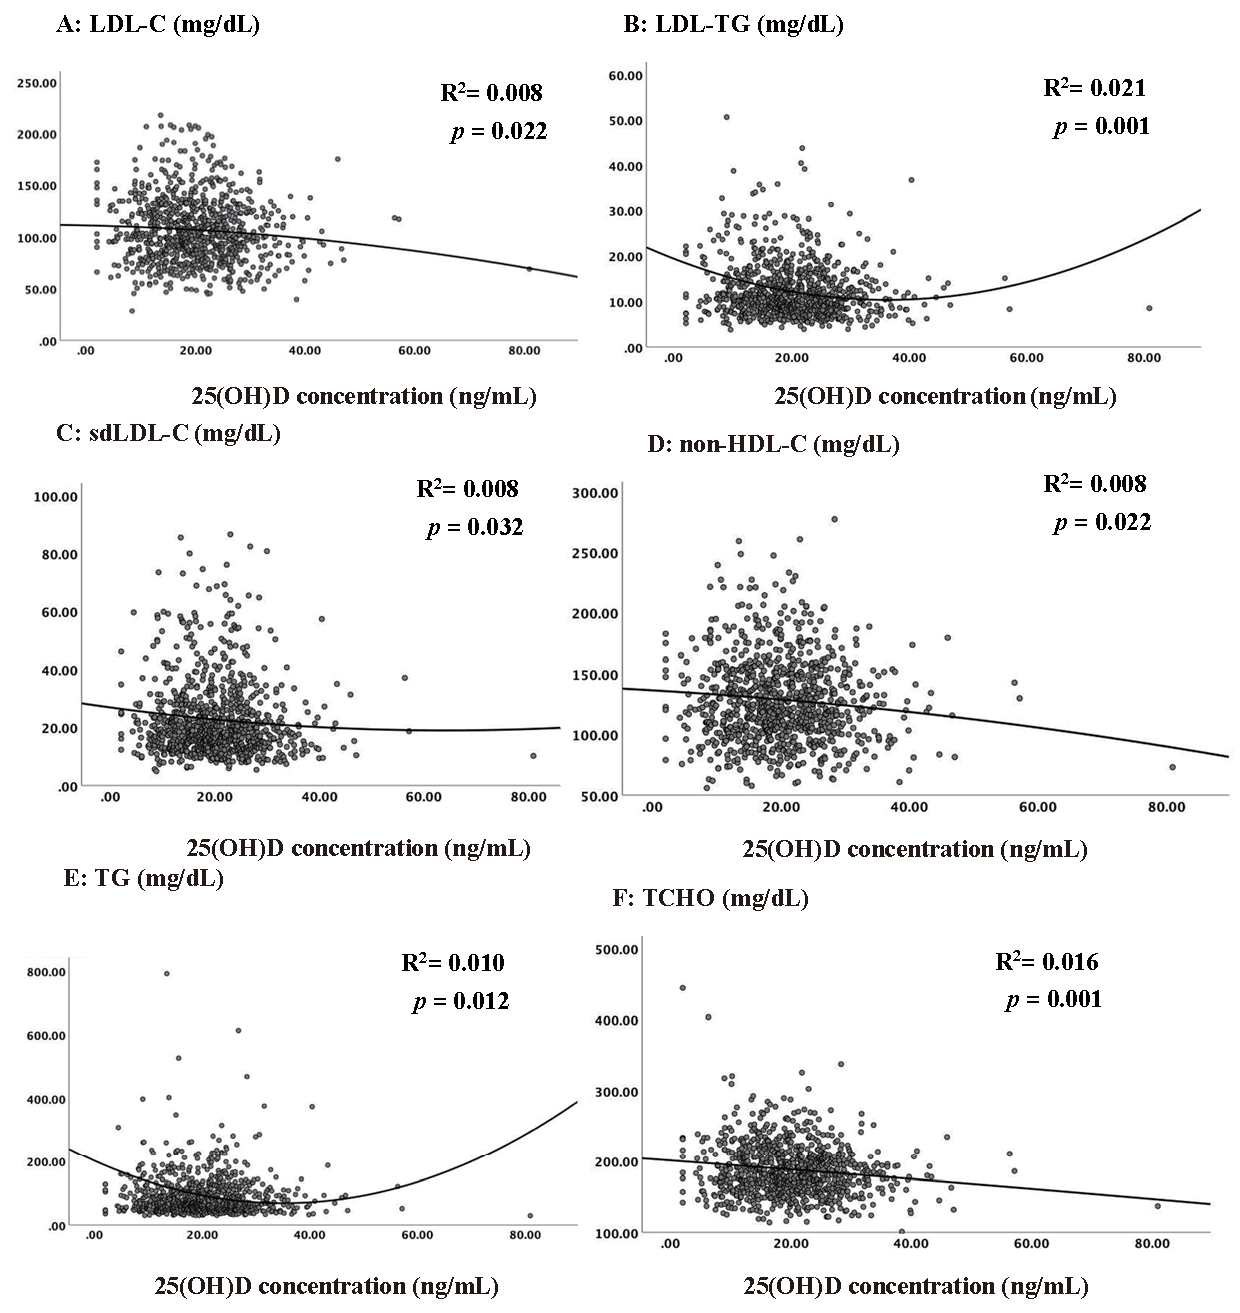
Multivariable linear regression was employed to examine the association between lipid markers and serum 25(OH)D levels (Table 3). The analysis was conducted using four different models with increasing adjustment levels for possible confounding factors. Model 1 was unadjusted, whereas Model 2 was adjusted for age and sex. Model 3 was additionally adjusted for BMI, systolic blood pressure, serum creatinine, HOMA-IR, hs-CRP, and serum calcium level. Model 4 added alcohol consumption, cigarette smoking, educational level, and regular exercise habits to the variables in Model 3. The results of multivariable linear regression indicated that serum 25(OH)D level was significantly associated with lower LDL-C, LDL-TG, sdLDL-C, TG, and TCHO levels in all models after controlling for possible confounding factors. The investigation of scatterplot for serum 25(OH)D levels and lipid markers using nonlinear regression indicated that the association between the lipid values and serum 25(OH)D levels was approximately linear among most of the participants (more than 95%). The fitted nonlinear curves were caused only by a few points (Supplemental Fig.1).
Table 3.The correlation between 25(OH)D vitamin D levels and lipid profile markers by multivariable linear regression analysis
|
Model 1 |
Model 2 |
| Beta |
SE |
95% CI |
p value
|
Beta |
SE |
95% CI |
p value
|
| LDL-C |
-0.262 |
0.112 |
-0.483 ~ -0.041 |
0.020 |
-0.418 |
0.111 |
-0.636 ~ -0.199 |
0.020 |
| LDL-TG |
-0.122 |
0.042 |
-0.204 ~ -0.040 |
0.003 |
-0.152 |
0.761 |
-0.235 ~ -0.069 |
0.003 |
| sdLDL-C |
-0.145 |
0.053 |
-0.250 ~ -0.041 |
0.006 |
-0.234 |
0.052 |
-0.336 ~ -0.133 |
0.006 |
| non-HDL-C |
-0.385 |
0.149 |
-0.679 ~ -0.092 |
0.010 |
-0.588 |
0.148 |
-0.878 ~ -0.298 |
0.010 |
| TG |
-1.850 |
0.915 |
-3.647 ~ -0.054 |
0.044 |
-2.407 |
0.926 |
-4.225 ~ -0.589 |
0.010 |
| TCHO |
-0.516 |
0.149 |
-0.808 ~ -0.225 |
0.001 |
-0.578 |
0.150 |
-0.872 ~ -0.283 |
0.001 |
|
Model 3 |
Model 4 |
| Beta |
SE |
95% CI |
p value
|
Beta |
SE |
95% CI |
p value
|
| LDL-C |
-0.355 |
0.110 |
-0.571 ~ -0.139 |
0.020 |
-0.342 |
0.110 |
-0.557 ~ -0.126 |
0.030 |
| LDL-TG |
-0.125 |
0.041 |
-0.205 ~ -0.044 |
0.002 |
-0.116 |
0.041 |
-0.196 ~ -0.036 |
0.005 |
| sdLDL-C |
-0.187 |
0.049 |
-0.284 ~ -0.092 |
0.010 |
-0.174 |
0.049 |
-0.270 ~ -0.079 |
0.010 |
| non-HDL-C |
-0.508 |
0.145 |
-0.792 ~ -0.224 |
0.010 |
-0.468 |
0.144 |
-0.751 ~ -0.185 |
0.020 |
| TG |
-2.244 |
0.929 |
-4.068 ~ -0.421 |
0.016 |
-2.030 |
0.931 |
-3.856 ~ -0.204 |
0.029 |
| TCHO |
-0.533 |
0.150 |
-0.827 ~ -0.238 |
0.001 |
-0.494 |
0.151 |
-0.791 ~ -0.198 |
0.001 |
Model 1: unadjusted; Model 2: adjusted for age and sex; Model 3: adjusted for age, sex, body mass index, systolic blood pressure, serum creatinine, HOMA-IR, hsCRP, and serum calcium level; Model 4: adjusted for age, sex, body mass index, systolic blood pressure, serum creatinine, HOMA-IR, hsCRP, serum calcium level, alcohol consumption, cigarette smoking, education level and regular exercise habits.
Abbreviations: LDL-C: low-density lipoprotein cholesterol, LDL-TG: low-density lipoprotein triglycerides, sdLDL-C: small dense LDL cholesterol, non-HDL-C: non-HDL cholesterol, TG: triglycerides, TCHO: total cholesterol, HOMA-IR: Homeostatic Model Assessment for Insulin Resistance, hsCRP: high-sensitivity C-reactive protein, SE: standard error
Logistic regression analysis was conducted to evaluate the odds ratio of markers for atherogenic dyslipidemia between groups with different serum 25(OH)D levels (Table 4). The markers of atherogenic dyslipidemia were LDL-C ≥ 130 mg/dL, LDL-C ≥ 75th percentile, LDL-TG ≥ 75th percentile, sdLDL-C ≥ 40 mg/dL, non-HDL-C >130 mg/dL, and TCHO ≥ 200 mg/dL according to previous studies and guidelines. The 75th percentile level for LDL-C was recorded at 125.5 mg/dL. The analysis was controlled for age, sex, BMI, systolic blood pressure, serum creatinine, HOMA-IR, hs-CRP, serum calcium level, alcohol consumption, cigarette smoking, educational level, and regular exercise habits. The reference group was the group with serum 25(OH)D levels greater than 30 ng/mL. The results indicated that groups with vitamin D levels below 30 ng/mL exhibited a significantly increased odds ratio for developing atherogenic dyslipidemia. Specifically, groups with vitamin D levels <12, 12–20, and 20–30 ng/mL exhibited increased risks. This association between vitamin D levels and the risk of atherogenic dyslipidemia was characterized by a dose–response risk pattern, with lower vitamin D levels correlating with higher risks, showing the inverse proportionality between vitamin D concentrations and the likelihood of developing atherogenic dyslipidemia (Table 4).
Table 4.Odds ratios of developing atherogenic dyslipidemia in different 25(OH)D groups
|
Markers for atherogenic dyslipidemia |
| 25(OH)D groups |
LDL-C
≥ 130 mg/dL
|
LDL-C
≥ 75th percentile‡
|
LDL-TG
≥ 75 th percentile
|
sdLDL-C
≥ 40 mg/dL
|
non-HDL-C
>130 mg/dL
|
TCHO
≥ 200 mg/dL
|
| <12 ng/mL |
4.72 |
3.92 |
2.96 |
6.59 |
2.29 |
4.58 |
|
(2.05–10.8)*
|
(1.89–8.18)*
|
(1.40–6.24)*
|
(1.58–27.5)*
|
(1.31–4.01)*
|
(2.63–9.27)*
|
| 12-20 ng/mL |
4.26 |
3.42 |
2.81 |
6.60 |
1.73 |
4.52 |
|
(1.81–10.1)*
|
(1.60–7.33)*
|
(1.28–6.14)*
|
(1.62–26.8)*
|
(1.01–3.00)*
|
(2.18–9.38)*
|
| 20-30 ng/mL |
2.94 |
2.72 |
2.60 |
6.82 |
1.68 |
3.57 |
|
(1.28–6.74)*
|
(1.31–5.64)*
|
(1.25–5.43)*
|
(1.70–27.4)*
|
(0.93–3.04) |
(1.78–7.19)*
|
| >30 ng/mL |
1 (reference) |
1 (reference) |
1 (reference) |
1 (reference) |
1 (reference) |
1 (reference) |
| p value for trend+
|
0.01 |
0.01 |
0.01 |
0.30 |
0.01 |
0.01 |
*p value <0.05 compared to the reference group by logistic regression
+p value for trend calculated by Cochran-Armitage test for trend.
‡75th percentile of LDL-C was 125.5 mg/dL
The results were presented as Odds ratio (95% confidence interval)
The model was adjusted for age, sex, body mass index, systolic blood pressure, serum creatinine, HOMA-IR, hsCRP, serum calcium level, alcohol consumption, cigarette smoking, education level and regular exercise habits.
Logistic regression analysis was conducted to estimate the interquartile range odds ratio. Specifically, the odds ratio of LDL-C ≥ 130 mg/dL (Table 5), LDL-TG ≥ 75th percentile (Supplemental Table 1), and sdLDL-C ≥ 40 mg/dL (Supplemental Table 2) in various subgroups was investigated using a logistic regression model with 25(OH)D as a continuous independent variable. For each subgroup, the odds ratio per interquartile range increase in 25(OH)D levels was calculated. Sensitivity test for atherogenic dyslipidemia was conducted according to sex, age, BMI, smoking, alcohol consumption, and regular exercise habits. P for interaction was used to determine whether there was a statistically significant difference between the subgroups. Subgroup analysis revealed a significant association between higher odds ratio of LDL-TG ≥ 75th percentile and 25(OH)D levels specifically within the women subgroup (Supplemental Table 1). Contrarily, no significant associations were observed in the other subgroups, including those related to LDL-C ≥ 130 mg/dL (Table 5) and sdLDL-C ≥ 40 mg/dL (Supplemental Table 2). This suggests that the association between serum 25(OH)D levels and atherogenic dyslipidemia was not significantly different across subgroups defined by sex, age, BMI, smoking, or exercise, except for the odds ratio of LDL-TG ≥ 75th percentile in women.
Table 5.The odds ratio of LDL-C levels ≥ 130 mg/dL in specific subgroup analyses by logistic regression model with 25(OH)D as a continuous independent variable
| Subgroup |
N/Subgroup |
Odds ratio |
95% CI |
p value
|
p value for interaction
|
| Overall |
207/976 |
0.705 |
0.578 – 0.861 |
0.001 |
|
| Sex |
|
|
|
|
|
| Men |
113/407 |
0.716 |
0.549 – 0.933 |
0.013 |
0.873 |
| Women |
94/569 |
0.704 |
0.518 – 0.957 |
0.025 |
|
| Age |
|
|
|
|
|
| ≥ 30 y/o |
157/679 |
0.721 |
0.575 – 0.904 |
0.005 |
0.576 |
| <30 y/o |
50/297 |
0.666 |
0.431 – 1.030 |
0.068 |
|
| BMI |
|
|
|
|
|
| ≥ 24 kg/m2
|
104/343 |
0.594 |
0.437 – 0.809 |
0.001 |
0.052 |
| <24 kg/m2
|
103/633 |
0.797 |
0.612 – 1.038 |
0.093 |
|
| Smoking |
|
|
|
|
|
| Yes |
33/132 |
0.560 |
0.308 – 1.020 |
0.058 |
0.738 |
| No |
174/844 |
0.721 |
0.582 – 0.894 |
0.003 |
|
| Exercise |
|
|
|
|
|
| Yes |
110/566 |
0.560 |
0.308 – 1.020 |
0.058 |
0.202 |
| No |
97/410 |
0.721 |
0.582 – 0.894 |
0.003 |
|
The odds ratio per interquartile range increase in 25(OH)D levels was calculated for each subgroup.
Q1 lower quartile of 25(OH)D: 13.23 ng/mL; Q3 upper quartile of 25(OH)D: 23.58 ng/mL
Interquartile range of 25(OH)D = 10.35 ng/mL
The models were adjusted for age, sex, body mass index, systolic blood pressure, serum creatinine, HOMA-IR, hsCRP, serum calcium level, alcohol consumption, cigarette smoking, education level and regular exercise habits, except for the variable in the subgroup analysis.
Supplemental Table 1.The odds ratio of LDL-TG ≥ 75th percentile in specific subgroup analyses by logistic regression model with 25(OH)D as a continuous independent variable
| Subgroup |
N/Subgroup |
Odds ratio |
95% CI |
p value
|
p value for interaction
|
| Overall |
246/976 |
0.796 |
0.650 – 0.974 |
0.026 |
|
| Sex |
|
|
|
|
|
| Men |
143/407 |
0.977 |
0.755 – 1.265 |
0.860 |
0.075 |
| Women |
103/569 |
0.578 |
0.416 – 0.802 |
0.001 |
|
| Age |
|
|
|
|
|
| ≥ 30 y/o |
195/679 |
0.788 |
0.628 – 0.988 |
0.039 |
0.562 |
| <30 y/o |
51/297 |
0.859 |
0.541 – 1.363 |
0.518 |
|
| BMI |
|
|
|
|
|
| ≥ 24 kg/m2
|
104/343 |
0.834 |
0.614 – 1.131 |
0.243 |
0.701 |
| <24 kg/m2
|
103/633 |
0.784 |
0.596 – 1.031 |
0.082 |
|
| Smoking |
|
|
|
|
|
| Yes |
52/132 |
0.855 |
0.525 – 1.392 |
0.528 |
0.654 |
| No |
194/844 |
0.790 |
0.631 – 0.989 |
0.040 |
|
| Exercise |
|
|
|
|
|
| Yes |
111/566 |
0.767 |
0.581 – 1.014 |
0.062 |
0.396 |
| No |
135/410 |
0.822 |
0.603 – 1.121 |
0.216 |
|
The odds ratio per interquartile range increase in 25(OH)D levels was calculated for each subgroup.
Q1 lower quartile of 25(OH)D: 13.23 ng/mL; Q3 upper quartile of 25(OH)D: 23.58 ng/mL
Interquartile range of 25(OH)D = 10.35 ng/mL
The models were adjusted for age, sex, body mass index, systolic blood pressure, serum creatinine, HOMA-IR, hsCRP, serum calcium level, alcohol consumption, cigarette smoking, education level and regular exercise habits, except for the variable in the subgroup analysis.
Supplemental Table 2.The odds ratio of sdLDL-C ≥ 40 mg/dL in specific subgroup analyses by logistic regression model with 25(OH)D as a continuous independent variable
| Subgroup |
N/Subgroup |
Odds ratio |
95% CI |
p value
|
p value for interaction
|
| Overall |
246/976 |
0.709 |
0.537 – 0.937 |
0.016 |
|
| Sex |
|
|
|
|
|
| Men |
143/407 |
0.775 |
0.567 – 1.059 |
0.109 |
0.260 |
| Women |
103/569 |
0.504 |
0.272 – 0.934 |
0.030 |
|
| Age |
|
|
|
|
|
| ≥ 30 y/o |
195/679 |
0.754 |
0.557 – 1.020 |
0.067 |
0.609 |
| <30 y/o |
51/297 |
0.498 |
0.227 – 1.096 |
0.083 |
|
| BMI |
|
|
|
|
|
| ≥ 24 kg/m2
|
104/343 |
0.760 |
0.545 – 1.060 |
0.078 |
0.598 |
| <24 kg/m2
|
103/633 |
0.688 |
0.405 – 1.167 |
0.165 |
|
| Smoking |
|
|
|
|
|
| Yes |
52/132 |
0.843 |
0.490 – 1.452 |
0.538 |
0.604 |
| No |
194/844 |
0.678 |
0.489 – 0.939 |
0.019 |
|
| Exercise |
|
|
|
|
|
| Yes |
111/566 |
0.786 |
0.514 – 1.203 |
0.267 |
0.955 |
| No |
135/410 |
0.753 |
0.503 – 1.127 |
0.168 |
|
The odds ratio per interquartile range increase in 25(OH)D levels was calculated for each subgroup.
Q1 lower quartile of 25(OH)D: 13.23 ng/mL; Q3 upper quartile of 25(OH)D: 23.58 ng/mL
Interquartile range of 25(OH)D = 10.35 ng/mL
The models were adjusted for age, sex, body mass index, systolic blood pressure, serum creatinine, HOMA-IR, hsCRP, serum calcium level, alcohol consumption, cigarette smoking, education level and regular exercise habits, except for the variable in the subgroup analysis.
The results of the SEM analyses indicated that serum 25(OH)D levels and HOMA-IR, a marker of insulin resistance, were independently associated with all markers of dyslipidemia. However, it was found that vitamin D did not affect lipid profiles through the mediation of HOMA-IR (Supplemental Fig.2). Moreover, SEM analyses investigating the associations among serum 25(OH)D, hs-CRP, and lipid markers revealed that higher vitamin D levels were associated with increased hs-CRP levels. However, after controlling for confounding factors, hs-CRP did not exhibit a significant association with lipid markers (Supplemental Fig.3).
Discussions
There were two major findings in this study. First, serum 25(OH) D deficiency was associated with more severe dyslipidemia characterized by higher levels of LDL-C, LDL-TG, sdLDL-C, non-HDL-C, TG, and TCHO in young adults. Those with vitamin D deficiency had a higher risk for atherogenic dyslipidemia. Second, the groups with serum 25(OH)D levels lower than 30 ng/mL had a significantly higher odds ratio for developing atherogenic dyslipidemia than the group with serum 25(OH)D levels higher than 30 ng/mL. This correlation between vitamin D concentrations and the likelihood of atherogenic dyslipidemia manifested as a dose–response relationship.
A high prevalence of vitamin D deficiency has been recorded worldwide16). Children and adolescents are exposed to the same risk, as nearly 50% of the young population has 25(OH)D levels below 20 ng/mL22). These results are consistent with the results of our study. The cause of vitamin D deficiency is multifactorial. It was previously thought that vitamin D deficiency is limited to people living in high-latitude countries due to a lack of adequate sun exposure. However, a high prevalence of vitamin D deficiency was reported in the United States (41.6%), Australia (31% deficiency and 73% insufficiency), and Saudi Arabia (87%)23). Thus, the high prevalence of vitamin D deficiency could not be explained by inadequate sun exposure alone. Certain ethnic subgroups are more vulnerable to vitamin D deficiency24). However, ethnic differences could not be fully explained due to the high prevalence of vitamin D deficiency worldwide.
Previous studies demonstrated an association between vitamin D deficiency and atherogenic dyslipidemia10). Furthermore, vitamin D deficiency was previously reported to be associated with high sdLDL-C levels among middle-aged adults18). This association was also observed both in the studies involving people of Asian ethnicity25) and patients with ST-elevation myocardial infarction26). Our study results were all compatible with these study results. The findings of negative association between nearly all types of dyslipidemia and serum 25(OH)D levels in young adults also corroborated vitamin D deficiency as a nutritional etiology of CVD linkage and extended the potential proactive prevention pathway for cardiovascular health.
Among the various lipid markers of atherogenic dyslipidemia, LDL-TG, one of the LDL-C subclasses, were significantly associated with metabolic syndrome in children27). LDL-TG also represents a marker for dysfunctional remnant lipoproteins and is associated with a higher risk of coronary artery disease28). In a 5-year cohort study of a healthy general population, baseline LDL-TG levels were found to be predictors of major adverse cardiovascular events29). These results indicated that LDL-TG is an important marker for atherogenic dyslipidemia.
Vitamin D deficiency may cause atherogenic dyslipidemia through various pathophysiological mechanisms30). Previous studies suggested that vitamin D exerts its antiatherogenic effects by regulating immune and inflammatory responses through various mechanisms, such as stimulation of nitric oxide production, inhibition of oxidative stress, reduction of proinflammatory cytokine expression, inhibition of vascular smooth muscle cell proliferation, and secretion of inflammatory molecules31).
Another possible mechanism is by causing insulin resistance. Previous studies reported that vitamin D deficiency was associated with insulin resistance and the onset of diabetes mellitus32). Several possible mechanisms have also been proposed, including stimulation of insulin secretion by vitamin D through intracellular Ca2+ regulation, increase in organ insulin receptor expression33), inhibition of the renin–angiotensin–aldosterone system, and increase in reactive oxidative stress and pancreatic islet cell apoptosis34).
There were mixed results among the different studies. A cross-sectional analysis supported the association between serum 25(OH)D levels and a lower risk of insulin resistance35). However, prospective studies reported that insulin resistance was not associated with serum 25(OH)D levels36). SEM was employed to evaluate the associations among serum 25(OH)D levels, dyslipidemia, and insulin resistance37). The results of our study indicated that the association between serum 25(OH)D levels and dyslipidemia cannot be explained by the mediator of insulin resistance.
A bidirectional Mendelian randomization study involving 294,970 participants reported an association between vitamin D deficiency and elevated level of C-reactive protein14). Therefore, we conducted SEM analyses to investigate the potential role of C-reactive protein in the association between vitamin D and atherogenic dyslipidemia. However, our analyses revealed that elevated hs-CRP was not significantly associated with increased markers for atherogenic dyslipidemia. Consequently, it appears that the mechanism linking atherogenic dyslipidemia and vitamin D levels does not involve elevated hs-CRP.
Vitamin D deficiency-induced dyslipidemia may also be caused by elevated levels of parathyroid hormone (PTH)38). Excess PTH could lead to uncontrolled inflammation and worsened pancreatic beta-cell dysfunction30). Serum calcium was regulated by PTH. A previous study linked vitamin D deficiency and arterial stiffness to PTH39). A previous study has proposed that insoluble calcium-fatty acid complexes can reduce the absorption of fatty acids from the intestine and further decrease serum cholesterol levels40). Another study has also suggested that serum calcium lowers cholesterol levels by facilitating the conversion of cholesterol into bile acids41).
Our study demonstrated that the groups with 25(OH)D levels less than 12 ng/mL, between 12 and 20 ng/mL, and between 20 and 30 ng/mL exhibited statistically significantly elevated odds ratios for atherogenic dyslipidemia in a dose–response risk pattern compared with the group with 25(OH)D levels surpassing 30 ng/mL. This finding indicated that maintaining serum 25(OH)D levels above 30 ng/mL may help prevent atherogenic dyslipidemia. This is compatible with the current guidelines for vitamin D deficiency to maintain serum 25(OH)D levels above 30 ng/mL42).
The results of the subgroup analyses indicated that while a specific association exists between higher odds of LDL-TG ≥ 75th percentile and serum 25(OH)D levels in women, other subgroups did not exhibit a significant association. The observed sex-specific association between serum 25(OH)D levels and LDL-TG ≥ 75th percentile in women suggests a potential role of vitamin D in influencing atherogenic dyslipidemia, particularly within this subgroup. The mechanisms underlying this association remain unclear and warrant further investigation. One possible explanation could be the interaction between sex hormones and vitamin D, as estrogen has been demonstrated to modulate the metabolism of lipids and affect lipid profile composition. Further research is warranted to investigate the interplay between vitamin D, sex hormones, and atherogenic dyslipidemia in women. However, our study findings indicated a consistent vulnerability to the association between vitamin D deficiency and atherogenic dyslipidemia across all other subgroups.
This study has several limitations. First, this was a cross-sectional study. Future follow-up studies, such as longitudinal studies or clinical trials, can help establish causality and determine the long-term effects of an intervention or exposure. Second, dietary habits were not considered. Dietary habits may affect both vitamin D status and dyslipidemia. Our previous study demonstrated that 25(OH)D level was lower in vegetarians compared with those who were not43). A study of 6,808 participants reported that vegetarian diet lowered the LDL-C levels44). Vegetarians may also have a lower risk of insulin resistance, glucose metabolism, and diabetes45). Thus, dietary habits may significantly impact lipid status and health outcomes. Controlling for dietary habits in the analysis can help reduce the potential for confounding and increase accuracy and reliability. Thus, dietary habits should be evaluated in future studies. Second, regular exercise habit was used as the physical activity marker in this study. Third, the details of physical activity were not considered. Indoor or outdoor activity, duration, and intensity of the physical activity should be taken into account in the analyses. These factors may cause different pathophysiological effects on serum 25(OH)D levels and dyslipidemia.
The strength of our study is that it is the first study to confirm the association between vitamin D deficiency and atherogenic dyslipidemia among young adults. Previous studies mostly focused only on elderly or middle-aged populations. Furthermore, our study focused on subpopulations of LDL-C (LDL-C, LDL-TG, and sdLDL-C), whereas previous ones were centered on traditional markers of dyslipidemia. Our study highlighted the benefits of maintaining serum 25(OH)D levels above the sufficiency threshold to reduce the likelihood of atherogenic dyslipidemia, whereas other studies focused on the risks of vitamin D deficiency. The consistent negative associations between serum 25(OH)D ≥ 30 ng/mL and five different biomarkers of atherogenic dyslipidemia also corroborated the importance of maintaining serum 25(OH)D levels in the proactive prevention of CVD.
Conclusion
Our study evidenced the association between vitamin D deficiency and atherogenic dyslipidemia among young adults. Furthermore, our results indicated that individuals with serum 25(OH)D levels below 30 ng/mL exhibited significantly elevated odds ratio for developing atherogenic dyslipidemia in a dose–response risk pattern compared with those with adequate levels of vitamin D above 30 ng/mL. These findings highlight the potential role of vitamin D in dyslipidemia management and the importance of maintaining adequate vitamin D levels in young adults for cardiovascular health.
Conflict of Interest Disclosure
The authors have nothing to disclose.
Author Contributions
Conceptualization, Ching-Way Chen, and Ta-Chen Su; Data curation, Jing-Shiang Hwang; Formal analysis, Jing-Shiang Hwang; Funding acquisition, Yin-Yi Han; Investigation, Yin-Yi Han; Methodology, Sandy Huey-Jen Hsu; Project administration, Ta-Chen Su; Resources, Manfredi Rizzo; Software, Ching-Way Chen; Supervision, Shizuya Yamashita; Validation, Manfredi Rizzo; Visualization, Shizuya Yamashita; Writing – original draft, Ching-Way Chen; Writing – review & editing, Jing-Shiang Hwang, Sandy Huey-Jen Hsu, and Ta-Chen Su.
Funding
This research was funded by National Health Research Institute of Taiwan, grant number NHRI EX95-9531PI and NHRI EX106-10629PI.
Institutional Review Board Statement
The study was conducted according to the guidelines of the Declaration of Helsinki and approved by the Institutional Review Board of National Taiwan University Hospital.
Informed Consent Statement
Informed consent was obtained from all subjects involved in the study.
Acknowledgments
We thank all participants who were recruited in the National Health Research Institute grant-supported study during 2017–2019 (NHRI-EX106-10629PI), with the grant proposal “Effects of living environments and dietary habits on cardiometabolic disorders in young adults”. We thank associate professor Cheng-Chih Hsu for the measurements of urinary phthalate metabolites by the Mass Spectrometry, Analytical Chemistry Laboratory. We thank Dr. Kuo-Tong Huang and Nan-Chang Clinical Laboratory for the study space and laboratory analysis support. We also thank the 3rd core laboratory of National Taiwan University Hospital.
This paper had been presented in the 55th Annual Scientific Meeting of the Japan Atherosclerosis Society (JAS2023).
References
- 1) Roth GA, Johnson C, Abajobir A, Abd-Allah F, Abera SF, Abyu G, Ahmed M, Aksut B, Alam T, Alam K, Alla F, Alvis-Guzman N, Amrock S, Ansari H, Ärnlöv J, Asayesh H, Atey TM, Avila-Burgos L, Awasthi A, Banerjee A, Barac A, Bärnighausen T, Barregard L, Bedi N, Belay Ketema E, Bennett D, Berhe G, Bhutta Z, Bitew S, Carapetis J, Carrero JJ, Malta DC, Castañeda-Orjuela CA, Castillo-Rivas J, Catalá-López F, Choi JY, Christensen H, Cirillo M, Cooper L, Jr., Criqui M, Cundiff D, Damasceno A, Dandona L, Dandona R, Davletov K, Dharmaratne S, Dorairaj P, Dubey M, Ehrenkranz R, El Sayed Zaki M, Faraon EJA, Esteghamati A, Farid T, Farvid M, Feigin V, Ding EL, Fowkes G, Gebrehiwot T, Gillum R, Gold A, Gona P, Gupta R, Habtewold TD, Hafezi-Nejad N, Hailu T, Hailu GB, Hankey G, Hassen HY, Abate KH, Havmoeller R, Hay SI, Horino M, Hotez PJ, Jacobsen K, James S, Javanbakht M, Jeemon P, John D, Jonas J, Kalkonde Y, Karimkhani C, Kasaeian A, Khader Y, Khan A, Khang YH, Khera S, Khoja AT, Khubchandani J, Kim D, Kolte D, Kosen S, Krohn KJ, Kumar GA, Kwan GF, Lal DK, Larsson A, Linn S, Lopez A, Lotufo PA, El Razek HMA, Malekzadeh R, Mazidi M, Meier T, Meles KG, Mensah G, Meretoja A, Mezgebe H, Miller T, Mirrakhimov E, Mohammed S, Moran AE, Musa KI, Narula J, Neal B, Ngalesoni F, Nguyen G, Obermeyer CM, Owolabi M, Patton G, Pedro J, Qato D, Qorbani M, Rahimi K, Rai RK, Rawaf S, Ribeiro A, Safiri S, Salomon JA, Santos I, Santric Milicevic M, Sartorius B, Schutte A, Sepanlou S, Shaikh MA, Shin MJ, Shishehbor M, Shore H, Silva DAS, Sobngwi E, Stranges S, Swaminathan S, Tabarés-Seisdedos R, Tadele Atnafu N, Tesfay F, Thakur JS, Thrift A, Topor-Madry R, Truelsen T, Tyrovolas S, Ukwaja KN, Uthman O, Vasankari T, Vlassov V, Vollset SE, Wakayo T, Watkins D, Weintraub R, Werdecker A, Westerman R, Wiysonge CS, Wolfe C, Workicho A, Xu G, Yano Y, Yip P, Yonemoto N, Younis M, Yu C, Vos T, Naghavi M and Murray C: Global, Regional, and National Burden of Cardiovascular Diseases for 10 Causes, 1990 to 2015. J Am Coll Cardiol, 2017; 70: 1-25
- 2) Berberich AJ and Hegele RA: A Modern Approach to Dyslipidemia. Endocrine Reviews, 2021; 43: 611-653
- 3) Ferrieres J, Bongard V, Arveiler D, Dallongeville J, Wagner A, Amouyel P, Valensi P and Ruidavets JB: Long-term impact on mortality of residual dyslipidemia. European Heart Journal, 2013; 34:
- 4) Xiao C, Dash S, Morgantini C, Hegele RA and Lewis GF: Pharmacological Targeting of the Atherogenic Dyslipidemia Complex: The Next Frontier in CVD Prevention Beyond Lowering LDL Cholesterol. Diabetes, 2016; 65: 1767-1778
- 5) Takahashi S, Sakai J, Fujino T, Hattori H, Zenimaru Y, Suzuki J, Miyamori I and Yamamoto TT: The very low-density lipoprotein (VLDL) receptor: characterization and functions as a peripheral lipoprotein receptor. J Atheroscler Thromb, 2004; 11: 200-208
- 6) Tsao CW, Aday AW, Almarzooq ZI, Alonso A, Beaton AZ, Bittencourt MS, Boehme AK, Buxton AE, Carson AP, Commodore-Mensah Y, Elkind MSV, Evenson KR, Eze-Nliam C, Ferguson JF, Generoso G, Ho JE, Kalani R, Khan SS, Kissela BM, Knutson KL, Levine DA, Lewis TT, Liu J, Loop MS, Ma J, Mussolino ME, Navaneethan SD, Perak AM, Poudel R, Rezk-Hanna M, Roth GA, Schroeder EB, Shah SH, Thacker EL, VanWagner LB, Virani SS, Voecks JH, Wang NY, Yaffe K and Martin SS: Heart Disease and Stroke Statistics-2022 Update: A Report From the American Heart Association. Circulation, 2022; 145: e153-e639
- 7) Bjornstad P and Eckel RH: Pathogenesis of Lipid Disorders in Insulin Resistance: a Brief Review. Curr Diab Rep, 2018; 18: 127
- 8) Jiang X, Peng M, Chen S, Wu S and Zhang W: Vitamin D deficiency is associated with dyslipidemia: a cross-sectional study in 3788 subjects. Curr Med Res Opin, 2019; 35: 1059-1063
- 9) Bischoff-Ferrari HA, Willett WC, Wong JB, Giovannucci E, Dietrich T and Dawson-Hughes B: Fracture prevention with vitamin D supplementation: a meta-analysis of randomized controlled trials. Jama, 2005; 293: 2257-2264
- 10) Surdu AM, Pînzariu O, Ciobanu DM, Negru AG, Căinap SS, Lazea C, Iacob D, Săraci G, Tirinescu D, Borda IM and Cismaru G: Vitamin D and Its Role in the Lipid Metabolism and the Development of Atherosclerosis. Biomedicines, 2021; 9:
- 11) Kim DH, Meza CA, Clarke H, Kim JS and Hickner RC: Vitamin D and Endothelial Function. Nutrients, 2020; 12:
- 12) Wolf ST, Jablonski NG, Ferguson SB, Alexander LM and Kenney WL: Four weeks of vitamin D supplementation improves nitric oxide-mediated microvascular function in college-aged African Americans. Am J Physiol Heart Circ Physiol, 2020; 319: H906-h914
- 13) Tanaka K, Okada Y, Hajime M and Tanaka Y: Low Vitamin D Levels are Associated with Vascular Endothelial Dysfunction in Patients with Poorly Controlled Type 2 Diabetes: A Retrospective Study. Journal of Atherosclerosis and Thrombosis, 2022; 29: 242-251
- 14) Zhou A and Hyppönen E: Vitamin D deficiency and C-reactive protein: a bidirectional Mendelian randomization study. Int J Epidemiol, 2023; 52: 260-271
- 15) Holick MF, Binkley NC, Bischoff-Ferrari HA, Gordon CM, Hanley DA, Heaney RP, Murad MH and Weaver CM: Evaluation, Treatment, and Prevention of Vitamin D Deficiency: an Endocrine Society Clinical Practice Guideline. The Journal of Clinical Endocrinology & Metabolism, 2011; 96: 1911-1930
- 16) Amrein K, Scherkl M, Hoffmann M, Neuwersch-Sommeregger S, Köstenberger M, Tmava Berisha A, Martucci G, Pilz S and Malle O: Vitamin D deficiency 2.0: an update on the current status worldwide. Eur J Clin Nutr, 2020; 74: 1498-1513
- 17) Pilz S, Trummer C, Theiler-Schwetz V, Grübler MR, Verheyen ND, Odler B, Karras SN, Zittermann A and März W: Critical Appraisal of Large Vitamin D Randomized Controlled Trials. Nutrients, 2022; 14:
- 18) Han YY, Hsu SH and Su TC: Association between Vitamin D Deficiency and High Serum Levels of Small Dense LDL in Middle-Aged Adults. Biomedicines, 2021; 9:
- 19) Sun X, Cao Z-B, Tanisawa K, Ito T, Oshima S, Ishimi Y, Tabata I and Higuchi M: Associations between the Serum 25(OH)D Concentration and Lipid Profiles in Japanese Men. Journal of Atherosclerosis and Thrombosis, 2015; 22: 355-362
- 20) Qasemi R, Ghavamzadeh S, Faghfouri AH, Valizadeh N, Mohammadi A and Sayyadi H: The effect of vitamin D supplementation on flow-mediated dilatation, oxidized LDL and intracellular adhesion molecule 1 on type 2 diabetic patients with hypertension: A randomized, placebo-controlled, double-blind trial. Diabetes Metab Syndr, 2021; 15: 102200
- 21) Tsugawa N, Suhara Y, Kamao M and Okano T: Determination of 25-hydroxyvitamin D in human plasma using high-performance liquid chromatography--tandem mass spectrometry. Anal Chem, 2005; 77: 3001-3007
- 22) Sullivan SS, Rosen CJ, Halteman WA, Chen TC and Holick MF: Adolescent girls in Maine are at risk for vitamin D insufficiency. Journal of the American Dietetic Association, 2005; 105: 971-974
- 23) Ardawi MS, Sibiany AM, Bakhsh TM, Qari MH and Maimani AA: High prevalence of vitamin D deficiency among healthy Saudi Arabian men: relationship to bone mineral density, parathyroid hormone, bone turnover markers, and lifestyle factors. Osteoporos Int, 2012; 23: 675-686
- 24) Forrest KYZ and Stuhldreher WL: Prevalence and correlates of vitamin D deficiency in US adults. Nutrition Research, 2011; 31: 48-54
- 25) Guan C, Fu S, Zhen D, Li X, Niu J, Cheng J, Zhao N, Liu J, Yin H and Tang X: Correlation of serum vitamin D with lipid profiles in middle-aged and elderly Chinese individuals. Asia Pac J Clin Nutr, 2020; 29: 839-845
- 26) Verdoia M, Viglione F, Boggio A, Stefani D, Panarotto N, Malabaila A, Rolla R, Soldà PL, Stecco A, Carriero A and De Luca G: Relationship between vitamin D and cholesterol levels in STEMI patients undergoing primary percutaneous coronary intervention. Nutr Metab Cardiovasc Dis, 2022; 32: 957-964
- 27) Tonouchi R, Okada T, Abe Y, Kazama M, Kuromori Y, Yoshino Y, Iwata F, Hara M, Saito E and Morioka I: Subclass distribution of low-density lipoprotein triglyceride and the clustering of metabolic syndrome components in Japanese children. Pediatr Int, 2021; 63: 664-670
- 28) Saeed A, Feofanova EV, Yu B, Sun W, Virani SS, Nambi V, Coresh J, Guild CS, Boerwinkle E, Ballantyne CM and Hoogeveen RC: Remnant-Like Particle Cholesterol, Low-Density Lipoprotein Triglycerides, and Incident Cardiovascular Disease. Journal of the American College of Cardiology, 2018; 72: 156-169
- 29) Ding XH, Ye P, Wang XN, Cao RH, Yang X, Xiao WK, Zhang Y, Bai YY and Wu HM: The predictive value of baseline LDL-TG level on major adverse cardiovascular events in a followed up cohort population. Eur Rev Med Pharmacol Sci, 2017; 21: 1060-1064
- 30) Holick MF: The vitamin D epidemic and its health consequences. J Nutr, 2005; 135: 2739s-2748s
- 31) Yin K and Agrawal DK: Vitamin D and inflammatory diseases. Journal of Inflammation Research, 2014; 7: 69-87
- 32) Berridge MJ: Vitamin D deficiency and diabetes. Biochemical Journal, 2017; 474: 1321-1332
- 33) Maestro B, Ntilde, Campi, Oacute, N J, Aacute, Vila N and Calle C: Stimulation by 1, 25-Dihydroxyvitamin D3 of Insulin Receptor Expression and Insulin Responsiveness for Glucose Transport in U-937 Human Promonocytic Cells. Endocrine Journal, 2000; 47: 383-391
- 34) Mohd Ghozali N, Giribabu N and Salleh N: Mechanisms Linking Vitamin D Deficiency to Impaired Metabolism: An Overview. Int J Endocrinol, 2022; 2022: 6453882
- 35) Zhou M and Huang R: Associations of Serum Total 25OHD, 25OHD3, and epi-25OHD3 with Insulin Resistance: Cross-Sectional Analysis of the National Health and Nutrition Examination Survey, 2011-2016. Nutrients, 2022; 14:
- 36) Saleem N, Rizvi NB and Elahi S: Prevalence of Vitamin D Deficiency and Its Association with Insulin Resistance in Obese Women with Normal Fasting Glucose. Biomed Res Int, 2021; 2021: 2259711
- 37) Gunzler D, Chen T, Wu P and Zhang H: Introduction to mediation analysis with structural equation modeling. Shanghai Arch Psychiatry, 2013; 25: 390-394
- 38) Lee JH, O’Keefe JH, Bell D, Hensrud DD and Holick MF: Vitamin D deficiency an important, common, and easily treatable cardiovascular risk factor? J Am Coll Cardiol, 2008; 52: 1949-1956
- 39) Pirro M, Manfredelli MR, Helou RS, Scarponi AM, Schillaci G, Bagaglia F, Melis F and Mannarino E: Association of Parathyroid Hormone and 25-OH-Vitamin D Levels with Arterial Stiffness in Postmenopausal Women with Vitamin D Insufficiency. Journal of Atherosclerosis and Thrombosis, 2012; 19: 924-931
- 40) Christakos S, Dhawan P, Porta A, Mady LJ and Seth T: Vitamin D and intestinal calcium absorption. Mol Cell Endocrinol, 2011; 347: 25-29
- 41) AlQuaiz AM, Kazi A, Youssef RM, Alshehri N and Alduraywish SA: Association between standardized vitamin 25(OH)D and dyslipidemia: a community-based study in Riyadh, Saudi Arabia. Environmental Health and Preventive Medicine, 2020; 25: 4
- 42) Cashman KD: Vitamin D Deficiency: Defining, Prevalence, Causes, and Strategies of Addressing. Calcified Tissue International, 2020; 106: 14-29
- 43) Crowe FL, Steur M, Allen NE, Appleby PN, Travis RC and Key TJ: Plasma concentrations of 25-hydroxyvitamin D in meat eaters, fish eaters, vegetarians and vegans: results from the EPIC-Oxford study. Public Health Nutr, 2011; 14: 340-346
- 44) Jian ZH, Chiang YC, Lung CC, Ho CC, Ko PC, Ndi Nfor O, Chang HC, Liaw YC, Liang YC and Liaw YP: Vegetarian diet and cholesterol and TAG levels by gender. Public Health Nutr, 2015; 18: 721-726
- 45) Chiu TH, Huang HY, Chiu YF, Pan WH, Kao HY, Chiu JP, Lin MN and Lin CL: Taiwanese vegetarians and omnivores: dietary composition, prevalence of diabetes and IFG. PloS one, 2014; 9: e88547