Abstract
Aim: No data are currently available regarding the association between Lp(a) and the cardiovascular outcomes in patients with coronary artery disease (CAD) according to their family history (FHx) of CAD. This study aimed to evaluate the significance of Lp(a) in predicting major adverse cardiovascular events (MACEs) in patients with chronic coronary syndrome (CCS) with or without FHx.
Methods: A total of 6056 patients with CCS were enrolled. Information on FHx was collected, and the plasma Lp(a) levels were measured. All patients were followed up regularly. The independent and joint associations of Lp(a) and FHx with the risk of MACEs, including cardiovascular death, nonfatal myocardial infarction, and stroke, were analyzed.
Results: With over an average of 50.35±18.58 months follow-up, 378 MACEs were recorded. A Cox regression analysis showed an elevated Lp(a) level to be an independent predictor for MACEs in patients with [hazard ratio (HR): 2.77, 95% confidence interval (CI): 1.38-5.54] or without FHx (HR: 1.35, 95% CI: 1.02-1.77). In comparison to subjects with non-elevated Lp(a) and negative FHx, patients with elevated Lp(a) alone were at a nominally higher risk of MACEs (HR: 1.26, 95% CI: 0.96-1.67), while those with both had the highest risk (HR: 1.93, 95% CI: 1.14-3.28). Moreover, adding Lp(a) to the original model increased the C-statistic by 0.048 in subjects with FHx (p=0.004) and by 0.004 in those without FHx (p=0.391).
Conclusions: The present study is the first to suggest that Lp(a) could be used to predict MACEs in CCS patients with or without FHx; however, its prognostic significance was more noteworthy in patients with FHx.
Introduction
Currently, the circulating lipoprotein (a) [Lp(a)] levels have been recognized as a classical and independent predictor of cardiovascular risk1). It is an inherited atherogenic lipoprotein composed of a low-density lipoprotein (LDL) particle and a highly polymorphic apolipoprotein (a) [apo(a)], which is attached with a disulfide bond to apolipoprotein B-100 on the LDL core2). The structural characteristics of Lp(a) may supply it with the pathophysiological function of atherogenesis and thrombogenesis3). Moreover, more than 90% of the variance in Lp(a) concentrations is determined by genetics; thus, high Lp(a) levels might have lifelong effects on human health4, 5). Over the past decade, epidemiological studies, meta-analyses, Mendelian randomization studies, and genome-wide association studies have provided substantial evidence that Lp(a) is independently and likely causally associated with the incidence of atherosclerotic cardiovascular disease (CVD)6-9). Furthermore, there is growing evidence that Lp(a) plays a significant role in predicting subsequent cardiovascular events (CVEs) in patients with established coronary artery disease (CAD)10-13).
A family history (FHx) of CAD has also been established as an independent risk factor that plays an important role in the occurrence of a first adverse CVE and improves risk assessment in patients without known CAD14, 15). Plasma Lp(a) measurement is therefore recommended by both American and European guidelines for subjects with FHx16, 17). A recent study by Mehta et al.14) suggested that elevated plasma Lp(a) and FHx have independent and additive joint associations with cardiovascular risk in participants who were free of prevalent CVD. Additionally, Finneran et al.18) reported a similar positive association between elevated Lp(a) levels and CAD risk in primary prevention participants with or without FHx. However, the relationship between FHx and cardiovascular outcomes in patients with established CAD has been inconsistent19-21). Moreover, to the best of our knowledge, no studies have so far explored whether the prognostic value of Lp(a) in predicting CVEs is similar in patients with secondary prevention with or without FHx.
Aim
We conducted this prospective study among subjects with chronic coronary syndrome (CCS) with two aims: (i) to compare the predictive role of Lp(a) for major adverse CVEs (MACEs) in patients with or without FHx, and (ii) to investigate the independent and joint associations of elevated Lp(a) and FHx with the risk of MACEs.
Methods
Study Design and Population
This study complied with the Helsinki Declaration of 1975, as revised in 2000, and it was approved by the hospital’s ethical review board (Fuwai Hospital & National Center for Cardiovascular Diseases, Beijing, China). Each participant provided written informed consent prior to enrollment.
From July 2013 to December 2017, 7051 consecutive Chinese patients were diagnosed with CAD according to coronary angiography at the Cardiometabolic Center of Fuwai Hospital. According to the 2019 ESC guidelines22), CCS is defined by the different evolutionary phases of CAD, excluding situations in which acute coronary artery thrombosis dominates the clinical presentation, that is, acute coronary syndrome (ACS). The most frequently encountered clinical scenarios in patients with CCS included: (i) patients with established CAD and stable anginal symptoms, and/or dyspnea; (ii) individuals with new onset of left ventricular dysfunction or heart failure and established CAD; (iii) asymptomatic and symptomatic participants with stabilized symptoms <1 year after an ACS, or subjects with recent revascularization; (iv) asymptomatic and symptomatic patients >1 year after an initial diagnosis or revascularization; (v) patients with angina and suspected vasospastic or microvascular disease; and (vi) asymptomatic patients with CAD detected at screening22). Based on elevated myocardial enzyme levels, including cardiac troponin I (cTnI), creatine kinase (CK), and CK-MB, typical electrocardiogram changes, and medical history; 787 patients with ACS were excluded. Next, another 187 patients were excluded owing to missing detailed data, infectious or systematic inflammatory disease, decompensated heart failure, severe hepatic or renal insufficiency, or malignant disease, and 21 patients were lost to the follow-up. Finally, 6056 patients with CCS were eligible, of whom 1187 had FHx (Fig.1). Meanwhile, all patients were categorized according to Lp(a) quintiles (Q, Q1–4 vs. Q5) instead of specific values, as plasma Lp(a) concentrations vary by race.

Baseline information on the FHx of CAD, personal health habits, demographic factors, medical history, and medication use were collected from each patient at admission. FHx was defined as one or more first-degree relatives with documented myocardial infarction (MI), angiography-proven CAD (angiographic evidence of at least 50% occlusion of one or more coronary arteries), or sudden cardiac death. Patients with and without FHx are referred to as FHx+ and FHx −, respectively. Traditional risk factors were defined according to our previous studies:23) Hypertension was defined as self-reported hypertension, the current use of antihypertensive drugs, or systolic blood pressure (SBP) ≥ 140 mmHg and/or diastolic blood pressure (DBP) ≥ 90 mmHg recorded three or more consecutive times. Diabetes mellitus (DM) was diagnosed according to fasting blood glucose (FBG) ≥ 7.0 mmol/L or, 2-h blood glucose of the oral glucose tolerance test ≥ 11.1 mmol/L or current use of hypoglycemic drugs or insulin. Current smoking was defined as regular smoking in the previous 12 months. Baseline medication use was defined as the continuous administration of drugs for at least 3 months before admission. Medications at follow-up were ascertained as continuous medication use for at least three months before the end of follow-up.
Biochemical Analysis
Blood samples were collected from each patient after at least 12 hours of fasting in the morning. As stated in our previous studies2, 24), Lp(a) was measured using immunoturbidimetry [LASAY Lp(a) auto, SHIMA Laboratories Co., Ltd] with a normal value of <30 mg/dL. An Lp(a) protein validated standard was used to calibrate the examination, and the intra- and inter-assay coefficients of variation were below 10%. Other lipid profiles, including total cholesterol (TC), triglyceride, LDL cholesterol (LDL-C), and high-density lipoprotein cholesterol (HDL-C), were measured using an automatic biochemistry analyzer (Hitachi 7150, Tokyo, Japan) and an enzymatic assay. The FBG levels were determined using the enzymatic hexokinase method, while glycosylated hemoglobin (HbA1c) was measured using a Tosoh Automated Glycohemoglobin Analyzer (HLC-723G8, Tokyo, Japan). The concentrations of high-sensitivity C-reactive protein (hs-CRP) were determined using immunoturbidimetry (Beckmann Assay 360, Bera, California, USA).
Follow-Up
All participants were actively followed up at 6-month intervals through clinical visits and/or telephone contact until February 2020 by well-trained cardiologists or nurses. MACEs included cardiovascular death, nonfatal myocardial infarction (MI), and stroke. Cardiovascular death is mainly caused by acute MI, malignant arrhythmia, congestive heart failure, and other structural or functional cardiac diseases. Non-fatal MI was defined as positive cardiac troponins along with typical chest pain or electrocardiogram serial changes. Stroke was diagnosed based on persistent neurological dysfunction with documentation of acute cerebral infarction on computed tomography and/or magnetic resonance imaging. Three experienced cardiologists, who were blinded to the data, independently classified the events. When the diagnoses were inconsistent, they discussed the details and made a final decision.
Statistical Analysis
Continuous variables are expressed as the mean±SD or median (interquartile range) and were compared using Student’s t-test, an analysis of variance, or a nonparametric test where appropriate. Categorical variables are presented as numbers (percentages) and were analyzed by either the χ2-test or Fisher’s exact test. The cumulative event-free survival rates among the groups were estimated by a Kaplan-Meier analysis and compared using the log-rank test. Univariate and multivariate Cox regression models were used to test the independent and joint associations of elevated Lp(a) (Q5 vs. Q 1‒4) and FHx levels with MACE risk. The multivariate model was adjusted for the following covariates: age, sex, body mass index, hypertension, DM, current smoking, prior MI, number of lesion vessels, left ventricular ejection fraction, low-density lipoprotein cholesterol, triglyceride, creatinine, high-sensitivity C-reactive protein, glycosylated hemoglobin, baseline statin, and aspirin use. To understand the joint association of elevated Lp(a) and FHx with the risk of MACEs, participants were divided into four mutually exclusive groups: non-elevated Lp(a) level (Q1‒4) and FHx- (reference group), elevated Lp(a) level (Q5) and FHx-, non-elevated Lp(a) level and FHx+, and elevated Lp(a) level and FHx+. Furthermore, we calculated the change in the C-statistic to evaluate whether the addition of Lp(a) to the original model could improve the prediction of MACEs. Subgroup analyses according to age (<55 years in men and <65 years in women vs. ≥ 55 years in men and ≥ 65 years in women), sex, hypertension, and DM were performed to further examine the significance of Lp(a) in predicting the risk of MACEs. Differences were considered to be statistically significant at two-tailed p-values <0.05. Statistical analyses were performed using the SPSS version 24.0 software program (SPSS Inc., Chicago, IL, USA) and the R language version 3.5.2 software program (Feather Spray).
Results
Clinical and Biochemical Characteristics
The characteristics of the participants with (n=1187) or without (n=4869) are detailed in Table 1. The mean age of the entire population was 57.4±10.7 years, and 72.1% were men. Participants with FHx were slightly younger than those without. In addition, patients with FHx were more likely to have revascularization histories, were more frequently taking β-blockers at baseline and follow-up and taking angiotensin-converting enzyme inhibitors or angiotensin receptor blockers at follow-up, and had higher levels of TC, LDL-C, and TG than those without FHx. Notably, the plasma Lp(a) levels and other traditional risk factors, including hypertension, DM, and current smoking, were not significantly different between the participants with and without FHx.
Table 1.Characteristics of the study participants as stratified by FHx of coronary artery disease
| Variable |
Overall (n = 6056)
|
FHx+ (n = 1187)
|
FHx- (n = 4869)
|
p value
|
| Age, years |
57.4±10.7 |
54.9±9.8 |
57.7±10.8 |
<0.001 |
| Men, n (%)
|
4367 (72.1) |
866 (73.0) |
3501 (71.9) |
0.445 |
| Hypertension, n (%)
|
3754 (62.0) |
740 (62.3) |
3014 (61.9) |
0.789 |
| DM, n (%)
|
1689 (27.9) |
326 (27.5) |
1363 (28.0) |
0.704 |
| Current smokers, n (%)
|
2568 (42.4) |
523 (44.1) |
2045 (42.0) |
0.171 |
| Prior MI, n (%)
|
1800 (29.7) |
334 (28.1) |
1466 (30.1) |
0.157 |
| Prior revascularization, n (%)
|
1725 (28.5) |
352 (29.7) |
1373 (28.2) |
0.004 |
| Number of lesion vessels |
|
|
|
0.278 |
| Single-vessel disease |
1800 (29.7) |
330 (27.8) |
1470 (30.2) |
|
| Double-vessel disease |
1935 (32.0) |
387 (32.6) |
1548 (31.8) |
|
| Multi-vessel disease |
2320 (38.3) |
470 (39.6) |
1850 (38.0) |
|
| BMI, kg/m2
|
25.86±3.18 |
26.03±3.25 |
25.84±3.17 |
0.063 |
| SBP, mmHg |
127±17 |
126±17 |
127±17 |
0.301 |
| DBP, mmHg |
78±11 |
78±11 |
78±11 |
0.388 |
| LVEF, % |
63.43±8.10 |
63.70±7.99 |
63.35±8.12 |
0.165 |
| Biochemical parameters |
|
|
|
|
| FBG, mmol/L |
5.86±1.78 |
5.84±1.76 |
5.87±1.78 |
0.602 |
| HbA1c, % |
6.32±1.11 |
6.31±1.14 |
6.33±1.11 |
0.679 |
| TC, mmol/L |
4.14±1.19 |
4.27±1.22 |
4.12±1.18 |
<0.001 |
| HDL-C, mmol/L |
1.05±0.29 |
1.05±0.29 |
1.06±0.29 |
0.279 |
| LDL-C, mmol/L |
2.51±1.03 |
2.61±1.06 |
2.50±1.03 |
<0.001 |
| TG, mmol/L |
1.49 (1.10-2.09) |
1.56 (1.14-2.23) |
1.48 (1.09-2.06) |
0.002 |
| Lp(a), mg/dL |
15.14 (6.79-36.33) |
16.00 (7.00-38.26) |
15.05 (6.75-35.86) |
0.088 |
| Creatinine, umol/L |
78.01±18.44 |
77.32±17.47 |
78.01±18.60 |
0.231 |
| Hs-CRP, mg/L |
1.37 (0.75-2.86) |
1.45 (0.77-2.96) |
1.37 (0.75-2.84) |
0.452 |
| Baseline medications |
|
|
|
|
| Aspirin, n (%)
|
4328 (71.5) |
852 (71.8) |
3476 (71.4) |
0.811 |
| Statins, n (%)
|
4640 (76.6) |
925 (77.9) |
3715 (76.3) |
0.274 |
| ACEI/ARB, n (%)
|
1298 (21.4) |
237 (20.0) |
1061 (21.8) |
0.209 |
| β-blockers, n (%)
|
2553 (42.2) |
537 (45.2) |
2016 (41.4) |
0.030 |
| CCB, n (%)
|
1200 (19.8) |
226 (19.0) |
974 (20.0) |
0.510 |
| Follow-up medications |
|
|
|
|
| Aspirin, n (%)
|
5851 (96.6) |
1157 (97.5) |
4694 (96.4) |
0.072 |
| Statins, n (%)
|
5703 (94.2) |
1121 (94.4) |
4582 (94.1) |
0.568 |
| ACEI/ARB, n (%)
|
2889 (47.7) |
586 (49.4) |
2303 (47.3) |
0.008 |
| β-blockers, n (%)
|
4728 (78.1) |
959 (80.8) |
3769 (77.4) |
0.009 |
| CCB, n (%)
|
2305 (38.1) |
465 (39.2) |
1840 (37.8) |
0.376 |
Continuous values were summarized as mean±SD or median (interquartile range), and categorical variables were summarized as percentages. ACEI, angiotensin-converting enzyme inhibitor; ARB, angiotensin receptor blocker; BMI, body mass index; CCB, calcium channel blocker; DM, diabetes mellitus; DBP, diastolic blood pressure; FHx, family history; FBG, fasting blood glucose; HbA1c, glycosylated hemoglobin; HDL-C, high-density lipoprotein cholesterol; Hs-CRP, high-sensitivity C-reactive protein; LVEF, left ventricular ejection fraction; LDL-C, low-density lipoprotein cholesterol; Lp(a), lipoprotein(a); MI, myocardial infarction; SBP, systolic blood pressure; TC, total cholesterol; TG, triglyceride.
Meanwhile, as shown in Supplemental Table 1, there was a descending trend with regard to the prevalence of hypertension and current smoking and the levels of body mass index, FBG, and triglyceride across the Lp(a) quintiles. In contrast, the proportion of patients with previous MI, multivessel disease, baseline aspirin, statin, and β-blocker use, and the levels of TC, HDL-C, LDL-C, and hs-CRP gradually increased from Q1 to Q5 of Lp(a). There were no significant differences in the follow-up medications across the Lp(a) quintiles.
Supplemental Table 1.Characteristics of patients according to Lp(a) quintiles
| Variable |
Lp(a) concentrations |
p value
|
| Quintile 1 (n = 1208)
|
Quintile 2 (n = 1212)
|
Quintile 3 (n = 1215)
|
Quintile 4 (n = 1210)
|
Quintile 5 (n = 1211)
|
| Age, years |
57.0±10.6 |
57.1±11.0 |
57.5±10.7 |
57.2±10.8 |
58.0±10.4 |
0.043 |
| Man, n (%)
|
937 (77.6) |
898 (74.1) |
848 (69.8) |
874 (72.2) |
810 (66.9) |
<0.001 |
| Hypertension, n (%)
|
779 (64.5) |
772 (63.7) |
753 (62.0) |
724 (59.8) |
726 (60.0) |
0.007 |
| DM, n (%)
|
355 (29.4) |
335 (27.6) |
349 (28.7) |
338 (27.9) |
312 (25.8) |
0.137 |
| Current smokers, n (%)
|
552 (45.7) |
511 (42.2) |
514 (42.3) |
512 (42.3) |
479 (39.6) |
0.007 |
| Prior MI, n (%)
|
323 (26.7) |
337 (27.8) |
368 (30.3) |
362 (29.9) |
410 (33.9) |
<0.001 |
| Prior revascularization, n (%)
|
342 (28.3) |
320 (26.4) |
340 (28.0) |
351 (29.0) |
372 (30.7) |
0.077 |
| Number of lesion vessels, n (%)
|
|
|
|
|
|
<0.001 |
| Single-vessel disease |
412 (34.1) |
376 (31.0) |
366 (30.1) |
343 (28.3) |
303 (25.0) |
|
| Double-vessel disease |
391 (32.4) |
378 (31.2) |
392 (32.3) |
388 (32.1) |
385 (31.8) |
|
| Multi-vessel disease |
406 (33.6) |
458 (37.8) |
455 (37.4) |
479 (39.6) |
522 (43.1) |
|
| FHx of CAD, n (%)
|
232 (19.2) |
228 (18.8) |
238 (19.6) |
232 (19.2) |
257 (21.2) |
0.579 |
| BMI, kg/m2
|
26.12±3.17 |
25.98±3.05 |
25.85±3.36 |
25.81±3.27 |
25.56±3.03 |
<0.001 |
| SBP, mmHg |
126±17 |
127±18 |
127±17 |
127±17 |
126±17 |
0.028 |
| DBP, mmHg |
78±11 |
78±11 |
78±11 |
78±11 |
77±10 |
<0.001 |
| LVEF, % |
63.46±7.88 |
63.23±8.44 |
63.31±8.31 |
63.56±7.88 |
63.42±8.02 |
0.792 |
| Biochemical parameters |
|
|
|
|
|
|
| FBG, mmol/L |
5.99±1.89 |
5.90±1.88 |
5.85±1.71 |
5.81±1.73 |
5.78±1.67 |
0.004 |
| HbA1c, % |
6.31±1.08 |
6.32±1.14 |
6.36±1.10 |
6.35±1.16 |
6.30±1.08 |
0.439 |
| TC, mmol/L |
3.96±1.13 |
4.04±1.17 |
4.11±1.11 |
4.24±1.21 |
4.36±1.28 |
<0.001 |
| HDL-C, mmol/L |
1.03±0.29 |
1.04±0.28 |
1.06±0.29 |
1.06±0.29 |
1.09±0.29 |
<0.001 |
| LDL-C, mmol/L |
2.29±0.89 |
2.41±1.00 |
2.50±0.94 |
2.62±1.07 |
2.74±1.17 |
<0.001 |
| TG, mmol/L |
1.59 (1.14-2.31) |
1.54 (1.14-2.13) |
1.48 (1.07-2.05) |
1.45 (1.06-2.03) |
1.43 (1.08-1.93) |
<0.001 |
| Lp(a), mmol/L |
3.60 (2.49-4.60) |
7.98 (6.78-9.30) |
15.13 (12.93-17.83) |
29.71 (24.75-36.35) |
70.53 (54.37-90.15) |
<0.001 |
| Creatinine, umol/L |
78.36±16.69 |
78.16±18.37 |
77.64±17.45 |
77.89±20.94 |
77.53±18.54 |
0.664 |
| Hs-CRP, mg/L |
1.23 (0.70-2.46) |
1.32 (0.73-2.70) |
1.47 (0.77-3.22) |
1.43 (0.77-2.98) |
1.45 (0.80-3.04) |
<0.001 |
| Baseline medications |
|
|
|
|
|
|
| Aspirin, n (%)
|
849 (70.3) |
839 (69.2) |
866 (71.3) |
859 (71.0) |
915 (75.6) |
0.002 |
| Statins, n (%)
|
900 (74.5) |
918 (75.7) |
910 (74.9) |
929 (76.8) |
983 (81.2) |
<0.001 |
| ACEI/ARB, n (%)
|
251 (20.8) |
259 (21.4) |
270 (22.2) |
263 (21.7) |
255 (21.1) |
0.896 |
| β-blockers, n (%)
|
481 (39.8) |
478 (39.4) |
515 (42.4) |
521 (43.1) |
558 (46.1) |
0.002 |
| CCB, n (%)
|
246 (20.4) |
233 (19.2) |
245 (20.2) |
244 (20.2) |
232 (19.2) |
0.892 |
| Follow-up medications |
|
|
|
|
|
|
| Aspirin, n (%)
|
1169 (96.8) |
1166 (96.2) |
1174 (96.6) |
1174 (97.0) |
1168 (96.4) |
0.720 |
| Statins, n (%)
|
1138 (94.2) |
1134 (93.6) |
1138 (93.7) |
1150 (95.0) |
1143 (94.4) |
0.460 |
| ACEI/ARB, n (%)
|
572 (47.4) |
585 (48.3) |
592 (48.7) |
564 (46.6) |
576 (47.6) |
0.709 |
| β-blockers, n (%)
|
939 (77.7) |
939 (77.5) |
938 (77.2) |
938 (77.5) |
974 (80.4) |
0.127 |
| CCB, n (%)
|
475 (39.3) |
465 (38.4) |
481 (39.6) |
445 (36.8) |
439 (36.3) |
0.174 |
Continuous values are summarized as mean±SD or median (interquartile range) and categorical variables are summarized as percentage. ACEI, angiotensin converting enzyme inhibitors; ARB, angiotensin receptor blockers; BMI, body mass index; CCB, calcium channel blockers; DM, Diabetes mellitus; DBP, diastolic blood pressure; FHx, family history; FBG, fasting blood glucose; HbA1c, glycosylated hemoglobin; HDL-C, high-density lipoprotein cholesterol; Hs-CRP, high-sensitivity C-reactive protein; LVEF, left ventricular ejection fraction; LDL-C, low-density lipoprotein cholesterol; Lp(a), lipoprotein(a); MI, myocardial infarction; SBP, systolic blood pressure; TC, total cholesterol; TG, triglyceride.
Over an average of 50.35±18.58 months of follow-up, a total of 378 CVEs were recorded, including 150 cardiovascular deaths, 76 non-fatal MIs and 152 strokes. As shown in Supplemental Table 2, the event group had significantly higher Lp(a) levels than did the non-event group (20.10 vs. 14.95 mg/dL, p<0.001). Meanwhile, patients in the event group were slightly older; more likely to have hypertension, DM, MI histories, and multi-vessel diseases; and had higher levels of SBP, HbA1c, creatinine, and hs-CRP than those in the non-event group. In addition, compared with the event-free group, the event group had significantly lower DBP and left ventricular ejection fractions, was less likely to use aspirin and statins at baseline, and was more likely to take statins and angiotensin-converting enzyme inhibitors/angiotensin receptor blockers at follow-up. However, there was no significant difference in the proportion of patients with positive FHx results between the two groups.
Supplemental Table 2.Characteristics of patients with and without MACEs
| Variable |
MACEs (n = 378)
|
Without MACEs (n = 5678)
|
p value
|
| Age, years |
62.0±10.3 |
57.1±10.7 |
<0.001 |
| Man, n (%)
|
269 (71.1) |
4098 (72.2) |
0.672 |
| Hypertension, n (%)
|
263 (69.7) |
3491 (61.5) |
0.002 |
| DM, n (%)
|
136 (35.9) |
1553 (27.4) |
<0.001 |
| Current smokers, n (%)
|
146 (38.6) |
2422 (42.7) |
0.125 |
| Prior MI, n (%)
|
153 (40.6) |
1647 (29.0) |
<0.001 |
| Prior revascularization, n (%)
|
124 (32.8) |
1601 (28.2) |
0.055 |
| Number of lesion vessels, n (%)
|
|
|
<0.001 |
| Single-vessel disease |
83 (22.0) |
1717 (30.2) |
|
| Double-vessel disease |
92 (24.3) |
1843 (32.5) |
|
| Multi-vessel disease |
202 (53.4) |
2118 (37.3) |
|
| FHx of CAD, n (%)
|
67 (17.7) |
1120 (19.7) |
0.343 |
| BMI, kg/m2
|
25.59±3.23 |
25.88±3.18 |
0.077 |
| SBP, mmHg |
129±18 |
127±17 |
0.025 |
| DBP, mmHg |
76±11 |
78±11 |
0.016 |
| LVEF, % |
60.12±10.95 |
63.56±7.90 |
<0.001 |
| Biochemical parameters |
|
|
|
| FBG, mmol/L |
5.99±1.96 |
5.86±1.77 |
0.178 |
| HbA1c, % |
6.62±1.26 |
6.31±1.10 |
<0.001 |
| TC, mmol/L |
4.18±1.28 |
4.14±1.19 |
0.564 |
| HDL-C, mmol/L |
1.05±0.29 |
1.05±0.29 |
0.852 |
| LDL-C, mmol/L |
2.51±1.11 |
2.51±1.03 |
0.909 |
| TG, mmol/L |
1.50 (1.06-2.11) |
1.49 (1.10-2.09) |
0.770 |
| Lp(a), mg/dL |
20.10 (9.07-43.83) |
14.95 (6.69-35.90) |
<0.001 |
| Creatinine, umol/L |
80.78±19.39 |
77.77±18.39 |
0.002 |
| Hs-CRP, mg/L |
1.70 (0.91-3.72) |
1.36 (0.74-2.82) |
<0.001 |
| Baseline medications |
|
|
|
| Aspirin, n (%)
|
253 (66.9) |
4075 (71.8) |
0.044 |
| Statins, n (%)
|
258 (68.3) |
4382 (77.2) |
<0.001 |
| ACEI/ARB, n (%)
|
68 (17.9) |
1230 (21.7) |
0.092 |
| β-blockers, n (%)
|
156 (41.2) |
2397 (42.2) |
0.718 |
| CCB, n (%)
|
64 (17.0) |
1136 (20.0) |
0.146 |
| Follow-up medications |
|
|
|
| Aspirin, n (%)
|
361 (95.5) |
5490 (96.7) |
0.217 |
| Statins, n (%)
|
360 (95.3) |
5235 (92.2) |
0.031 |
| ACEI/ARB, n (%)
|
213 (56.4) |
2675 (47.1) |
<0.001 |
| β-blockers, n (%)
|
302 (79.8) |
4426 (77.9) |
0.376 |
| CCB, n (%)
|
147 (38.8) |
2158 (38.0) |
0.732 |
Continuous values are summarized as mean±SD or median (interquartile range) and categorical variables are summarized as percentage. ACEI, angiotensin converting enzyme inhibitors; ARB, angiotensin receptor blockers; BMI, body mass index; CCB, calcium channel blockers; DM, Diabetes mellitus; DBP, diastolic blood pressure; FHx, family history; FBG, fasting blood glucose; HbA1c, glycosylated hemoglobin; HDL-C, high-density lipoprotein cholesterol; Hs-CRP, high-sensitivity C-reactive protein; LVEF, left ventricular ejection fraction; LDL-C, low-density lipoprotein cholesterol; Lp(a), lipoprotein(a); MI, myocardial infarction; SBP, systolic blood pressure; TC, total cholesterol; TG, triglyceride.
As shown in Fig.2A and 2B, the Kaplan‒Meier analyses showed that subjects with elevated Lp(a) levels (Q5) had significantly lower cumulative event-free survival rates than those with non-elevated Lp(a) levels (Q1–4), regardless of whether they had FHx (p<0.05). After adjustment for potential covariates, an association between high Lp(a) levels and MACEs was observed. Compared with Q1–4 of Lp(a) levels, the hazard ratio for MACE risk associated with Q5 of Lp(a) for those with positive FHx was 2.77 (95% CI: 1.38–5.54; p=0.004) versus 1.35 (95% CI: 1.02–1.77; p=0.036; Fig.3) for those without positive FHx. A 1-SD increase in Lp(a) was associated with a 59% increase in the risk of MACEs in patients with FHx (p=0.001) and a 15% increase in the risk in those without FHx (p=0.014). Furthermore, the association between elevated Lp(a) levels and the risk of MACE was not modified by FHx (p for interaction =0.138). Finally, we assessed whether the addition of the plasma Lp(a) levels to established cardiovascular risk factors could improve risk stratification for MACEs in CCS patients with or without FHx under secondary prevention therapy in the real world. As shown in Table 2, adding Lp(a) to traditional risk factors significantly improved the risk prediction for MACEs in subjects with FHx (C-index increased from 0.778 to 0.826, p=0.004), but only a nominal improvement was observed in patients without FHx (C-index increased from 0.692 to 0.696, p=0.391).


Table 2.C-statistic of Lp(a) for predicting MACEs in patients with or without FHx of CAD
|
C-statistic (95% CI) |
ΔC-statistic (95% CI) |
p value
|
| FHx- |
|
|
|
| Original model |
0.692 (0.660-0.725) |
– |
– |
| Original model + Lp(a) |
0.696 (0.664-0.729) |
0.004 (-0.003-0.013) |
0.391 |
| FHx+ |
|
|
|
| Original model |
0.778 (0.705-0.851) |
– |
– |
| Original model + Lp(a) |
0.826 (0.767-0.884) |
0.048 (0.036-0.102) |
0.004 |
The original model included age, sex, body mass index, hypertension, diabetes, current smoking, prior myocardial infarction, number of lesion vessels, left ventricular ejection fraction, low-density lipoprotein cholesterol, triglyceride, creatinine, high-sensitivity C-reactive protein, glycosylated hemoglobin, and baseline statin and aspirin use. CAD, coronary artery disease; FHx, family history; Lp(a), lipoprotein(a); MACE, major adverse cardiovascular event.
In addition, subgroup analyses according to sex, hypertension, and DM showed that the Q5 of Lp(a) was consistently associated with a higher risk of MACEs, and this association was more significant in men, hypertensive, and non-DM patients. A stratification analysis by age suggested that the prognostic significance of elevated Lp(a) levels for MACEs risk mainly existed in older patients (≥ 55 years in men and ≥ 65 years in women) (Supplemental Table 3).
Supplemental Table 3.Subgroup analyses of the association between Lp(a) and MACEs among patients with CCS
| Variables |
Subgroup |
Lp(a) levels |
Unadjusted |
Adjusted*
|
| HR (95% CI) |
p value
|
HR (95% CI) |
p value
|
| Age |
<55 years in men and <65 years in women |
Lp(a) Q1-Q4 |
1.00 (Reference) |
|
1.00 (Reference) |
|
|
|
Lp(a) Q5 |
0.94 (0.59-1.47) |
0.772 |
0.89 (0.53-1.49) |
0.652 |
|
≥ 55 years in men and ≥ 65 years in women |
Lp(a) Q1-Q4 |
1.00 (Reference) |
|
1.00 (Reference) |
|
|
|
Lp(a) Q5 |
1.66 (1.27-2.16) |
<0.001 |
1.63 (1.21-2.19) |
0.001 |
| Sex |
Man |
Lp(a) Q1-Q4 |
1.00 (Reference) |
|
1.00 (Reference) |
|
|
|
Lp(a) Q5 |
1.55 (1.19-2.02) |
0.001 |
1.53 (1.14-2.06) |
0.005 |
|
Woman |
Lp(a) Q1-Q4 |
1.00 (Reference) |
|
1.00 (Reference) |
|
|
|
Lp(a) Q5 |
1.15 (0.74-1.79) |
0.540 |
1.25 (0.78-2.01) |
0.356 |
| Hypertension |
Yes |
Lp(a) Q1-Q4 |
1.00 (Reference) |
|
1.00 (Reference) |
|
|
|
Lp(a) Q5 |
1.45 (1.11-1.90) |
0.007 |
1.43 (1.07-1.93) |
0.017 |
|
No |
Lp(a) Q1-Q4 |
1.00 (Reference) |
|
1.00 (Reference) |
|
|
|
Lp(a) Q5 |
1.42 (0.93-2.14) |
0.102 |
1.35 (0.84-2.17) |
0.217 |
| DM |
Yes |
Lp(a) Q1-Q4 |
1.00 (Reference) |
|
1.00 (Reference) |
|
|
|
Lp(a) Q5 |
1.33 (0.90-1.95) |
0.152 |
1.27 (0.82-1.97) |
0.282 |
|
No |
Lp(a) Q1-Q4 |
1.00 (Reference) |
|
1.00 (Reference) |
|
|
|
Lp(a) Q5 |
1.56 (1.18-2.06) |
0.002 |
1.66 (1.22-2.25) |
0.001 |
*Adjusted for age, sex, body mass index, hypertension, diabetes, current smoking, prior myocardial infarction, number of lesion vessels, left ventricular ejection fraction, lipoprotein(a), low-density lipoprotein cholesterol, triglyceride, creatinine, high-sensitivity C-reactive protein, glycosylated hemoglobin, and baseline statin and aspirin use. CCS, chronic coronary syndrome; DM, diabetes mellitus; CI, confidence interval; HR, hazard ratio; Lp(a), lipoprotein(a); MACEs, major adverse cardiovascular events.
A Kaplan-Meier analysis showed that there was no significant difference in the cumulative event-free survival rates between patients with and without FHx (p>0.05; Supplemental Fig.1). After adjusting for potential covariates, the risk of MACEs in CCS patients with FHx was still not different from that in patients without FHx (HR, 0.90; 95% CI: 0.64–1.26; p=0.542; Supplemental Table 4).

Supplemental Table 4.Univariate and multivariate Cox proportional hazard model analysis of MACEs according to FHx
|
Unadjusted |
Adjusted*
|
| HR (95% CI) |
p value
|
HR (95% CI) |
p value
|
| Non-FHx |
1.00 (Reference) |
– |
1.00 (Reference) |
– |
| FHx |
0.84 (0.62-1.13) |
0.244 |
0.90 (0.64-1.26) |
0.542 |
*Adjusted for age, sex, body mass index, hypertension, diabetes, current smoking, prior myocardial infarction, number of lesion vessels, left ventricular ejection fraction, lipoprotein(a), low-density lipoprotein cholesterol, triglyceride, creatinine, high-sensitivity C-reactive protein, glycosylated hemoglobin, and baseline statin and aspirin use. CI, confidence interval; FHx, family history; HR, hazard ratio; MACEs, major adverse cardiovascular events.
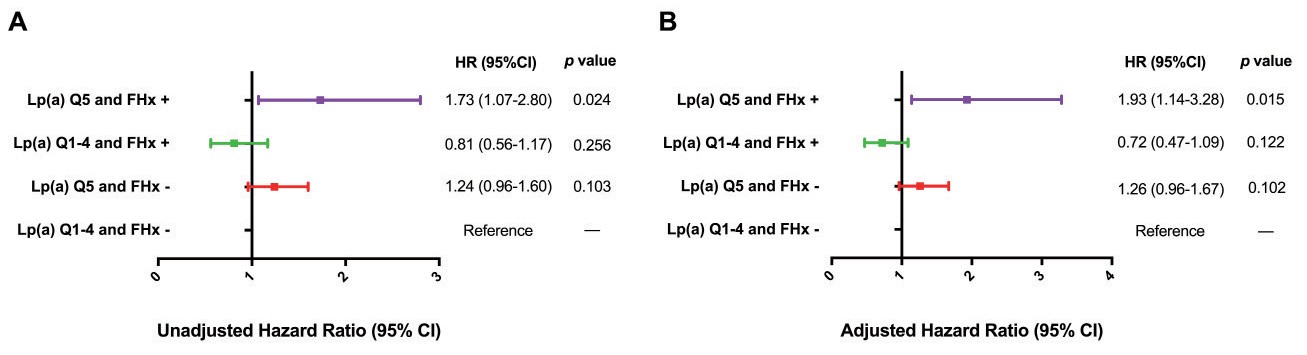
To examine the joint association of Lp (a) and FHx with the risk of MACEs, all participants were divided according to elevated or non-elevated Lp(a) levels and the presence or absence of FHx. The cumulative event-free survival curves across the 4 groups are shown in Fig.2C. In comparison to the subjects with neither elevated Lp(a) nor positive FHx, patients with elevated Lp(a) alone had a significantly increased risk of MACE, while those with both elevated Lp(a) and positive FHx were at the highest risk of MACE. However, we observed no significant difference in the MACE risk between the Lp(a) Q1–4 and FHx+ groups and the reference group [Lp(a) Q1–4 and FHx- groups]. In multivariable-adjusted Cox models, patients in the Lp(a) Q5 and FHx+ groups had a 93% increased risk for MACE compared with the reference group (p=0.015; Fig.4).
Discussion
In this prospective study of patients with CCS, our findings suggest, for the first time, that elevated Lp(a) levels were significantly associated with the risk of MACEs in patients with CCS, irrespective of the presence or absence of FHx. Notably, Lp(a) showed a stronger ability to predict MACEs in patients with CCS with FHx than in those without FHx. Additionally, the addition of Lp(a) to the model of established risk factors resulted in a significant improvement in the risk prediction for MACEs in patients with FHx but not in those without FHx. Moreover, when patients were categorized according to both Lp(a) levels and FHx, compared to patients with non-elevated Lp(a) and negative FHx, the subjects with elevated Lp(a) and FHx had a significant 1.93-fold increased risk of MACE, and those with elevated Lp(a) alone had a nominally increased risk of MACEs. However, FHx was not significantly associated with the risk of MACEs in CCS patients. Our findings suggest that Lp(a) measurement may be beneficial in refining CVE risk in secondary prevention patients independent of FHx, but it appears to be more effective in those with FHx.
Elevated plasma Lp(a) levels have been shown to be associated with an increased risk of CVEs in diverse populations, ranging from the general population to patients with established CAD3, 5-13, 25-27). However, the relationship between Lp(a) and CVEs requires further research to clarify its potential role as a marker of cardiovascular risk and a target for therapy, especially in high-risk individuals based on guidelines and clinical practice. To date, the association between Lp(a) and cardiovascular outcomes in some special populations, including postmenopausal women, DM, familial hypercholesterolemia, premature CAD, and ACS, has already been explored in previous studies including ours5, 28-30). Moreover, according to the 2016 European Society of Cardiology and European Atherosclerosis Society (ESC/EAS) and 2016 Canadian Cardiovascular Society guidelines, the measurement of Lp(a) is recommended in patients with an FHx who are at high risk for incident CVD31, 32). Nevertheless, limited data exist regarding the difference in the association between Lp(a) and CVD risk in subjects with or without FHx. Recently, a study by Mehta et al.14) reported that elevated plasma Lp(a) levels and FHx in CAD had an independent and additive joint association with the risk of CVD and CAD among participants who were free of prevalent CVD. Their findings suggest that the presence of both elevated Lp(a) and FHx can help to better stratify asymptomatic subjects and it may also be valuable for guiding primary prevention. Another recent study by Finneran et al.18) showed that among 343,728 individuals without established CAD, the HR for incident CAD risk associated with high Lp(a) levels for those with an FHx was 2.00 (95% CI: 1.46–2.74) versus 1.68 (95% CI: 1.55–1.82) for those without an FHx compared with participants with low Lp(a) levels. Therefore, elevated Lp(a) was associated with an increased risk of incident CAD in the absence of FHx, with effects similar to those observed in the presence of FHx. Two existing studies focused on the impact of FHx on the association between Lp(a) and cardiovascular risk in primary prevention populations. Therefore, our study extends the known relationship between the Lp(a) levels and CVE risk to secondary prevention in patients with or without FHx. Interestingly, we observed that Lp(a) was independently associated with the risk of MACEs in patients with CCS in the presence or absence of FHx, and that Lp(a) showed a stronger ability to predict MACE risk in patients with FHx. Our results suggest that Lp(a) measurement may be more useful for risk stratification in secondary prevention patients with FHx of CAD.
As is well known, individuals with a FHx of CAD appear to be at a significantly increased risk for events related to CAD. Thus, they constitute a potential target population for early aggressive primary-prevention strategies. The relative risk for CAD in first-degree relatives of affected patients is reported to be 2–12 times that in the general population21). Thus, FHx has been considered an important risk modifier in current cardiovascular risk prediction models. For instance, the Framingham Offspring Study showed that FHx doubles the risk of developing adverse cardiovascular events15), and the Reynolds Risk Score could reclassify 20% to 30% of individuals from intermediate to high risk owing to the presence of FHx in CAD33). However, the prognostic significance of positive FHx in patients with established CAD remains controversial. Some studies have suggested that it is related to worse outcomes19), while other studies have shown that it is insignificant or even protective20, 21, 34, 35). In the present study, no significant differences were observed in the proportion of patients with a positive FHx of CAD between the event and nonevent groups. Furthermore, the univariate and multivariate Cox regression models showed a negative association between FHx and MACE risk. In the future, studies on CCS patients with a larger sample size and longer follow-up time may be needed to further evaluate the predictive role of FHx in this patient population.
Circulating Lp(a) concentrations are primarily determined by genetics, while FHx reflects the inherited and shared environmental predisposition to CVD14). A previous study indicated that apo(a) concentrations accounted for much of the familial predisposition to cardiac ischemia, and apo(a) and FHx are interchangeable risk factors associated with incident CAD36). Therefore, it seems that the combination of Lp(a) and FHx might supply redundant information regarding cardiovascular risk prediction in the general population. However, a study by Mehta et al. showed that the simultaneous presence of these two factors was independently associated with an increased risk of incident atherosclerotic CVD or CAD and that the prognostic value of their coexistence was higher than that observed with either risk factor alone14). Furthermore, in this study, among the four groups categorized according to the Lp(a) level and FHx of CAD, patients with both high Lp(a) levels and positive FHx were at the highest risk of MACE, suggesting that the simultaneous presence of these two factors may be superior to either one alone in refining CVEs risk in secondary prevention populations as well.
However, several limitations associated with our study should be mentioned. First, we reported findings from an observational cohort of Chinese patients, and the Lp(a) levels are known to vary with ethnicity, which may affect the generalizability of our findings. Second, the FHx data were obtained by self-reporting at enrollment, which raises the possibility of some misclassification bias. However, this tends to bias our results toward the null hypothesis. Third, only baseline Lp(a) values were measured, but the Lp(a) concentration was expected to be stable throughout life because of extremely high heritability and the current lack of drugs substantially reducing it. Fourth, the sample size and follow-up time of the present study needed to be larger and longer, respectively, to better examine the independent and joint association of Lp(a) and FHx of CAD in the long-term outcomes in patients with established CAD.
Conclusion
The present study is the first to suggest that Lp(a) could predict worse outcomes in patients with CCS with or without FHx, especially in those with FHx. Moreover, the presence of both elevated Lp(a) and FHx may better identify patients with established CAD at an increased risk of MACEs and may therefore be useful for guiding secondary prevention strategies.
Competing Interests
The authors declare that they have no competing interest.
Funding
This work was supported by the Capital Health Development Fund [201614035], CAMS Innovation Fund for Medical Sciences [2021-I2M-1-008], and National High level Hospital Clinical Research Funding [2023-GSP-RC-09; 2023-GSP-QN-8]. The funders had no role in the study design, data collection and analysis, decision to publish, or manuscript preparation.
Authors’ Contributions
H.H.L. designed the study, analyzed and interpreted the data, and drafted the original manuscript. S.L., Y.Z., Y.L.G., C.G.Z., N.Q.W., Y.G., R.X.X., and Q.D. conducted the study and collected data. J.J.L. developed the idea, designed the study, and critically revised the manuscript. All authors declare that they take responsibility for the contents of this article.
Acknowledgements
The authors thank all staff and participants of this study for their important contributions.
References
- 1) Li ZG, Li G, Zhou YL, Chen ZJ, Yang JQ, Zhang Y, Sun S and Zhong SL: Lack of association between lipoprotein(a) genetic variants and subsequent cardiovascular events in Chinese Han patients with coronary artery disease after percutaneous coronary intervention. Lipids Health Dis, 2013; 12: 127
- 2) Liu HH, Cao YX, Jin JL, Zhang HW, Hua Q, Li YF, Guo YL, Zhu CG, Wu NQ, Xu RX, Chen XH and Li JJ: Predicting Cardiovascular Outcomes by Baseline Lipoprotein(a) Concentrations: A Large Cohort and Long-Term Follow-up Study on Real-World Patients Receiving Percutaneous Coronary Intervention. J Am Heart Assoc, 2020; 9: e014581
- 3) Nicholls SJ, Tang WH, Scoffone H, Brennan DM, Hartiala J, Allayee H and Hazen SL: Lipoprotein(a) levels and long-term cardiovascular risk in the contemporary era of statin therapy. J Lipid Res, 2010; 51: 3055-3061
- 4) Schmidt K, Noureen A, Kronenberg F and Utermann G: Structure, function, and genetics of lipoprotein (a). J Lipid Res, 2016; 57: 1339-1359
- 5) Jin JL, Cao YX, Zhang HW, Sun D, Hua Q, Li YF, Guo YL, Wu NQ, Zhu CG, Gao Y, Dong QT, Liu HH, Dong Q and Li JJ: Lipoprotein(a) and Cardiovascular Outcomes in Coronary Artery Disease Patients With Prediabetes and Diabetes. Diabetes Care, 2019;
- 6) Emerging Risk Factors C, Erqou S, Kaptoge S, Perry PL, Di Angelantonio E, Thompson A, White IR, Marcovina SM, Collins R, Thompson SG and Danesh J: Lipoprotein(a) concentration and the risk of coronary heart disease, stroke, and nonvascular mortality. JAMA, 2009; 302: 412-423
- 7) Clarke R, Peden JF, Hopewell JC, Kyriakou T, Goel A, Heath SC, Parish S, Barlera S, Franzosi MG, Rust S, Bennett D, Silveira A, Malarstig A, Green FR, Lathrop M, Gigante B, Leander K, de Faire U, Seedorf U, Hamsten A, Collins R, Watkins H, Farrall M and Consortium P: Genetic variants associated with Lp(a) lipoprotein level and coronary disease. N Engl J Med, 2009; 361: 2518-2528
- 8) Consortium CAD, Deloukas P, Kanoni S, Willenborg C, Farrall M, Assimes TL, Thompson JR, Ingelsson E, Saleheen D, Erdmann J, Goldstein BA, Stirrups K, Konig IR, Cazier JB, Johansson A, Hall AS, Lee JY, Willer CJ, Chambers JC, Esko T, Folkersen L, Goel A, Grundberg E, Havulinna AS, Ho WK, Hopewell JC, Eriksson N, Kleber ME, Kristiansson K, Lundmark P, Lyytikainen LP, Rafelt S, Shungin D, Strawbridge RJ, Thorleifsson G, Tikkanen E, Van Zuydam N, Voight BF, Waite LL, Zhang W, Ziegler A, Absher D, Altshuler D, Balmforth AJ, Barroso I, Braund PS, Burgdorf C, Claudi-Boehm S, Cox D, Dimitriou M, Do R, Consortium D, Consortium C, Doney AS, El Mokhtari N, Eriksson P, Fischer K, Fontanillas P, Franco-Cereceda A, Gigante B, Groop L, Gustafsson S, Hager J, Hallmans G, Han BG, Hunt SE, Kang HM, Illig T, Kessler T, Knowles JW, Kolovou G, Kuusisto J, Langenberg C, Langford C, Leander K, Lokki ML, Lundmark A, McCarthy MI, Meisinger C, Melander O, Mihailov E, Maouche S, Morris AD, Muller-Nurasyid M, Mu TC, Nikus K, Peden JF, Rayner NW, Rasheed A, Rosinger S, Rubin D, Rumpf MP, Schafer A, Sivananthan M, Song C, Stewart AF, Tan ST, Thorgeirsson G, van der Schoot CE, Wagner PJ, Wellcome Trust Case Control C, Wells GA, Wild PS, Yang TP, Amouyel P, Arveiler D, Basart H, Boehnke M, Boerwinkle E, Brambilla P, Cambien F, Cupples AL, de Faire U, Dehghan A, Diemert P, Epstein SE, Evans A, Ferrario MM, Ferrieres J, Gauguier D, Go AS, Goodall AH, Gudnason V, Hazen SL, Holm H, Iribarren C, Jang Y, Kahonen M, Kee F, Kim HS, Klopp N, Koenig W, Kratzer W, Kuulasmaa K, Laakso M, Laaksonen R, Lee JY, Lind L, Ouwehand WH, Parish S, Park JE, Pedersen NL, Peters A, Quertermous T, Rader DJ, Salomaa V, Schadt E, Shah SH, Sinisalo J, Stark K, Stefansson K, Tregouet DA, Virtamo J, Wallentin L, Wareham N, Zimmermann ME, Nieminen MS, Hengstenberg C, Sandhu MS, Pastinen T, Syvanen AC, Hovingh GK, Dedoussis G, Franks PW, Lehtimaki T, Metspalu A, Zalloua PA, Siegbahn A, Schreiber S, Ripatti S, Blankenberg SS, Perola M, Clarke R, Boehm BO, O’Donnell C, Reilly MP, Marz W, Collins R, Kathiresan S, Hamsten A, Kooner JS, Thorsteinsdottir U, Danesh J, Palmer CN, Roberts R, Watkins H, Schunkert H and Samani NJ: Large-scale association analysis identifies new risk loci for coronary artery disease. Nat Genet, 2013; 45: 25-33
- 9) Kamstrup PR, Tybjaerg-Hansen A and Nordestgaard BG: Extreme lipoprotein(a) levels and improved cardiovascular risk prediction. J Am Coll Cardiol, 2013; 61: 1146-1156
- 10) Nestel PJ, Barnes EH, Tonkin AM, Simes J, Fournier M, White HD, Colquhoun DM, Blankenberg S and Sullivan DR: Plasma lipoprotein(a) concentration predicts future coronary and cardiovascular events in patients with stable coronary heart disease. Arterioscler Thromb Vasc Biol, 2013; 33: 2902-2908
- 11) Suwa S, Ogita M, Miyauchi K, Sonoda T, Konishi H, Tsuboi S, Wada H, Naito R, Dohi T, Kasai T, Okazaki S, Isoda K and Daida H: Impact of Lipoprotein (a) on Long-Term Outcomes in Patients with Coronary Artery Disease Treated with Statin After a First Percutaneous Coronary Intervention. J Atheroscler Thromb, 2017; 24: 1125-1131
- 12) Tsimikas S: A Test in Context: Lipoprotein(a): Diagnosis, Prognosis, Controversies, and Emerging Therapies. J Am Coll Cardiol, 2017; 69: 692-711
- 13) O’Donoghue ML, Morrow DA, Tsimikas S, Sloan S, Ren AF, Hoffman EB, Desai NR, Solomon SD, Domanski M, Arai K, Chiuve SE, Cannon CP, Sacks FM and Sabatine MS: Lipoprotein(a) for risk assessment in patients with established coronary artery disease. J Am Coll Cardiol, 2014; 63: 520-527
- 14) Mehta A, Virani SS, Ayers CR, Sun W, Hoogeveen RC, Rohatgi A, Berry JD, Joshi PH, Ballantyne CM and Khera A: Lipoprotein(a) and Family History Predict Cardiovascular Disease Risk. J Am Coll Cardiol, 2020; 76: 781-793
- 15) Lloyd-Jones DM, Nam BH, D’Agostino RB, Sr., Levy D, Murabito JM, Wang TJ, Wilson PW and O’Donnell CJ: Parental cardiovascular disease as a risk factor for cardiovascular disease in middle-aged adults: a prospective study of parents and offspring. JAMA, 2004; 291: 2204-2211
- 16) Mach F, Baigent C, Catapano AL, Koskinas KC, Casula M, Badimon L, Chapman MJ, De Backer GG, Delgado V, Ference BA, Graham IM, Halliday A, Landmesser U, Mihaylova B, Pedersen TR, Riccardi G, Richter DJ, Sabatine MS, Taskinen MR, Tokgozoglu L, Wiklund O and Group ESCSD: 2019 ESC/EAS Guidelines for the management of dyslipidaemias: lipid modification to reduce cardiovascular risk. Eur Heart J, 2020; 41: 111-188
- 17) Jacobson TA, Maki KC, Orringer CE, Jones PH, Kris-Etherton P, Sikand G, La Forge R, Daniels SR, Wilson DP, Morris PB, Wild RA, Grundy SM, Daviglus M, Ferdinand KC, Vijayaraghavan K, Deedwania PC, Aberg JA, Liao KP, McKenney JM, Ross JL, Braun LT, Ito MK, Bays HE, Brown WV, Underberg JA and Panel NLAE: National Lipid Association Recommendations for Patient-Centered Management of Dyslipidemia: Part 2. J Clin Lipidol, 2015; 9: S1-122 e121
- 18) Finneran P, Pampana A, Khetarpal SA, Trinder M, Patel AP, Paruchuri K, Aragam K, Peloso GM and Natarajan P: Lipoprotein(a) and Coronary Artery Disease Risk Without a Family History of Heart Disease. J Am Heart Assoc, 2021; 10: e017470
- 19) Kim C, Chang HJ, Cho I, Sung JM, Choi D, Jeong MH, Jang YS and Korea Acute Myocardial Infarction Registry I: Impact of family history on the presentation and clinical outcomes of coronary heart disease: data from the Korea Acute Myocardial Infarction Registry. Korean J Intern Med, 2013; 28: 547-556
- 20) Agarwal MA, Garg L, Lavie CJ, Reed GL and Khouzam RN: Impact of family history of coronary artery disease on in-hospital clinical outcomes in ST-segment myocardial infarction. Ann Transl Med, 2018; 6: 3
- 21) Abdi-Ali A, Shaheen A, Southern D, Zhang M, Knudtson M, White J, Graham M, James MT and Wilton SB: Relation Between Family History of Premature Coronary Artery Disease and the Risk of Death in Patients With Coronary Artery Disease. Am J Cardiol, 2016; 117: 353-358
- 22) Knuuti J, Wijns W, Saraste A, Capodanno D, Barbato E, Funck-Brentano C, Prescott E, Storey RF, Deaton C, Cuisset T, Agewall S, Dickstein K, Edvardsen T, Escaned J, Gersh BJ, Svitil P, Gilard M, Hasdai D, Hatala R, Mahfoud F, Masip J, Muneretto C, Valgimigli M, Achenbach S, Bax JJ and Group ESCSD: 2019 ESC Guidelines for the diagnosis and management of chronic coronary syndromes. Eur Heart J, 2020; 41: 407-477
- 23) Liu HH, Cao YX, Jin JL, Zhang HW, Hua Q, Li YF, Guo YL, Zhu CG, Wu NQ, Gao Y, Xu RX, Hong LF and Li JJ: Association of lipoprotein(a) levels with recurrent events in patients with coronary artery disease. Heart, 2020; 106: 1228-1235
- 24) Liu HH, Cao YX, Jin JL, Zhang HW, Hua Q, Li YF, Guo YL, Zhu CG, Wu NQ, Gao Y, Xu RX, Hong LF and Li JJ: Association of lipoprotein(a) levels with recurrent events in patients with coronary artery disease. Heart, 2020;
- 25) Bennet A, Di Angelantonio E, Erqou S, Eiriksdottir G, Sigurdsson G, Woodward M, Rumley A, Lowe GD, Danesh J and Gudnason V: Lipoprotein(a) levels and risk of future coronary heart disease: large-scale prospective data. Arch Intern Med, 2008; 168: 598-608
- 26) Kamstrup PR, Tybjaerg-Hansen A, Steffensen R and Nordestgaard BG: Genetically elevated lipoprotein(a) and increased risk of myocardial infarction. JAMA, 2009; 301: 2331-2339
- 27) O’Donoghue ML, Fazio S, Giugliano RP, Stroes ESG, Kanevsky E, Gouni-Berthold I, Im K, Lira Pineda A, Wasserman SM, Ceska R, Ezhov MV, Jukema JW, Jensen HK, Tokgozoglu SL, Mach F, Huber K, Sever PS, Keech AC, Pedersen TR and Sabatine MS: Lipoprotein(a), PCSK9 Inhibition, and Cardiovascular Risk. Circulation, 2019; 139: 1483-1492
- 28) Suk Danik J, Rifai N, Buring JE and Ridker PM: Lipoprotein(a), hormone replacement therapy, and risk of future cardiovascular events. J Am Coll Cardiol, 2008; 52: 124-131
- 29) Gragnano F, Fimiani F, Di Maio M, Cesaro A, Limongelli G, Cattano D and Calabro P: Impact of lipoprotein(a) levels on recurrent cardiovascular events in patients with premature coronary artery disease. Intern Emerg Med, 2019; 14: 621-625
- 30) Li S, Wu NQ, Zhu CG, Zhang Y, Guo YL, Gao Y, Li XL, Qing P, Cui CJ, Xu RX, Sun J, Liu G, Dong Q and Li JJ: Significance of lipoprotein(a) levels in familial hypercholesterolemia and coronary artery disease. Atherosclerosis, 2017; 260: 67-74
- 31) Catapano AL, Graham I, De Backer G, Wiklund O, Chapman MJ, Drexel H, Hoes AW, Jennings CS, Landmesser U, Pedersen TR, Reiner Z, Riccardi G, Taskinen MR, Tokgozoglu L, Verschuren WMM, Vlachopoulos C, Wood DA, Zamorano JL, Cooney MT and Group ESCSD: 2016 ESC/EAS Guidelines for the Management of Dyslipidaemias. Eur Heart J, 2016; 37: 2999-3058
- 32) Anderson TJ, Gregoire J, Pearson GJ, Barry AR, Couture P, Dawes M, Francis GA, Genest J, Jr., Grover S, Gupta M, Hegele RA, Lau DC, Leiter LA, Lonn E, Mancini GB, McPherson R, Ngui D, Poirier P, Sievenpiper JL, Stone JA, Thanassoulis G and Ward R: 2016 Canadian Cardiovascular Society Guidelines for the Management of Dyslipidemia for the Prevention of Cardiovascular Disease in the Adult. Can J Cardiol, 2016; 32: 1263-1282
- 33) Ridker PM, Buring JE, Rifai N and Cook NR: Development and validation of improved algorithms for the assessment of global cardiovascular risk in women: the Reynolds Risk Score. JAMA, 2007; 297: 611-619
- 34) Ertelt K, Genereux P, Mintz GS, Brener SJ, Kirtane AJ, McAndrew TC, Francese DP, Ben-Yehuda O, Mehran R and Stone GW: Clinical profile and impact of family history of premature coronary artery disease on clinical outcomes of patients undergoing primary percutaneous coronary intervention for ST-elevation myocardial infarction: analysis from the HORIZONS-AMI Trial. Cardiovasc Revasc Med, 2014; 15: 375-380
- 35) Preisler Y, Ziv-Baran T, Chorin E, Margolis G, Khoury S and Shacham Y: Family history of coronary artery disease and adverse clinical outcomes in patients suffering from acute ST-segment elevation myocardial infarction. Coron Artery Dis, 2018; 29: 657-662
- 36) Durrington PN, Ishola M, Hunt L, Arrol S and Bhatnagar D: Apolipoproteins (a), AI, and B and parental history in men with early onset ischaemic heart disease. Lancet, 1988; 1: 1070-1073