Abstract
Aims: We report that small dense low-density lipoprotein cholesterol (sdLDL-C) levels are sensitive biomarkers of metabolic dysfunction-associated steatotic liver disease (MASLD). Since triglyceride (TG)-rich very low-density lipoprotein (VLDL) is a precursor of sdLDL and is overproduced by MASLD, the composition of VLDL may be more directly associated with MAFLD than sdLDL-C or plasma TG. To identify TG-rich VLDL, this author proposed “Excess TG” and examined its association with MASLD.
Methods: Patients with type 2 diabetes (n=1295), excluding fasting hypertriglyceridemia (TG ≥ 400 mg/dL) and heavy drinkers were examined. Liver steatosis and visceral fat area (VFA) were evaluated using CT. VLDL-C was calculated as the total C minus direct LDL-C minus HDL-C. The average VLDL-TG level can be estimated using VLDL-C×5, according to the principle of the Friedewald equation for LDL-C. Thus, VLDL-TG was estimated as VLDL-C×5, and Excess TG was calculated as plasma TG minus VLDL-C×5.
Results: Patients with MASLD were younger, more likely to be men and drinkers, and had higher VFA, TG, sdLDL-C, and excess TG, while VLDL-C was comparable. Excess TG was found to be the most sensitive lipid parameter for identifying MASLD, independent of sdLDL-C, TG, TG/VLDL-C, and VFA. The odds ratios for MASLD were 2.4-, 3.7-, and 3.9-fold higher for Excess TG ranges of 0–24, 25–49, and ≥ 50 mg/dL, respectively, relative to <0 mg, and a close relationship remained significant after adjustment for lipid- and adiposity-related parameters.
Conclusions: Excess TG in VLDL was strongly associated with MASLD beyond TG and sdLDL-C levels, which may reflect the presence of TG-rich VLDL.
Introduction
Metabolic dysfunction-associated fatty liver disease (MAFLD), formerly known as non-alcoholic fatty liver disease (NAFLD), affects approximately a quarter of the adult population worldwide and poses a health and economic burden in all countries1). Since MAFLD includes type 2 diabetes and obesity irrespective of alcohol consumption2), the prevalence of MAFLD has dramatically increased in proportion to the increased population with type 2 diabetes and obesity worldwide1, 2). MAFLD is a risk factor for steatohepatitis, liver cancer, and cardiovascular disease (CVD)3, 4). Hypertriglyceridemia is strongly associated with obesity, type 2 diabetes, and liver steatosis. The atherogenicity of hypertriglyceridemia is mainly explained by increased triglyceride (TG)-rich lipoprotein remnants5), a high prevalence of small dense low-density lipoprotein (sdLDL) particles6), and low levels of high-density lipoprotein (HDL)-cholesterol (C). Among them, the sdLDL-C concentration was the strongest predictor of CVD events7). We recently reported that sdLDL-C levels are markedly elevated in MAFLD8), which may explain the high prevalence of CVD in NAFLD/MAFLD3, 4). Furthermore, the close association between MAFLD and sdLDL-C is independent of TG and obesity8). However, the mechanism by which sdLDL-C is specifically elevated in MAFLD—beyond TG—is not fully understood.
Increased hepatic lipogenesis due to de novo or exogenous fatty acid flux is a common pathophysiological mechanism that promotes large and TG-rich VLDL (VLDL1) production and liver steatosis9-11), which leads to the development of hypertriglyceridemia and sdLDL generation12). Therefore, a close association between liver steatosis and sdLDL-C may be dependent on the overproduction of VLDL1 particles10, 11). Previous studies have shown that large VLDL particles (VLDL1) play a central role in dyslipidemia associated with metabolic syndrome13) and type 2 diabetes14). It has also been shown that insulin resistance underlies the overproduction of VLDL1 15). Adiels et al.16) reported that VLDL1 particles are predominantly produced in men with an increased liver fat content. Recently, it has been recognized that TG-rich VLDL1 is formed by the fusion of TG-poor VLDL2 with lipid droplets and that transmembrane 6 superfamily member 2 (TM6SF2) plays an important role in VLDL lipidation and the development of liver steatosis17). Despite the importance of VLDL1 as a central etiologic factor in dyslipidemia in metabolic diseases, including MAFLD, the measurement of VLDL1 requires a specialized ultracentrifuge to separate lipoproteins at a Svedberg flotation rate (Sf) of 60–400 18, 19); therefore, VLDL1 measurement is not widespread in general clinical practice.
LDL-C is usually calculated using the Friedewald formula (Total-C minus HDL-C minus TG/5)20). In this formula, VLDL-C was estimated to be 20% of VLDL-TG. The Friedewald formula is not applicable to severe hypertriglyceridemia (TG level >400 mg/dL). This is because the TG/C ratio in the particles differs greatly between chylomicrons and VLDL; thus, TG-rich lipoprotein-C cannot be calculated using TG/5. It is worth noting that LDL-C is underestimated at higher TG levels, even when fasting TG levels are <400 mg/dL21). This is because VLDL-C (TG/5) is overestimated in TG-rich VLDL, which has a higher TG/C ratio than average VLDL22). The average VLDL-TG level can be estimated using the VLDL-C×5 20). Therefore, TG (actual VLDL-TG) minus VLDL-C×5 (calculated VLDL-TG) may indicate TG excess due to an increase in VLDL containing more TG than the average VLDL.
Recently, the nomenclature of NAFLD/MAFLD was changed to metabolic dysfunction associated steatotic liver disease (MASLD), because the terms “nonalcoholic” and “fatty” were felt to be stigmatizing and steatotic liver disease was chosen as an overarching term to encompass the various etiologies of steatosis23). In this study, the term MASLD was employed instead of MAFLD. The aim of this study was to investigate the characteristics and clinical significance of the estimate of Excess TG in VLDL, and whether this estimate is superior to TG and sdLDL-C in identifying MASLD.
Methods
Patients
The patients were participants in the “ViNA” cohort study. The ViNA cohort study began on October 1, 2019, and included regular tests, assessment of diabetic complications, and prognostic surveys24). Data collected up to September 30, 2023 were used in this study. The exclusion criteria were current treatment for malignancy, severe liver, endocrine, and respiratory disorders, and patients undergoing hemodialysis. Patients with active viral hepatitis, cirrhosis, or liver cancer were excluded. “Non-drinkers” were defined as individuals who had never consumed alcohol or who had stopped drinking at least 1 year prior to enrollment, while “current drinkers” were defined as individuals who drank even small amounts of alcohol and included non-regular drinkers but excluded heavy drinkers. From the questionnaire, it was difficult to determine whether the patients had MAFLD with substandard alcohol intake or MetALD with above-standard alcohol intake23). Therefore, some patients with MetALDs were included in the present study. Liver steatosis was diagnosed based on the radiologist’s overall judgment, including absolute absorbance values of the liver and spleen, absorbance ratios of the liver and spleen, and the absence of intrahepatic bile ducts on computed tomography (CT) images. Patients with chronic liver injury were excluded based on the radiologist’s comments.
Patients receiving TG-lowering agents such as fibrates and omega 3-fatty acids were excluded. As the effect of statins and ezetimibe on TG-rich lipoprotein metabolism is limited, users of these drugs were included. All patients (n=1295) had type 2 diabetes and had been receiving treatment for diabetes at Ebina General Hospital for at least 3 years. All patients were taught an appropriate diet and limited alcohol consumption by a dietitian, as proposed by the Japan Diabetes Foundation.
Measurements
Plasma samples were collected in the morning following overnight fasting. LDL-C and HDL-C levels were measured directly in the plasma. The sdLDL-C and LDL-TG concentrations were measured using a homogeneous method (Denka Co. Tokyo)25, 26). Non-HDL-C was calculated by subtracting HDL-C from total cholesterol. VLDL-C was calculated as TC minus directly measured LDL-C and HDL-C levels. Estimated VLDL-TG was calculated as VLDL-C multiplied by 5, according to the principle of Friedewald’s formula20, 22). Excess TG was defined as plasma TG minus the estimated VLDL-TG (VLDL-C×5). Visceral fat area (VFA) and subcutaneous fat area (SFA) were measured using a fat scanning program for CT scans (Fujifilm, Tokyo). Apolipoproteins (apo) B, CIII, and E, high-sensitivity (hs)-CRP, and C-peptide were measured using commercially available kits.
The study was explained in detail to all participants who consented to participate, and a written informed consent form was obtained from all participants prior to the study. This study was approved by the Ethics Committee of Ebina General Hospital (no. 115, 2019). The study was conducted in accordance with the principles of the Declaration of Helsinki and current legal regulations.
Statistical Analyses
All continuous variables are expressed as the mean±standard deviation (SD) or median (interquartile range (IQR)). Differences between groups were examined using Student’s t-test or the Mann-Whitney U test. Significance was evaluated using the Wilcoxon signed-rank test for continuous variables and the chi-square test for categorical variables. For non-normally distributed variables, logarithmic transformation (Ln) was performed before the analyses of difference or regression. The relationships between the presence of MASLD and continuous variables were evaluated using a univariate logistic regression analysis and expressed as chi-square values. A receiver operating characteristic (ROC) curve analysis was performed to determine the cutoff value of excess TG for the prevalence of MASLD. A multivariate logistic regression analysis was employed to analyze the independent relationship between excess TG or excess TG ranges (1, 2, 3, and 4) and the presence of MASLD after adjusting for various confounding factors associated with MASLD. The results were expressed as chi-square values or odds ratios and 95% confidence intervals (CI). The p trend was estimated using the Cochran-Armitage trend test for categorical variables or the Jonckheere-Terpstra trend test for continuous variables. All analyses were performed using JMP (version 15, SAS Institute, Cary, NC, USA).
Results
Table 1 lists clinical characteristics and measurements in patients with type 2 diabetes stratified by drinking and MASLD status. Approximately one-third of the patients were complicated by MASLD. Twenty-two percent of the patients were insulin users, and all patients were treated with one or more of the following hypoglycemic agents: sulfonylurea (SU) (25%), metformin (46%), pioglitazone (5%), dipeptidase peptidase (DPP)-4 inhibitors (62%), sodium-glucose cotransporter (SGLT)2 inhibitors (26%), and glucagon-like peptide-1 receptor agonists (GLP-1RA) (3%). Fifty-six percent of the patients used statins and 5% used ezetimibe. Relative to non-drinkers, drinkers were younger, were more frequently male, and were more frequently smokers. The drinkers had a smaller VFA and SFA, and increased diastolic blood pressure (DBP) and γGTP, while their AST and ALT levels were comparable to non-drinkers. There were no significant differences in plasma lipids between drinkers and non-drinkers, with the exception of sdLDL-C and lipoprotein (Lp) (a). In comparison to the non-MASLD group, the patients in the MASLD group were younger, were more frequently male, and were more frequently smokers. The MASLD group had higher BMI, VFA, SFA, ALT, γGTP, and hs-CRP values. Systolic blood pressure (SBP) was similar but DBP was higher in the MASLD group. HbA1c, C-peptide, and estimated glomerular filtration rate (eGFR) were higher in the MASLD group. The MASLD group had higher TG, sdLDL-C, non-HDL-C, and apo B and CIII levels than the non-MASLD group, while the LDL-C, LDL-TG, VLDL-C, and apoE levels of the 2 groups were similar. Excess TG and TG/VLDL-C were significantly increased in the MASLD group relative to the non-MASLD group. More patients in the MASLD group used metformin, SGLT-2 inhibitors, and GLP-1RA, and fewer patients used insulin. The numbers of statin and ezetimibe users in the 2 groups were comparable.
Table 1.Clinical characteristics and measurements in patients with type 2 diabetes stratified by sex, drinking and MASLD status
|
Total subjects |
Women |
Men |
p
|
Non-drinker |
Current drinker |
p
|
Non-MASLD |
MASLD |
p
|
| Number |
1295 |
491 |
804 |
|
759 |
536 |
|
845 |
450 |
|
| Men |
62% |
0% |
100% |
|
45% |
54% |
<0.0001 |
59% |
66% |
<0.001 |
| MASLD |
34% |
30% |
37% |
<0.05 |
32% |
38% |
<0.05 |
0% |
100% |
|
| Current drinker |
41% |
20% |
54% |
<0.0001 |
0% |
100% |
|
39% |
45% |
<0.05 |
| Current smoker |
20% |
7% |
28% |
<0.0001 |
14% |
29% |
<0.0001 |
19% |
22% |
0.15 |
| CAD history |
10% |
6% |
13% |
<0.0001 |
11% |
10% |
0.42 |
11% |
8% |
0.16 |
| Stroke history |
7% |
6% |
7% |
0.45 |
7% |
7% |
0.7 |
8% |
7% |
0.32 |
| Diabetic retinopathy |
26% |
30% |
24% |
<0.05 |
23% |
29% |
<0.02 |
25% |
38% |
<0.0001 |
| Age y |
66 (11) |
67 (11) |
65 (11) |
0.12 |
67 (11) |
64 (11) |
<0.0001 |
68 (10) |
62 (11) |
<0.0001 |
| BMI kg/m2
|
25.1 (4.2) |
25.4 (4.7) |
24.9 (3.9) |
0.05 |
25.2 (4.2) |
24.9 (4.3) |
0.36 |
24.0 (3.8) |
27.1 (4.3) |
<0.0001 |
| VFA cm2
|
151 (77) |
136 (67) |
157 (79) |
<0.0001 |
165 (82) |
144 (82) |
<0.0001 |
126 (67) |
192 (72) |
<0.0001 |
| SFA cm2
|
166 (81) |
186 (85) |
138 (75) |
<0.0001 |
165 (82) |
144 (82) |
<0.0001 |
137 (70) |
192 (91) |
<0.0001 |
| SBP mmHg |
131 (14) |
133 (15) |
130 (14) |
0.05 |
131 (15) |
131 (14) |
0.72 |
131 (14) |
132 (14) |
0.18 |
| DBP mmHg |
77 (11) |
75 (11) |
78 (11) |
<0.0001 |
76 (11) |
79 (11) |
<0.0001 |
75 (11) |
80 (12) |
<0.0001 |
| HbA1c % |
7.3 (0.8) |
7.3 (0.8) |
7.3 (0.8) |
0.27 |
7.3 (0.8) |
7.2 (0.8) |
0.08 |
7.2 (0.8) |
7.4 (0.8) |
<0.001 |
| Glucose mg/dL |
149 (39) |
145 (37) |
151 (41) |
<0.01 |
148 (39) |
149 (40) |
0.66 |
148 (42) |
149 (35) |
0.8 |
| C-Peptide ng/mL |
1.3 [0.8-2.0] |
1.2 [0.7-1.8] |
1.3 [0.8-2.1] |
<0.005 |
1.3 [0.8-1.9] |
1.3 [0.8-2.0] |
0.2 |
1.0 [0.7-1.7] |
1.6 [1.2-2.3] |
<0.0001 |
| hs-CRP mg/L |
0.054 [0.025-0.128] |
0.063 [0.026-0.145] |
0.051 [0.024-0.116] |
0.14 |
0.048 [0.024-0.122] |
0.051 [0.024-0.116] |
0.37 |
0.042 [0.002-0.092] |
0.084 [0.004-0.0198] |
<0.0001 |
| eGFR |
71 (19) |
73 (21) |
70 (19) |
<0.02 |
70 (20) |
72 (18) |
0.22 |
67 (20) |
74 (20) |
<0.0001 |
| AST IU |
22 [18-27] |
21 [18-26] |
22 [18-27] |
0.33 |
22 [18-26] |
22 [18-27] |
0.3 |
21 [18-25] |
24 [20-31] |
<0.0001 |
| ALT IU |
20 [15-29] |
18 [14-25] |
21 [16-31] |
<0.01 |
20 [15-28] |
21 [15-30] |
0.35 |
18 [14-24] |
27 [20-43] |
<0.0001 |
| γGTP IU |
24 [17-39] |
20 [14-30] |
27 [18-43] |
<0.0001 |
21 [16-33] |
28 [18-47] |
<0.0001 |
20 [15-31] |
33 [22-52] |
<0.0001 |
| TG mg/dL |
104 [74-148] |
100 [72-138] |
107 [76-156] |
<0.002 |
103 [77-145] |
106 [72-151] |
0.7 |
95 [67-129] |
125 [90-173] |
<0.0001 |
| Total-C mg/dL |
181 (30) |
186 (32) |
177 (29) |
<0.0001 |
180 (31) |
181 (29) |
0.55 |
181 (31) |
180 (29) |
0.36 |
| LDL-C mg/dL |
102 (24) |
102 (25) |
101 (23) |
0.34 |
102 (23) |
102 (24) |
0.88 |
100 (24) |
104 (24) |
<0.05 |
| HDL-C mg/dL |
55 (14) |
59 (14) |
52 (13) |
<0.0001 |
54 (13) |
55 (15) |
0.22 |
57 (15) |
51 (12) |
<0.0001 |
| NonHDL-C mg/dL |
126 (27) |
127 (29) |
125 (26) |
0.16 |
126 (26) |
126 (28) |
0.95 |
124 (27) |
128 (26) |
<0.02 |
| VLDL-C mg/dL |
23 [18-29] |
23 [ [18-29] |
22 [ [17-29] |
0.18 |
23 [18-29] |
23 [18-29] |
0.8 |
23 [18-29] |
23 [17-32] |
0.24 |
| Excess TG mg/dL |
0 (9.6) |
-12 (49) |
4 (46) |
<0.0001 |
-3 (49) |
-1 (46) |
0.44 |
-12 (47) |
16 (45) |
<0.0001 |
| TG/VLDL-C |
4.8 [3.5-6.1] |
4.5 [3.3-5.8] |
5.0 [3.8-6.4] |
<0.0001 |
4.9 [3.6-6.1] |
4.8 [3.5-6.1] |
0.8 |
4.3 [3.3-5.7] |
5.6 [4.5-7] |
<0.0001 |
| sdLDL-C mg/dL |
27 [21-7] |
26 [20-35] |
28 [21-39] |
<0.0001 |
26 [20-35] |
30 [21-42] |
<0.0001 |
25 [19-33] |
32 [22-44] |
<0.0001 |
| LDL-TG mg/dL |
14 [12-17] |
15 [13-18] |
13 [11-16] |
<0.0001 |
14 [11-17] |
14 [12-17] |
0.93 |
14 [11-17] |
14 [12-17] |
0.17 |
| ApoB mg/dL |
86 (18) |
87 (18) |
86 (17) |
0.43 |
86 (17) |
87 (18) |
0.26 |
85 (18) |
89 (18) |
<0.0001 |
| ApoCIII mg/dL |
10.2 [8.3-12.7] |
10.4 [8.7-12.6] |
10.2 [8.1-12.8] |
0.56 |
10.0 [8.2-12.1] |
10.6 [8.6-13.5] |
0.06 |
9.8 [8.1-11.9] |
10.9 [8.8-13.8] |
<0.0001 |
| ApoE mg/dL |
3.9 [3.2-4.7] |
4.2 [3.5-5] |
3.7 [3.1-4.4] |
<0.0001 |
3.9 [3.3-4.7] |
3.8 [3.1-4.6] |
0.07 |
4.1 (1.1) |
4 [3.2-4.8] |
0.19 |
| Lipoprotein (a) mg/dL |
13.6 [6.4-20] |
15.2 [7.1-30] |
12.1 [5.9-23.4] |
<0.001 |
14.4 [6.7-29] |
11.9 [6.0-22.9] |
<0.01 |
14.7 [7-27] |
10.8 [5.4-21.9] |
<0.0001 |
| Statins |
56% |
66% |
50% |
<0.0001 |
61% |
50% |
<0.0001 |
55% |
59% |
0.17 |
| Ezetimibe |
5% |
6% |
4% |
0.17 |
5% |
6% |
0.31 |
5% |
6% |
0.49 |
| Sulfonylurea |
25% |
24% |
25% |
0.69 |
26% |
23% |
0.27 |
25% |
24% |
0.53 |
| SGLT2 inhibitors |
26% |
27% |
23% |
0.09 |
25% |
24% |
0.47 |
19% |
35% |
<0.0001 |
| Metformin |
46% |
49% |
44% |
0.08 |
46% |
46% |
0.88 |
39% |
59% |
<0.0001 |
| GLP-1RA |
3% |
6% |
2% |
<0.0005 |
4% |
4% |
0.86 |
2% |
5% |
<0.001 |
| DPP-4 inhibitors |
62% |
60% |
64% |
0.18 |
64% |
60% |
0.11 |
62% |
62% |
0.95 |
| Pioglitazone |
5% |
4% |
7% |
0.18 |
5% |
5% |
0.16 |
5% |
4% |
0.6 |
| Insulin |
22% |
26% |
19% |
<0.005 |
25% |
17% |
<0.002 |
24% |
16% |
<0.002 |
Excess TG = TG minus 5 x VLDL-C (Total-C minus LDL-C minusHDL-C)
All continuous variables were expressed as mean±standard deviation (SD) or median (interquartile range (IQR))
Table 2 lists the selected parameters that showed significant differences between the MASLD and non-MASLD groups and their association with the presence of MASLD, as determined by a logistic regression analysis. BMI, SFA, VFA, Ln[γGTP], Ln[ALT], Excess TG and Ln[TG/VLDL-C] were strongly associated with the presence of MASLD (chi-square value ≥ 100); age, DBP, Ln[AST], Ln[TG], Ln[sdLDL-C], Ln[hs-CRP], and Ln[C-peptide] showed moderate associations with MASLD (chi-square value >50). Excess TG showed the strongest association with MASLD among the lipid parameters. Since a strong confounding association was found between Excess TG and TG/VLDL-C, a multivariate logistic regression analysis was performed to identify independent explanatory variables for MASLD. TG/VLDL-C lost its independent association with MASLD when Excess TG was entered into the analysis. Therefore, Excess TG but not TG/VLDL-C was used for the subsequent multivariate analysis. Excess TG was independently associated with MASLD on sdLDL-C and TG. This association of Excess TG with MASLD remained unchanged after adjustment for age, sex, and drinking status, even when BMI and VFA were included in the variables.
Table 2.Rogistic regression analysis for MASLD
| Univariate |
χ2
|
R2
|
p
|
Multivariate |
χ2
|
p
|
R2
|
| Male |
5 |
0.003 |
<0.05 |
Excess TG |
12 |
<0.0005 |
|
| Current Drinker |
4 |
0.003 |
<0.05 |
Ln[TG/VLDL-C] |
1 |
0.8 |
|
| Age |
85 |
0.051 |
<0.0001 |
|
|
|
0.0586 |
| BMI |
164 |
0.098 |
<0.0001 |
Excess TG |
49 |
<0.0001 |
|
| VFA |
216 |
0.14 |
<0.0001 |
Ln[sdLDL-C] |
23 |
<0.0001 |
|
| SFA |
123 |
0.079 |
<0.0001 |
Ln[TG] |
0 |
0.6 |
|
| DBP |
59 |
0.035 |
<0.0001 |
|
|
|
0.0719 |
| HbA1c |
10 |
0.006 |
<0.002 |
Excess TG |
27 |
<0.0001 |
|
| Ln[C-Peptide] |
90 |
0.054 |
<0.0001 |
Ln[sdLDL-C] |
13 |
0.0005 |
|
| Ln[hs-CRP] |
87 |
0.052 |
<0.0001 |
Ln[TG] |
2 |
0.13 |
|
| eGFR |
29 |
0.017 |
<0.0001 |
Age |
48 |
<0.0001 |
|
| Ln[AST] |
74 |
0.002 |
<0.0001 |
Sex |
0 |
0.97 |
|
| Ln[ALT] |
232 |
0.138 |
<0.0001 |
Drinker |
0 |
0.57 |
|
| Ln[γGTP] |
100 |
0.06 |
<0.0001 |
|
|
|
0.107 |
| Ln[TG] |
91 |
0.055 |
<0.0001 |
Excess TG |
13 |
<0.0005 |
|
| Excess TG |
116 |
0.067 |
<0.0001 |
Ln[sdLDL-C] |
11 |
<0.001 |
|
| Ln[TG/VLDL-C] |
102 |
0.061 |
<0.0001 |
Ln[TG] |
0 |
0.99 |
|
| LDL-C |
6 |
0.038 |
<0.02 |
Age |
32 |
<0.0001 |
|
| HDL-C |
50 |
0.03 |
<0.0001 |
Sex |
0 |
0.22 |
|
| NonHDL-C |
6 |
0.003 |
<0.05 |
Drinker |
0 |
0.25 |
|
| Ln[sdLDL-C] |
75 |
0.045 |
<0.0001 |
BMI |
0 |
0.54 |
|
| ApoB |
17 |
0.01 |
<0.0001 |
VFA |
64 |
<0.0001 |
|
| Ln[ApoCIII] |
25 |
0.015 |
<0.0001 |
|
|
|
0.203 |
| Ln[Lp(a)] |
17 |
0.01 |
<0.0001 |
|
|
|
|
Fig.1 depicts the distribution of Excess TG values in 1295 patients with type 2 diabetes and ROC curves for the determination of cutoff values of Excess TG for predicting MASLD. The mean value of Excess TG in the overall cohort was -3mg/dL, and 75th and 90th percentiles of excess TG were 25 and 55 mg/dL, respectively. The ROC curve demonstrated an intimate association between Excess TG and MASLD, with an area under the curve (AUC) of 0.68, p<0.0001. The cutoff value of Excess TG in the ROC curve for the most sensitive and selective identification of MASLD was 0 mg/dL. Based on these results, Excess TG was classified into four ranges: range 1=<0 mg/dL, range 2=0–24 mg/dL; range 3=25–49 mg/dL; and range 4 ≥ 50 mg/dL.

Since the patients in this study included current drinkers, the relationship between Excess TG and MASLD may change depending on whether the patients were drinking. To minimize the effect of alcohol consumption, an ROC curve analysis was used to examine the effect of Excess TG on MASLD in non-drinkers and current drinkers. As shown in Supplemental Fig.1, there was no significant difference in the ROC curves of the 2 groups, and the results were almost the same as those in the overall analysis.

Table 3 shows the clinical characteristics and measurements stratified by the Excess TG range. The prevalence of MASLD increased with the Excess TG range: range 1, 21%; range 2, 43%; range 3, 52%; and range 4, 58%. Younger age, male sex, higher BMI, VFA, SFA, DBP, HbA1c, glucose, and C-peptide levels were associated with a higher Excess TG range. Similarly, the liver markers AST, ALT, and γ-GTP were increased with higher Excess TG ranges; TG, sdLDL-C, apo B, non-HDL-C, and apo CIII were significantly increased with higher Excess TG ranges, while HDL-C was negatively correlated with the Excess TG range. The use of metformin, DPP-4 inhibitors, and SGLT2 inhibitors increased with a higher Excess TG range.
Table 3.Clinical characteristics and measurements stratified by Excess TG ranges
| Excess TG (mg/dL) |
Range1 <0 |
Range 2 0-24 |
Range 3 25-49 |
Range 4 50< |
p-trend |
| Excess TG (mg/dL) |
-36 (32) |
12 (6) |
35 (7) |
79 (31) |
|
| n |
684 |
272 |
174 |
152 |
|
| Men |
57% |
65% |
66% |
73% |
<0.0005 |
| Age years |
68 (10) |
64 (10) |
64 (11) |
60 (13) |
<0.0001 |
| MASLD |
21% |
43% |
52% |
58% |
<0.0001 |
| Current drinker |
39% |
43% |
41% |
45% |
0.6100 |
| Current smoker |
16% |
27% |
20% |
16% |
0.1600 |
| Retinopathy |
28% |
29% |
21% |
22% |
0.1500 |
| BMI kg/m2
|
24.0 (3.8) |
25.8 (3.7) |
26.7 (5.1) |
26.8 (4.4) |
<0.0001 |
| VFA cm2
|
135 (78) |
152 (73) |
161 (72) |
191 (75) |
<0.0001 |
| SFA cm2
|
157 (79) |
165 (76) |
173 (83) |
194 (93) |
<0.0001 |
| SBP mmHg |
131 (14) |
131 (14) |
130 (13) |
132 (15) |
0.7500 |
| DBP mmHg |
76 (11) |
78 (11) |
77 (11) |
81 (12) |
<0.0005 |
| HbA1c % |
7.2 (0.8) |
7.4 (0.8) |
7.4 (10.8) |
7.5 (0.9) |
<0.0001 |
| Glucose mg/dL |
144 (35) |
151 (43) |
149 (41) |
167 (44) |
<0.0001 |
| C-Peptide ng/mL |
1.2 (0.9) |
1.8 (1.3) |
1.9 (1.1) |
2.9 (2.1) |
<0.0001 |
| hs-CRP mg/L |
0.014 (0.069) |
0.016 (0.03) |
0.015 (0.029) |
0.015 (0.026) |
0.9800 |
| eGFR |
70 (19) |
71 (20) |
71 (19) |
73 (20) |
0.3800 |
| AST IU |
22 (7) |
24 (10) |
26 (13) |
27 (16) |
<0.0001 |
| ALT IU |
21 (11) |
27 (18) |
28 (19) |
33 (22) |
<0.0001 |
| γGTP IU |
31 (37) |
38 (38) |
39 (38) |
53 (81) |
<0.0001 |
| TG mg/dL |
91 (45) |
124 (51) |
142 (52) |
203 (72) |
<0.0001 |
| TG/VLDL-C |
3.6 (0.9) |
5.6 (0.4) |
7.2 (1.7) |
9.0 (2.9) |
<0.0001 |
| Total-C mg/dL |
164 (26) |
184 (27) |
193 (28) |
214 (28) |
<0.0001 |
| LDL-C mg/dL |
101 (23) |
103 (26) |
103 (23) |
102 (24) |
0.4600 |
| sdLDL-C mg/dL |
27 (12) |
31 (13) |
33 (13) |
39 (16) |
<0.0001 |
| HDL-C mg/dL |
60 (15) |
50 (10) |
50 (11) |
46 (11) |
<0.0001 |
| NonHDL-C mg/dL |
108 (20) |
130 (21) |
142 (20) |
165 (25) |
<0.0001 |
| ApoB mg/dL |
84 (17) |
88 (19) |
87 (16) |
90 (18) |
<0.001 |
| ApoCIII mg/dL |
10.2 (3.1) |
10.6 (3.4) |
11.3 (3.5) |
12.8 (4.2) |
<0.0001 |
| ApoE mg/dL |
4.0 (1.2) |
3.8 (1.1) |
3.9 (0.9) |
4.1 (1.0) |
0.1000 |
| Lp (a) mg/dL |
21 (21) |
21 (25) |
19 (24) |
19 (23) |
0.7500 |
| Statins |
53% |
67% |
52% |
52% |
0.7600 |
| Ezetimibe |
4% |
7% |
5% |
6% |
0.3700 |
| Sulfonylurea |
27% |
27% |
21% |
31% |
0.4900 |
| SGLT2 inhibitors |
19% |
27% |
30% |
40% |
<0.0001 |
| Metformin |
38% |
50% |
62% |
54% |
<0.0001 |
| GLP-1RA |
2% |
4% |
5% |
5% |
0.0500 |
| DPP-4 inhibitors |
59% |
61% |
68% |
73% |
<0.005 |
| Pioglitazone |
5% |
5% |
5% |
5% |
0.9000 |
| Insulin |
23% |
22% |
18% |
19% |
0.4300 |
Excess TG = TG minus 5 x VLDL-C (Total-C minus LDL-C minus HDL-C)
All continuous variables were expressed as mean±standard deviation (SD)
Table 4 shows the odds ratios and 95% CIs obtained in the multivariate logistic regression analysis for the presence of MASLD with Excess TG ranges 1, 2, 3, and 4 as explanatory variables. The odds ratios (adjusted for age, sex, and drinking status) for Excess TG ranges of 2, 3, and 4 and MASLD were 2.31, 3.17, and 3.48, respectively, relative to an Excess TG range of 1. Model 1 consisted of age, sex, alcohol consumption, presence of retinopathy, and insulin use. GLP-1 RA, SGLT2i, DPP4i, and metformin were significantly associated with the presence of MASLD (Table 1) and Excess TG range (Table 3). Adjusted for Model 1, the odds ratios for Excess TG ranges 2, 3, and 4 and MASLD were 2.31, 3.17, and 3.48, respectively. Similar odds ratio trends were observed when Ln[TG], Ln[sdLDL-C], and HDL-C were entered into Model 1, and when BMI and VFA were entered into Model 1. Model 2 included age, sex, alcohol consumption, retinopathy, insulin use, GLP-1 RA, SGLT2i, DPP4i, metformin, DBP, HbA1c, eGFR, and Ln[C-peptide]. After adjustment for Model 2, the odds ratios for Excess TG ranges 2, 3, and 4 to MASLD were 2.31, 3.17, and 3.48, respectively. However, when Ln[TG], Ln[sdLDL-C], HDL-C, BMI, and VFA were all entered into Model 2, the significant association between higher Excess TG ranges and MASLD was partly lost.
Table 4.Odds ratios and 95% confidence intervals (CI) for MASLD according to Excess TG range
|
Range 1
<0 mg/dL
|
Range 2 0-24mg/dL |
Range 3
25-49 mg/dL
|
Range 4
>50 mg/dL
|
| Odds |
95% CI |
Odds |
95% CI |
Odds |
95% CI |
Odds |
95% CI |
| Age, gender, and drinker-adjusted |
1.00 |
(Reference) |
2.43 |
1.79-3.31 |
3.72 |
2.60-5.32 |
3.91 |
2.67-5.72 |
| Model 1 |
1.00 |
(Reference) |
2.31 |
1.68-3.16 |
3.17 |
2.19-4.59 |
3.48 |
2.35-5.15 |
| Model 1 + Ln[TG] |
1.00 |
(Reference) |
1.86 |
1.33-2.59 |
2.35 |
1.59-3.48 |
1.99 |
1.25-3.17 |
| Model 1 + Ln[TG]+Ln[sdLDL-C] |
1.00 |
(Reference) |
1.95 |
1.40-2.73 |
2.47 |
1.66-3.67 |
2.20 |
1.37-3.53 |
| Model 1 + Ln[TG]+ Ln[sdLDL-C]+HDL-C |
1.00 |
(Reference) |
1.86 |
1.32-2.61 |
2.40 |
1.61-3.57 |
2.14 |
1.61-3.57 |
| Model 1 + BMI |
1.00 |
(Reference) |
1.99 |
1.44-2.76 |
2.58 |
1.76-3.79 |
2.85 |
1.90-4.28 |
| Model 1 + BMI + VFA |
1.00 |
(Reference) |
1.53 |
1.07-2.21 |
2.32 |
1.54-3.51 |
2.33 |
1.51-3.61 |
| Model 1 + BMI+VFA + Ln[TG] + Ln[sdLDL-C] + HDL-C |
1.00 |
(Reference) |
1.37 |
0.93-2.00 |
1.95 |
1.26-3.02 |
1.66 |
0.99-2.78 |
| Model 2 |
1.00 |
(Reference) |
1.95 |
1.40-2.72 |
2.64 |
1.80-3.89 |
2.30 |
1.00-3.57 |
| Model 2 + Ln[TG] |
1.00 |
(Reference) |
1.73 |
1.23-2.43 |
2.21 |
1.48-3.31 |
1.63 |
1.00-2.66 |
| Model 2 + Ln[TG] + Ln[sdLDL-C] |
1.00 |
(Reference) |
1.80 |
1.28-2.55 |
2.31 |
1.54-3.47 |
1.75 |
1.07-2.87 |
| Model 2 + Ln[TG] + Ln[sdLDL-C] + HDL-C |
1.00 |
(Reference) |
1.74 |
1.23-2.47 |
2.26 |
1.51-3.40 |
1.72 |
1.05-2.82 |
| Model 2 + BMI |
1.00 |
(Reference) |
1.84 |
1.31-2.58 |
2.36 |
1.59-3.51 |
2.17 |
1.39-3.37 |
| Model 2 + BMI + VFA |
1.00 |
(Reference) |
1.47 |
1.01-2.13 |
2.19 |
1.44-3.34 |
1.90 |
1.19-3.05 |
| Model 2 + BMI + VFA + Ln[TG] + Ln[sdLDL-C] + HDL-C |
1.00 |
(Reference) |
1.42 |
0.97-2.10 |
2.03 |
1.30-3.18 |
1.63 |
0.95-2.82 |
Model1: Adjusted for age, gender, current drinker, and retinopathy, and users of insulin. GLP-1 RA, SGLT2i, DPP4i,and metformin
Model2: Adjusted for age, gender, current drinker, and retinopathy, users of insulin. GLP-1 RA, SGLT2i, DPP4i,and metformin, and DBP, HbA1c, eGFR, and Ln [C-peptide]
Excess TG = TG minus 5 x VLDL-C (Total-C minus LDL-C minus HDL-C)
Discussion
This study extends our previous work, showing a close association between sdLDL-C and MASLD (formerly MAFLD)8). A novel finding of this study is that Excess TG (TG minus VLDL-C×5) is a more powerful lipid parameter for identifying MASLD than TG or sdLDL-C. The enrichment of VLDL-TG relative to that of VLDL-C can also be expressed as TG/VLDL-C. However, multiple logistic analyses revealed that TG/VLDL-C was inferior to Excess TG in identifying MASLD. VLDL is a nascent lipoprotein that is secreted directly from the liver and subsequently metabolized to LDL in the blood circulation. Thus, liver lipid abnormalities may be reflected more profoundly by VLDL particles than by LDL particles. VLDL particles are heterogeneous and can be divided into two main subspecies: large and TG-rich VLDL 1 particles (Sf 60–400) and small TG-depleted VLDL 2 particles (Sf 20–60)18, 19). Adiels et al.16) were the first to report that hepatic fat mass regulates VLDL1 production in lipoprotein kinetic studies, and several subsequent studies have revealed a specific association between VLDL1 and liver steatosis27-29). In the present study, VLDL-C concentrations were not increased in MASLD despite higher TG concentrations, suggesting a dissociation between VLDL-TG and VLDL-C, and the involvement of VLDL subspecies.
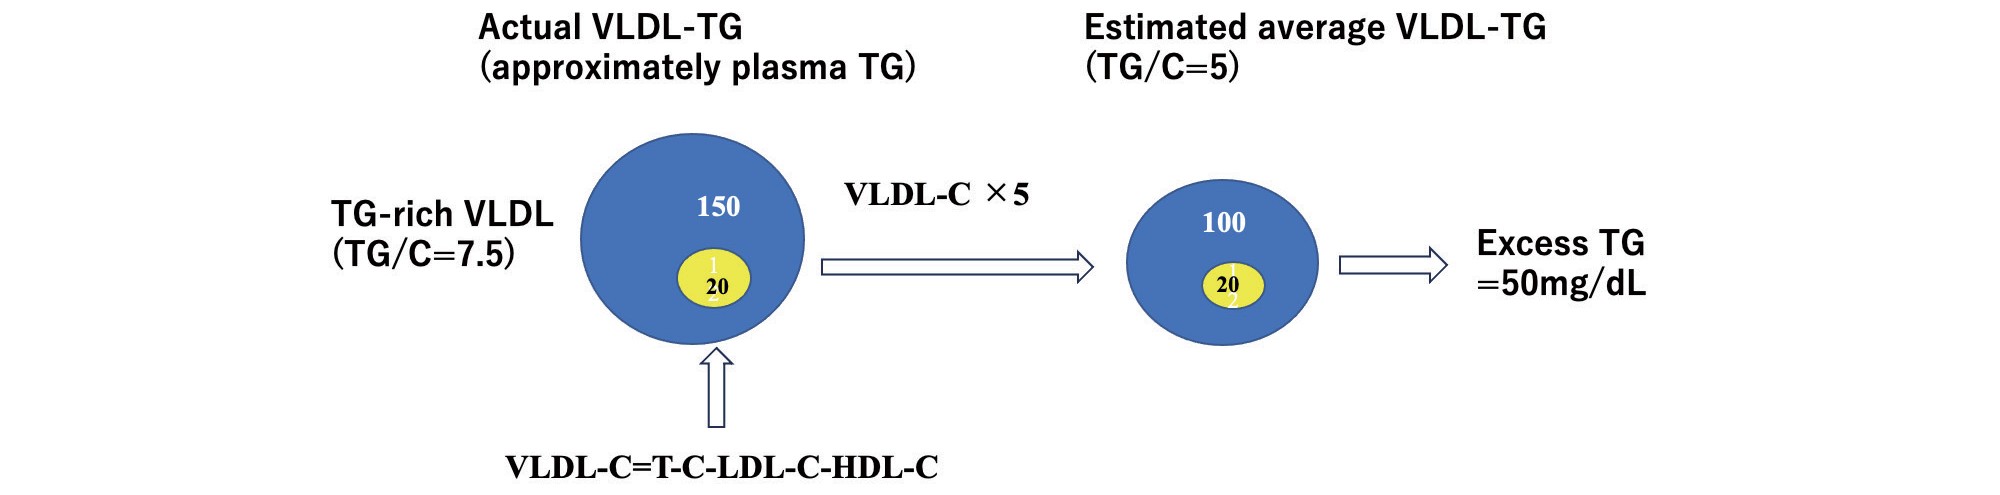
Friedewald et al.20) developed a method for calculating LDL-C by assuming that the VLDL-C was TG/5. Friedewald’s equation is very close to ultracentrifugal and homogeneous methods for measuring LDL-C, and the validity of VLDL-C = TG/5, which is central to this equation, is widely accepted. However, VLDL-C calculated using TG/5 overestimated VLDL-C when VLDL1 with a high TG/C ratio predominated. Indeed, several studies have reported that Friedewald’s LDL-C formula overestimates VLDL-C and thus underestimates LDL-C in samples with high triglyceride levels21, 22). Excess TG is an application of Friedewald’s assumption of mean VLDL-C level. That is, “average” VLDL-TG can be estimated by VLDL-C (TC minus LDL-C minus HDL-C)×5, and the difference between actual VLDL-TG (approximate plasma TG) and estimated VLDL-TG should be “Excess VLDL-TG” relative to “average VLDL-TG.”
A conceptual diagram of Excess TG is shown in Fig.2. In hypertriglyceridemia, VLDL-TG level (150 mg/dL) was 50 mg/dL higher than the average VLDL-TG level (100 mg/dL) estimated from VLDL-C (T-C minus LDL-C minus HDL-C) (20 mg/dL)×5. Therefore, the excess TG was 50 mg/dL.
The direct LDL-C assay was designed to match the LDL-C calculated using the Friedewald formula30) and Friedewald LDL-C (d=1.006–1.063 g/mL) containing IDL-C (d=1.006–1.019 g/mL)20). Therefore, VLDL-C calculated as TC minus LDL-C minus HDL-C does not include IDL-C, and an increase in IDL-C does not directly affect Excess TG. Excess TG includes not only excess VLDL-TG, but also excess LDL-TG and HDL-TG. However, the majority (>90%) of plasma TG in the fasting state is in VLDL, with only a small fraction of TG in HDL and LDL. HDL-TG, in particular, is very low in the general population, ranging from to 3–5 mg/dL even in hypertriglyceridemic metabolic syndrome31). As shown in Table 1, the average LDL-TG level was 14 mg/dL, which is only 1/7 of the plasma total TG level (104 mg/dL). Thus, Excess TG levels may not be significantly affected by the presence of LDL-TG.
Overproduction of VLDL1 is a hallmark of lipid abnormalities in metabolic disorders16), such as metabolic syndrome, type 2 diabetes, and liver steatosis, where hepatic lipogenesis is enhanced by insulin resistance/hyperinsulinemia and visceral adiposity10, 13). The major sources of liver fat are free fatty acid flux from visceral adipose tissues through the porta vein, de novo lipogenesis facilitated by hyperinsulinemia and hyperglycemia, and TG-rich lipoprotein re-uptake11). The VLDL1 concentration is regulated by hepatic production and peripheral removal. Lipoprotein kinetic studies in patients with metabolic syndrome have shown that plasma TG concentrations are more strongly regulated by removal than production13). Because VLDL1-TG is more closely correlated with plasma TG than VLDL2-TG32), VLDL1-TG concentrations are also strongly affected by TG removal. Thus, liver steatosis may directly affect VLDL1-TG production rather than the VLDL1-TG concentration. Despite the importance of increased VLDL1 production as a consequence of hepatic lipogenesis, its measurement requires experimental procedures such as stable isotope methods. Excess TG is significantly associated with adiposity-related parameters, hyperglycemia, hyperinsulinemia (C-peptide), and hypertriglyceridemia, all of which are known to enhance liver steatosis33). Thus, Excess TG may serve as a surrogate marker for VLDL1 production. Future studies should examine the possibility that Excess TG captures VLDL1 production beyond the VLDL1 concentration.
This study was associated with several limitations. First, it is difficult to distinguish between MetALD and MASLD, because they include people who consume small amounts of alcohol. However, there was no significant difference in Excess TG between nondrinkers and current drinkers, and the presence of current drinkers did not affect the association between Excess TG and MASLD. Nevertheless, alcohol consumption may have influenced the results. Second, this cross-sectional and observational study design did not allow us to conclude a causal relationship between Excess TG and the development of MASLD. Similarly, the causal relationship between Excess TG levels and CVD development is unknown. Third, it is unclear whether Excess TG actually reflects the difference between TG-rich VLDL and average VLDL using ultracentrifuges. Fourth, the correlation between Excess TG levels and the severity of liver steatosis is unknown. Fifth, the present results were obtained only from patients with type 2 diabetes and did not include non-diabetic patients with or without MASLD.
Conclusion
Excess TG (TG minus VLDL-C×5) was more closely associated with the presence of MASLD than TG or sdLDL-C levels. Excess TG may reflect the presence of TG-rich VLDL and the overproduction of these particles, a central abnormality of lipoprotein metabolism in metabolic diseases, including MASLD.
Disclosure
Tsutomu Hirano receives advisor fees from Denka Co, and lecture fees from Kowa Co.
This study was partially supported by Denka Co. Ltd. The funding source was not involved in designing, conducting surveys, analyzing, or interpreting the data.
Ethical Considerations
1) This study was approved by the Ethics Committee of Ebina General Hospital (no 115, 2019) Approval date; October 1, 2019.
2) Informed Consent: The study was explained in detail to all participants who gave their consent to participate, and a written informed consent form was obtained from all participants prior to the study.
Acknowledgements
I thank Drs. Takeshi Hirashima, Ema Aoki, and Natsuko Suzuki of the Diabetes Center, Ebina General Hospital for conducting the ViNA cohort. I thank Dr. Fumio Uchiyama of Ebina General Hospital for his advice on CT imaging. I also thank Yasuki Ito MD of Denka Co. for providing the sdLDL-C and LDL-TG test kits.
Approval of the Research Protocol
This study was approved by the Ethics Committee of the Ebina General Hospital (No. 115, 2019). Approval date: October 1, 2019.
Informed Consent
The study was explained in detail to all patients who gave their consent to participate, and a written informed consent form was obtained from all participants prior to the study. This study was conducted in accordance with the principles of the Declaration of Helsinki and the current legal regulations in Japan.
References
- 1) Eslam M, Newsome PN, Sarin SK, Anstee QM, Targher G, Romero-Gomez M, Zelber-Sagi S, Wai-Sun Wong V, Dufour JF, Schattenberg JM, Kawaguchi T, Arrese M, Valenti L, Shiha G, Tiribelli C, Yki-Järvinen H, Fan JG, Grønbæk H, Yilmaz Y, Cortez-Pinto H, Oliveira CP, Bedossa P, Adams LA, Zheng MH, Fouad Y, Chan WK, Mendez-Sanchez N, Ahn SH, Castera L, Bugianesi E, Ratziu V, George J. A new definition for metabolic dysfunction-associated fatty liver disease: An international expert consensus statement. J Hepatol, 2020; 73: 202-209
- 2) Alomari M, Rashid MU, Chadalavada P, Ragheb J, Zafar H, Suarez ZK, Khazaaleh S, Gonzalez AJ, Castro FJ. Comparison between metabolic-associated fatty liver disease and nonalcoholic fatty liver disease: From nomenclature to clinical outcomes. World J Hepatol, 2023; 15: 477-496
- 3) Targher G, Day CP, Bonora E. Risk of cardiovascular disease in patients with nonalcoholic fatty liver disease. N Engl J Med, 2010; 363: 1341-1350
- 4) Stahl EP, Dhindsa DS, Lee SK, Sandesara PB, Chalasani NP, Sperling LS. Nonalcoholic Fatty Liver Disease and the Heart. J Am Coll Cardiol, 2019; 73: 948-963
- 5) Nordestgaard BG. Triglyceride-rich lipoproteins and atherosclerotic cardiovascular disease: new insights from epidemiology, genetics, and biology. Circ Res, 2016; 118: 547-563
- 6) Austin MA. Plasma triglyceride and coronary heart disease. Arterioscler Thromb, 1991; 11: 2-14
- 7) Ikezaki H, Lim E, Cupples LA, Liu CT, Asztalos BF, Schaefer EJ. Small Dense Low-Density Lipoprotein Cholesterol Is the Most Atherogenic Lipoprotein Parameter in the Prospective Framingham Offspring Study. J Am Heart Assoc, 2021; 10: e019140
- 8) Hirano T, Satoh N, Ito Y. Specific Increase in Small Dense Low-Density Lipoprotein-Cholesterol Levels beyond Triglycerides in Patients with Diabetes: Implications for Cardiovascular Risk of MAFLD. J Atheroscler Thromb, 2024; 31: 36-47
- 9) Santos-Baez LS, Ginsberg HN. Nonalcohol fatty liver disease: balancing supply and utilization of triglycerides. Curr Opin Lipidol, 2021; 32: 200-206
- 10) Hirano T. Pathophysiology of Diabetic Dyslipidemia. J Atheroscler Thromb, 2018; 25: 771-782
- 11) Deprince A, Haas JT, Staels B. Dysregulated lipid metabolism links NAFLD to cardiovascular disease. Mol Metab, 2020; 42: 101092
- 12) Berneis KK, Krauss RM. Metabolic origins and clinical significance of LDL heterogeneity. J Lipid Res, 2002; 43: 1363-1379
- 13) Borén J, Watts GF, Adiels M, Söderlund S, Chan DC, Hakkarainen A, Lundbom N, Matikainen N, Kahri J, Vergès B, Barrett PH, Taskinen MR. Kinetic and Related Determinants of Plasma Triglyceride Concentration in Abdominal Obesity: Multicenter Tracer Kinetic Study. Arterioscler Thromb Vasc Biol, 2015; 35: 2218-2224
- 14) Tilly-Kiesi M, Knudsen P, Groop L, Taskinen MR. Hyperinsulinemia and insulin resistance are associated with multiple abnormalities of lipoprotein subclasses in glucose-tolerant relatives of NIDDM patients. Botnia Study Group. J Lipid Res, 1996; 37: 1569-1578
- 15) Gill JM, Brown JC, Bedford D, Wright DM, Cooney J, Hughes DA, Packard CJ, Caslake MJ. Hepatic production of VLDL1 but not VLDL2 is related to insulin resistance in normoglycaemic middle-aged subjects. Atherosclerosis, 2004; 176: 49-56
- 16) Adiels M, Taskinen MR, Packard C, Caslake MJ, Soro-Paavonen A, Westerbacka J, Vehkavaara S, Häkkinen A, Olofsson SO, Yki-Järvinen H, Borén J. Overproduction of large VLDL particles is driven by increased liver fat content in man. Diabetologia, 2006; 49: 755-765
- 17) Chen J, Fang Z, Luo Q, Wang X, Warda M, Das A, Oldoni F, Luo F. Unlocking the mysteries of VLDL: exploring its production, intracellular trafficking, and metabolism as therapeutic targets. Lipids Health Dis, 2024; 23: 14
- 18) Packard CJ, Shepherd J. (1997) Lipoprotein heterogeneity and apolipoprotein B metabolism. Arterioscler Thromb Vasc Biol, 1997; 17: 3542-3556
- 19) Malmström R, Packard CJ, Caslake M, Bedford D, Stewart P, Yki-Järvinen H, Shepherd J, Taskinen MR. Defective regulation of triglyceride metabolism by insulin in the liver in NIDDM. Diabetologia, 1997; 40: 454-462
- 20) Friedewald WT, Levy RI, Fredrickson DS. Estimation of the concentration of low-density lipoprotein cholesterol in plasma, without use of the preparative ultracentrifuge. Clin Chem, 1972; 18: 499-502
- 21) Lee J, Jang S, Jeong H, Ryu OH. Validation of the Friedewald formula for estimating low density lipoprotein cholesterol: the Korea National Health and Nutrition Examination Survey, 2009 to 2011. Korean J Intern Med, 2020; 35: 150-159
- 22) Martin SS, Blaha MJ, Elshazly MB, Toth PP, Kwiterovich PO, Blumenthal RS, Jones SR. Comparison of a novel method vs the Friedewald equation for estimating low-density lipoprotein cholesterol levels from the standard lipid profile. JAMA, 2013; 310: 2061-2068
- 23) Rinella ME, Lazarus JV, Ratziu V, Francque SM, Sanyal AJ, Kanwal F, Romero D, Abdelmalek MF, Anstee QM, Arab JP, Arrese M, Bataller R, Beuers U, Boursier J, Bugianesi E, Byrne CD, Narro GEC, Chowdhury A, Cortez-Pinto H, Cryer DR, Cusi K, El-Kassas M, Klein S, Eskridge W, Fan J, Gawrieh S, Guy CD, Harrison SA, Kim SU, Koot BG, Korenjak M, Kowdley KV, Lacaille F, Loomba R, Mitchell-Thain R, Morgan TR, Powell EE, Roden M, Romero-Gómez M, Silva M, Singh SP, Sookoian SC, Spearman CW, Tiniakos D, Valenti L, Vos MB, Wong VW, Xanthakos S, Yilmaz Y, Younossi Z, Hobbs A, Villota-Rivas M, Newsome PN; NAFLD Nomenclature consensus group. A multisociety Delphi consensus statement on new fatty liver disease nomenclature. Ann Hepatol, 2024; 29: 101133
- 24) Hirano T, Satoh N, Kodera R, Hirashima T, Suzuki N, Aoki E, Oshima T, Hosoya M, Fujita M, Hayashi T, Ito Y. Dyslipidemia in diabetic kidney disease classified by proteinuria and renal dysfunction: A cross-sectional study from a regional diabetes cohort. J Diabetes Investig, 2022; 13: 657-667
- 25) Ito Y, Fujimura M, Ohta M, Hirano T. Development of a homogeneous assay for measurement of small dense LDL cholesterol. Clin Chem, 2011; 57: 57-65
- 26) Ito Y, Ohta M, Ikezaki H, Machida A, Schaefer EJ, Furusyo N. Development and population results of a fully automated homogeneous assay for LDL triglyceride. J Appl Lab Med, 2018; 2: 746-756
- 27) Adiels M, Westerbacka J, Soro-Paavonen A, Häkkinen AM, Vehkavaara S, Caslake MJ, Packard C, Olofsson SO, Yki-Järvinen H, Taskinen MR, Borén J. Acute suppression of VLDL1 secretion rate by insulin is associated with hepatic fat content and insulin resistance. Diabetologia, 2007; 50: 2356-2365
- 28) Männistö VT, Simonen M, Soininen P, Tiainen M, Kangas AJ, Kaminska D et al. Lipoprotein subclass metabolism in nonalcoholic steatohepatitis. J Lipid Res, 2014; 55: 2676-2684
- 29) Borén J, Adiels M, Björnson E, Matikainen N, Söderlund S, Rämö J,et al. Effects of TM6SF2 E167K on hepatic lipid and very low-density lipoprotein metabolism in humans. JCI Insight, 2020; 5: e144079
- 30) Miller WG, Myers GL, Sakurabayashi I, Bachmann LM, Caudill SP, Dziekonski A, et al. Seven direct methods for measuring HDL and LDL cholesterol compared with ultracentrifugation reference measurement procedures. Clin Chem, 201056: 977-986
- 31) Pietzsch J, Julius U, Nitzsche S, Hanefeld M. In vivo evidence for increased apolipoprotein A-I catabolism in subjects with impaired glucose tolerance. Diabetes, 1998; 47: 1928-1934
- 32) Hiukka A, Fruchart-Najib J, Leinonen E, Hilden H, Fruchart JC, Taskinen MR. Alterations of lipids and apolipoprotein CIII in very low density lipoprotein subspecies in type 2 diabetes. Diabetologia, 2005; 48: 1207-1215
- 33) Heeren J, Scheja L. Metabolic-associated fatty liver disease and lipoprotein metabolism. Mol Metab, 2021; 50: 101238
