Practical Training on Adding Polarization Function to Basis Set for Molecular Orbital Calculation of Ethylene
2017 Volume 3 Article ID: 2016-0068
Details
2017 Volume 3 Article ID: 2016-0068
Adding a polarization function to a basis set for molecular orbital calculation is frequently useful for producing accurate representations of chemical bonding. This article explains practical training that could greatly promote intuitive understanding of the general idea of adding a 3d-type polarization function in a π-type molecular-orbital function. In the training, by using Microsoft Excel, students draw contour plots of the molecular orbitals supplemented with and without the polarization function in ethylene (CH2 = CH2), and visualize the effect of the addition.
In the teaching of quantum chemistry, personally drawing atomic- and molecular-orbital (AO and MO) contour-plots by using Microsoft Excel greatly improves students’ intuitive understanding of the MO theory [1,2,3,4,5,6,7]. This article explains a part of our practical training [3,4,5,6,7,8], which is useful for the teaching of quantum chemistry.
In previous papers [4,7], we reported practical training on adding polarization and diffuse functions [9] to basis set for MO calculation in H2+, H2O, and H2−. In the training, our students were not given any tools except for commercially available Excel, and created, right from the beginning by themselves, the plots of the MOs that essentially represented the effect of the addition. By seeing the addition, they were encouraged to master the essential physical concept underlying the addition. The concept was not a “black box” for them.
However, on adding a d-type polarization function to 2p AOs, the previous paper [7] explained only the practical training with H2O, although examining the contribution of a d-type polarization function in a π-type bonding-MO function may also be interesting as a subject of the training. By adding 3d-type polarization functions, two 2p AOs forming the π-type bonding-MO become distorted in shape to the internuclear region. In the work presented here, we have developed a new practical-training program on adding the 3d-type polarization functions in the π-type bonding-MO function of ethylene (CH2 = CH2), although such a training is slightly more complex and time-consuming than that of H2O.
In a simple MO picture, the π-type bonding-MO in the ground state of planar CH2 = CH2 (Figure 1) is given by
ϕ1 = N1{χA(2pz) + χB(2pz)} (1)
where χA(2pz) and χB(2pz) respectively denote out-of-plane 2pz AOs on carbon atoms A and B, and N1 is a normalization factor. In this paper, the internuclear direction is set to the x axis, and the z axis is set to lie perpendicular to the molecular plane. A disadvantage to ϕ1 is that the |ϕ1| values above and below the middle point of the C–C internuclear axis (dashed-oval regions in Figure 1) are less than those of the real π-type bonding-MO. In CH2 = CH2, the χA(2pz) and χB(2pz) AOs are insufficient to accurately reflect Coulomb attraction from nuclei B and A, respectively, and thus the MO ϕ1 cannot realize correct Coulomb attraction between carbon atoms A and B. Accordingly, some additional flexibility is needed to allow the 2pz AOs on the carbon atoms to be more asymmetric around the nuclei.

Schematic representation of simple π-type bonding-MO in planar CH2=CH2. A and B denote the carbon atoms. The horizontal and vertical directions are set to the x and z axes, respectively.
To allow for this asymmetry, 3dxz-type polarization functions {χpA(3dxz) and –χpB(3dxz)} are respectively added to χA(2pz) and χB(2pz) in CH2 = CH2 as shown in Figure 2. The superscript p to the right of χ means a polarization function. The orbital functions obtained by adding the polarization functions (φA and φB) are given by
φA = N2{χA(2pz) + C1χpA(3dxz)} (2)
φB = N2{χB(2pz) − C1χpB(3dxz)} (3)
where N2 stands for a normalization factor, and C1 is a mixing ratio of the 3dxz-type polarization function and the original orbital function (0 < C1 < 1). The orbital functions φA and φB are distorted in shape and have their lobes shifted toward the region above and below the internuclear middle point as shown in Figure 2. Note that the signs of the second terms in equations 2 and 3 are the reverse of each other, because the orbital functions φA and φB on carbon atoms A and B should respectively point toward the plane lying perpendicular to the molecular plane and midway between nuclei A and B, that is, toward the positive and negative x directions, as shown in Figure 2. These orbital functions φA and φB have one additional node more than χA(2pz) and χB(2pz). The π-type bonding-MO resulting from adding the polarization functions in CH2 = CH2 is given by
ϕ2 = N3(φA + φB) (4)
where N3 stands for a normalization factor. The π-type bonding-MO ϕ2 realizing the shift of the lobes toward the internuclear region can represent the accurate Coulomb attraction between carbon atoms A and B (Figure 2).
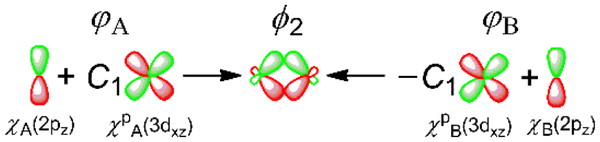
Addition of 3dxz-type polarization functions to 2pz AOs on carbon atoms A and B (φA and φB, respectively). C1 stands for the mixing ratio of the polarization function and the original orbital function (0 < C1 < 1).
In the present study, to support our practical training, some MO calculations have been made, and the resulting representations of the π-type bonding-MO in CH2 = CH2 are given in Supplementary Materials. Briefly, the addition of the polarization function greatly enhances the calculated π-electron distribution at the dashed-oval regions in Figure 1.
In our practical training, contour plots of χA(2pz), φA (Eq. 2), ϕ1 (Eq. 1), and ϕ2 (Eq. 4) in CH2 = CH2 are drawn with Excel. In the plot of ϕ2, to reproduce the π-electron distribution calculated with adding the polarization function (see Supplementary Materials), the C1 value should be taken as 0.15, so N2 becomes 0.99 by normalizations of equations 2 and 3. To show the effect of adding the polarization function more clearly, the C1 value should be greater than 0.15. For simplification, N1 and N3 are taken as 2–1/2. The AO functions χA(2pz), χB(2pz), χpA(3dxz), and χpB(3dxz) are given by the product of the corresponding radial function and spherical harmonics function and are expressed in atomic units (au). These AO functions are then given by
χX(2pz) = 4−1(2π)–1/2·Z2p5/2zX·exp(–Z2prX/2) (5)
χpX(3dxz) = (2/81) (2π)–1/2·Z3d7/2xXzX·exp(–Z3drX/3) (6)
where X = A or B, rX denotes the distance from nucleus X, and xX and zX are the values of the x and z coordinates using nucleus X as the coordinate origin. Z2p and Z3d stand for the effective nuclear charges for the 2p and 3d AO functions, respectively. According to Slater’s rule [10], Z2p has a value of 3.25. Z3d is taken as 4.88 according to the equation reported by Nakatsuji et al. (Z2p/2 = Z3d/3) [11]. The C–C bond length of CH2 = CH2 is set to 2.53 au [12].
The contour representations of orbital amplitudes of χA(2pz) and φA in CH2 = CH2 are thus drawn and given in Figures 3a and b, respectively. As shown, the orbital φA is distorted in shape from χA(2pz) and the two charge-centers are shifted away from points on the 2p-orbital axis to the positive x direction. Similar charge-center shifts to the negative x direction are also realized in φB (Figure not shown). As expected above, these charge-center shifts are consistent with Figure 2.

(a) Contour representation of amplitude of χA(2pz) using carbon nucleus A as coordinate origin. The grid spacing and contour interval are set to 0.2 au and 0.1, respectively. (b) φA. For the drawing, the C1 and N2 values are set to 0.15 and 0.99, respectively. (c) ϕ1. (d) ϕ2. Here, the C1 and N2 values are again set to 0.15 and 0.99, respectively. Under the conditions, the π-electron distribution calculated with adding the polarization function (see Supplementary Materials) is reproduced as described in the text. (e) Difference in electron distribution between ϕ1 and ϕ2. The grid spacing and contour interval are set to 0.2 au and 0.02, respectively. The carbon nuclear positions are shown in the figure.
Figures 3c and d show the contour representation of orbital amplitude of ϕ1 and ϕ2 in CH2 = CH2, and agree well with Figures 1 and 2, respectively. The |ϕ2| values above and below the middle point of the C–C internuclear axis are enhanced from the |ϕ1| values (Figures 3c and d). Figure 3e shows contour representation of the difference in electron distribution between ϕ1 and ϕ2. The electron distribution of ϕ2 above and below the internuclear middle point is also enhanced from that of ϕ1, so that accurate Coulomb attraction between carbon atoms A and B is represented in ϕ2.
Thus, accurate representation of π bonding in CH2 = CH2 requires orbital functions (φA and φB) that incorporate the polarization functions {χpA(3dxz) and − χpB(3dxz)}. In this way, the drawings of the orbital functions as contour plots could greatly help students to better understand the general ideas of the d-type polarization function and π bonding.
In the practical training reported in this article, by using Excel, the students personally draw the contour plots of the π-type bonding-MOs supplemented with and without the polarization function in CH2 = CH2, and visualize the effect of the addition. Several sample plots obtained in our training are provided in Supplementary Materials. Ideas developed in treating simple molecules such as CH2 = CH2 would provide a basis for dealing with complex systems.
Supplementary MaterialsSome computational representations of the π-type bonding-MO in CH2=CH2, and Excel files for drawing the contour plots of the MOs supplemented with and without some function in our practical training.
https://www.jstage.jst.go.jp/article/jccjie/3/0/3_2016-0068/_supplement/3_2016-0068_1.zip