Abstract
The phase diagram for a three-phase equilibrium was derived using van der Waals (vdW)
equation of state (EOS) with respect to pressure. Aside from the typical liquid-gas vdW
EOS, a new solid-gas vdW EOS was introduced. The new vdW EOS had the same functional form
as the original equation of state and only the van der Waals coefficients were different.
The thermodynamic EOSs were integrated to obtain the internal energy and the integral
constants were given explicitly. The calculated phase diagram was consistent with that for
argon and the Lennard-Jones system.
1 INTRODUCTION
The phase transition is one of the most important topics to be solved by thermodynamics
[1]. This phenomenon is frequently studied using
molecular dynamics simulations (MD) on the Lennard-Jones (LJ) system [2,3,4]. The results are summarized as the equation of state (EOS) with complicated
form and many coefficients [5,6]. We have reported some simpler EOSs [7,8,9,10,11,12,13], which were based on the simulation results on the LJ system with continuous
interaction function.
The liquid-gas transition is understood easily by the van der Waals (vdW) EOS (Eq. (1))
[1]. This EOS seems the simplest one to derive the
liquid-gas transition. For this reason, the vdW EOS is studied in this work. This is based
on the hard sphere model with the discrete repulsive interaction function. The notation is
the same as that typically used: pressure p, Boltzmann constant
k, temperature T, volume V, number of
particles N, and a and b
coefficients.
|
p
=
k
T
V
N
−
b
−
a
(
N
V
)
2
| (1) |
Such a transition is found between a sparse phase and a condensed phase. The solid-gas
transition is expected to be obtained using the vdW EOS by the same way if another vdW EOS
is introduced with suitable parameters. The solid-liquid transition must be solved using the
Gibbs energies [1] of these phases.
This work gives an explicit vdW EOS to be used in the calculation of Gibbs energies [1] for the three phases in a three-phase equilibrium. The
solid phase is characterized as denser than the liquid phase. The thermodynamic EOS (Eq.
(2)) [1] will be integrated to obtain the internal
energy, U. This has the integral constant U0,
which is given tentatively as:
|
(
∂
U
∂
V
)
T
=
T
(
∂
p
∂
T
)
V
−
p
| (2) |
|
U
N
=
−
a
N
V
+
U
0
(
T
)
N
| (3) |
The phase diagram is obtained by numerical calculations that can be easily performed using
a program such as Microsoft Excel. The resultant phase diagram should be consistent with
that for argon and the Lennard-Jones (LJ) system.
2 VAN DER WAALS EQUATION OF STATE
The vdW coefficient a has dimensions of [Energy]*[Volume] in equation (1).
For this reason, this is replaced as:
Therefore, the vdW EOS is written for a liquid-gas system as:
|
p
(
l
i
q
u
i
d
)
(
ε
b
)
=
(
k
T
ε
)
1
V
N
b
−
1
−
(
N
b
V
)
2
,
V
N
b
>
1
| (5) |
The internal energy (Eq. (3)) is also rewritten:
|
U
N
ε
=
−
N
b
V
+
U
0
N
ε
| (6) |
Here, a new vdW EOS is introduced for a solid-gas2 system:
|
p
(
s
o
l
i
d
)
(
ε
b
)
=
(
k
T
ε
)
1
V
N
b
−
0.9
−
1.5
(
N
b
V
)
2
,
V
N
b
>
0.9
| (7) |
The vdW coefficients a and b for a solid-gas2 system are
denoted as and bs, respectively.
These have the following relation with the coefficients a and
b:
|
a
s
=
1.5
a
,
b
s
=
0.9
b
| (8) |
These numerical factors 1.5 and 0.9 are explained as follows. The volume of a solid is less
than that of a liquid by a factor 0.9. The solid has lower potential energy. The factor 1.5
is a tentative value.
The integral constant term of internal energy U0, is
tentatively assumed to be:
|
U
(
L
i
q
u
i
d
)
=
−
(
N
b
)
(
N
ε
)
V
+
U
0
(
L
i
q
u
i
d
)
U
0
(
Liquid
)
=
N
(
3
2
k
T
+
1.6
k
T
−
1.5
ε
)
| (9) |
|
U
(
S
o
l
i
d
)
=
−
1.5
(
N
b
)
(
N
ε
)
V
+
U
0
(
S
o
l
i
d
)
U
0
(
S
o
l
i
d
)
=
N
(
3
2
k
T
+
1.5
k
T
−
1.5
ε
+
u
0
(
adjustable
)
)
| (10) |
The first term in U0 is the kinetic energy. The second and
third terms correspond to the effective temperature-dependent potential energies. The last
term u0 in the solid phase is an adjustable parameter.
Equations (9) and (10) are only tentative and after the calculation and comparison with
experimental data, these should be modified as necessary.
The origins of pressure in equation (5) and equation (7) are common as seen in the low
density limit. The origins of density-dependent interaction energy in equation (9) and
equation (10) are also common in the low density limit. The term
U0 is the integral constant. For this reason, it is allowed to
compare pressures and internal energies in liquid-gas EOS and solid-gas2 EOS.
3 ENTROPY
The entropy change of vdW EOS by isothermal expansion is calculated with the aid of the
first law [1] as follows. The work due to the
isothermal expansion w at temperature T is expressed
as:
|
w
=
−
∫
V
i
V
f
p
d
V
=
−
N
k
T
ln
(
V
f
−
N
b
V
i
−
N
b
)
−
a
(
N
V
f
−
N
V
i
)
| (11) |
The first law is written with the reversible heat,
qrev:
The change of the internal energy by isothermal expansion is calculated by:
|
Δ
U
N
=
−
ε
b
(
N
V
f
−
N
V
i
)
| (13) |
The entropy change ΔS, by the isothermal expansion is obtained
as:
|
Δ
S
=
1
T
∫
i
f
d
q
r
e
v
=
q
r
e
v
T
=
N
k
ln
(
V
f
−
N
b
V
i
−
N
b
)
| (14) |
The entropy change due to the heating process under constant volume is calculated using
equations (6), (9) and (10). This is added to equation (14) for the general state
change:
|
Δ
S
(
T
i
,
V
i
→
T
f
,
V
f
,
N
)
=
N
k
ln
(
V
f
−
N
b
V
i
−
N
b
)
+
(
d
U
0
d
T
)
V
ln
(
T
f
T
i
)
| (15) |
Here, the origin of entropy is introduced in this case for convenience as
follows:
|
S
(
T
i
=
ε
/
k
,
V
i
=
2
N
b
,
N
)
≡
0
| (16) |
The entropy change thus has the following form:
|
Δ
S
(
T
i
,
V
i
→
T
f
,
V
f
,
N
)
=
N
k
ln
(
V
f
−
N
b
N
b
)
+
3.1
k
N
ln
(
k
T
f
ε
)
(
l
i
q
u
i
d
)
| (17) |
|
Δ
S
(
T
i
,
V
i
→
T
f
,
V
f
,
N
)
=
N
k
ln
(
V
f
−
N
b
N
b
)
+
3
k
N
ln
(
k
T
f
ε
)
(
s
o
l
i
d
)
| (18) |
By the standard way, the Gibbs energy G are obtained by the above
Equations. As the origins of the entropy are defined in the common way in liquid EOS and
solid EOS, it is allowed to compare the Gibbs energy G of solid-gas2 EOS
with that of liquid-gas EOS directly.
4 THERMODYNAMIC QUANTITIES IN (V, T) SPACE
The pressures p by vdW EOS are plotted as a function of the number density
at T = 0.14 ε/k in Figure 1. The
plots for a solid-gas2 EOS, liquid-gas EOS and ideal gas are compared. The liquid is the
high density part of liquid-gas EOS. The gas is shown in the low density part. The solid is
the high density part of solid-gas2 EOS. The pressures of the solid and liquid are negative
in some region, i.e., attractive forces are dominant in the relevant number densities of
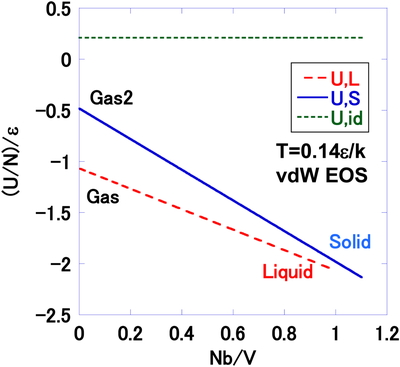
these structures. Figure 2 shows the internal
energies U by vdW EOS, for the solid, liquid and ideal gas at
T = 0.14ε/k. The linear function of the internal energy as a function of
number density is a typical characteristic in vdW EOS. The solid and liquid have the similar
stabilities in the dense region. The entropies S by vdW EOS, are presented
in Figure 3 as a function of the number density at
T = 0.14ε/k. The negative sign of the entropy is only the result of the
origin of the entropy selected in the present work. The Gibbs energies by vdW EOS are shown
in Figure 4 as a function of the number density at
T = 0.14ε/k.

5 PHASE EQUILIBRIUM POINTS
The condition of the phase equilibrium between phases 1 and 2 at temperature
T in (T-p) space is expressed by:
|
p
1
(
V
1
,
T
)
=
p
2
(
V
2
,
T
)
,
G
1
(
V
1
,
T
)
N
1
=
G
2
(
V
2
,
T
)
N
2
| (19) |
The vdW EOSs are known as functions of volume and temperature; therefore, equation (19) can
be solved numerically [9]. The
(G/N)p graphs for both branches are
plotted using the volume per particle as an auxiliary variable. Some example worksheets will
be shown in the Appendix. Figure 5 shows an
example for the solid-liquid equilibrium at T = 0.28ε/k by vdW EOS. The
Gibbs energy G/N vs. p plot for the solid branch crosses
with that for the liquid branch at the point (p = 0.4ε/b.
G/N = 0.57ε). This Figure also shows the solid has lower
G than the liquid in the region p > 0.4ε/b. The
liquid-gas transition by vdW EOS is observed at the same temperature, as shown in Figure 6. This corresponds to Maxwell construction
[1]. Here, liquid, gas and unstable branches are
evident. The unstable branch corresponds to the mechanically unstable region in the
p-V-T relation:
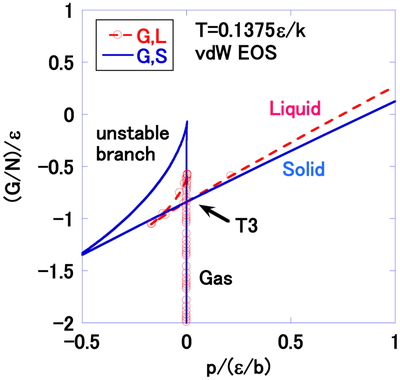
The triple point case by vdW EOS is described in Figure
7, where T = 0.1375ε/k. The gas in the liquid-gas EOS is more
stable than the second gas-type solution in the solid-gas2 EOS. For this reason, the solid,
liquid and gas branches cross at the point shown as T3 (P = 0.00066ε/b,
G/N = −0.84ε) in Figure 7. The
solid is most stable under higher pressure, whereas the gas is more stable than the liquid
and solid under lower pressure at this temperature. The critical point (Eq. (21)) [1] and the triple point by vdW EOS are compared with the
experimental results for argon in Table
1.
|
T
c
=
8
27
ε
k
,
p
c
=
1
27
ε
b
,
V
c
=
3
b
| (21) |
Table 1.
Calculated critical and triple point parameters compared with the experimental
data for argon [
24].
|
pc/(ε/b) |
p3/(ε/b) |
Tc/(ε/k) |
T3/(ε/k) |
Vc/b |
V3L/b |
p3/pc |
T3/Tc |
V3L/Vc |
| vdW |
0.037 |
0.00066 |
0.296 |
0.140 |
3.000 |
0.836 |
0.018 |
0.47 |
0.28 |
|
pc/atm |
p3/atm |
Tc/K |
T3/K |
Vc/(cm3/mol) |
V3L/(cm3/mol) |
p3/pc |
T3/Tc |
V3L/Vc |
| Ar |
48.0 |
0.681 |
151 |
87.8 |
75.3 |
28.2 |
0.0142 |
0.582 |
0.375 |
The present model gives comparable results for the relative values
(T3/Tc etc.) shown in this table, where the
suffix 3 is used to indicate the triple point
The potential parameters ε and b for argon are determined
from the experimental data for Tc and
pc:
|
T
c
=
8
27
ε
k
=
150.72
K
,
p
c
=
1
27
ε
b
=
4.86
MPa
| (22) |
The potential parameters for argon are given in Table
2.
Table 2.
vdW EOS coefficients
a, b and
ε (=
a/b) for argon adjusted with respect to
Tc and
pc.
| a/Jm3 |
b/m3 |
ε/J |
(ε/k)/K |
| 3.76E-49 |
5.35E-29 |
7.02E-21 |
5.09E+02 |
6 PHASE DIAGRAM
Figure 8 shows a comparison of the phase diagram
in (p, T) space by vdW EOS with the experimental [15,16], molecular dynamics [17,18,19,20,21] and free energy calculations [22,23] for the LJ system. The
calculated phase diagram is similar to that observed for argon and the LJ system. This
indicates that the present model can reproduce the phase diagram in a real system, at least
qualitatively.

Figure 9 shows the temperature–number density
phase boundaries by vdW EOS and a comparison of the calculated result with that for the LJ
system [6,22].
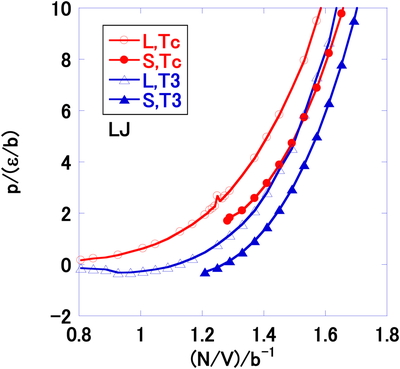
The sign of the tangent of the solid-liquid phase boundaries in Figure 9 is different from that for the LJ system. To elucidate the
reason for this, the vdW pressures at T3 and
Tc as a function of the number density were compared with
the LJ system in Figures. 10 and 11, respectively. Figure 10 is obtained by the present vdW EOS. The Figure 11 is calculated by MD on LJ system. The horizontal black
lines show the transitions at T3 and
Tc. Although the present model has the limit of number density
(Eq. (23)), the LJ system has no such boundary, as shown in Figures. 10 and 11.
|
N
V
<
1
b
(
l
i
q
u
i
d
)
,
N
V
<
1
0.9
b
(
s
o
l
i
d
)
| (23) |
By these considerations, it is supposed that any EOS on the hard sphere model like vdW EOS
in the repulsive part of interaction has the similar tangent of the solid-liquid phase
boundaries. For this reason, the continuous potential model like LJ is better to discuss the
tangent of the solid-liquid phase boundaries observed by macroscopic experiments.
The entropies at the solid-liquid phase boundaries by vdW EOS are shown in Figure 12, including a comparison with the simulation
results on LJ system [22]. The absolute entropy value
has no meaning but has only a relative relation in each model. The difference of entropy
ΔS/N between the solid and liquid is approximately 0.2k–0.7k in vdW EOS,
whereas it is 1.0k–1.6k for the LJ system. The entropy increase as the temperature increases
rapidly on the solid-liquid phase boundary is due to the accompanying steep decrease of the
number density (see Figure 9). This is understood
by considering Figure 4; the entropy of vdW EOS
increases if the number density decreases at the same temperature.
The internal energy at the solid-liquid phase boundary is shown in Figure 13. The change of the internal energy ΔU/N,
is ca. −0.02ε–0.09ε. This is different from that for the LJ system, 0.2ε–0.3ε; therefore,
the functions assumed in equations (9) and (10) require modification.
The volume of liquid and gas around the critical pressure pc,
is plotted in Figure 14 as a function of
temperature at several pressures. The liquid-gas-phase transition is observed at
p = 0.3ε/b. equation (23) was solved numerically to obtain this
Figure.
|
p
(
V
,
T
,
N
)
=
0.3
ε/b
| (24) |
Some practical examples of such numerical calculations are given in the Appendix.
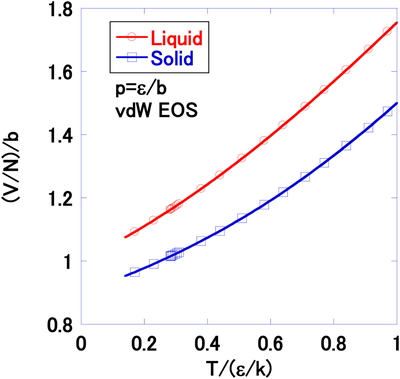
Figure 15 gives an example of volume near the
solid-liquid phase transition under pressure p = ε/b. In this case, the
pressure function for the solid-gas-phase transition must be also solved other than that for
the liquid-gas:
|
p
s
(
V
,
N
,
T
)
=
ε
/
b
| (25) |
Figure 15 shows the solid-liquid transition
occurs at very low density compared to that for the LJ system (Figure 9).
7 CONCLUSION
The development in this work is the introduction of a solid-gas2 EOS with the same
functional form as that for the liquid-gas system. The phase diagram in
(p-T) space for a three-phase equilibrium is obtained by thermodynamics
calculations using the vdW EOS. The calculated phase diagram is similar to that observed for
argon and the LJ system. The phase diagram in (T-N/V) space by vdW EOS has
a different sign for the tangent of the solid-liquid phase boundaries from that for the LJ
system. The hard sphere repulsive interaction part should be modified to the soft core
type.
Acknowledgment
The author would like to thank Prof. Hironori Ogata for valuable discussion. The author
would like to thank the Research Center for Computing and Multimedia Studies at Hosei
University for the use of computer resources.
REFERENCES
- [1] P. W. Atkins, Physical
Chemistry, Oxford Univ. Press, Oxford (1998).
- [2] M. P. Allen, D. J. Tildesley,
Computer Simulation of Liquids, Clarendon Press, Oxford (1992).
- [3] Y. Kataoka, Y. Yamada, J.
Comput. Chem. Jpn., 13, 115 (2014). doi:10.2477/jccj.2013-0023
- [4] Y. Kataoka, Y. Yamada, J.
Comput. Chem. Jpn., 13, 257 (2014). doi:10.2477/jccj.2014-0016
- [5] J. K. Johnson, J. A.
Zollweg, K. E. Gubbins, Mol. Phys., 78, 591 (1993).
- [6] J. Kolafa, I. Nezbeda, Fluid
Phase Equilib., 100, 1 (1994). doi:10.1016/0378-3812(94)80001-4
- [7] Y. Kataoka, Y. Yamada, J.
Comput. Chem. Jpn., 12, 101 (2013). doi:10.2477/jccj.2012-0027
- [8] Y. Kataoka, Y. Yamada, J.
Comput. Chem. Jpn., 10, 98 (2011). doi:10.2477/jccj.H2308
- [9] Y. Kataoka, Y. Yamada, J.
Comput. Chem. Jpn., 11, 81 (2012). doi:10.2477/jccj.2011-0030
- [10] Y. Kataoka, Y. Yamada, J.
Comput. Chem. Jpn., 11, 165 (2012). doi:10.2477/jccj.2012-0006
- [11] Y. Kataoka, Y. Yamada, J.
Comput. Chem. Jpn., 11, 174 (2012). doi:10.2477/jccj.2012-0009
- [12] Y. Kataoka, Y. Yamada, J.
Comput. Chem. Jpn., 12, 181 (2013). doi:10.2477/jccj.2013-0007
- [13] Y. Kataoka, Y. Yamada, J.
Comput. Chem. Jpn., 13, 130 (2014). doi:10.2477/jccj.2014-0002
- [14] K. Clusius, K. Weigand, Z.
Phys. Chem., 46B, 1 (1940). doi:10.1515/zpch-1940-4602
- [15] R. K. Crawford, W. B.
Daniels, Phys. Rev. Lett., 21, 367 (1968). doi:10.1103/PhysRevLett.21.367
- [16] J.-P. Hansen, L. Verlet,
Phys. Rev., 184, 151 (1969). doi:10.1103/PhysRev.184.151
- [17] D. A. Kofke, J. Chem. Phys.,
98, 4149 (1993). doi:10.1063/1.465023
- [18] R. Agrawal, D. A. Kofke,
Mol. Phys., 85, 43 (1995). doi:10.1080/00268979500100921
- [19] H. Okumura, F. Yonezawa, J.
Chem. Phys., 113, 9162 (2000). doi:10.1063/1.1320828
- [20] H. Okumura, F. Yonezawa, J.
Phys. Soc. Jpn., 70, 1990 (2001). doi:10.1143/JPSJ.70.1990
- [21] M. A. van der Hoef, J. Chem.
Phys., 117, 5092 (2002). doi:10.1063/1.1498462
- [22] M. A. Barroso, A. L.
Ferreira, J. Chem. Phys., 116, 7145 (2002). doi:10.1063/1.1464828
- [23] A. Ahmed, R. J. Sadus, J.
Chem. Phys., 131, 174504 (2009). doi:10.1063/1.3253686
- [24] CRC Handbook of Chemistry and
Physics. Ed., D. R. Lide, CRC press, Boca Raton (1995).