Abstract
In the present work, phase diagrams in (pressure, temperature) space were calculated for
water, oxygen, propane and lithium, employing van der Waals (vdW) equations of state,
similar to an approach previously employed for argon. These calculations allowed the
triple point temperatures to be obtained. The experimentally-determined triple point
pressure values (p3) normalized by the critical point pressure
(pc) (that is, p3/pc) are known to exhibit a
significant correlation with the normalized triple point temperature
(T3/Tc), and the present results reproduce this correlation
qualitatively. This work also demonstrated that the low-density solid, high-density solid,
liquid and gas-phases of water produce a phase diagram similar to that of the ice-water
system.
1 INTRODUCTION
In a previous study, we obtained the three-phase equilibrium diagram for argon using van
der Waals (vdW) equations of state (EOS) [1]. A novel
aspect of this work was the introduction of a vdW equation of state for a solid-gas system
in addition to the ordinary vdW EOS [2]. The solid was
treated as a condensed phase with a higher density than the liquid, with a stronger
effective attractive interaction in the solid phase than in the liquid phase. Because a
solid-gas2 EOS [1] has the same form as the original
liquid-gas EOS [2] with different coefficients, the
gas, liquid and solid phases are treated uniformly in the calculation of the thermodynamic
properties. The universality of this EOS will be tested in this paper.
This same concept was applied to the present model of water as a low-density solid and
high-density solid. Although there are many ice structures in the real system [3], only two types of solid were assumed for the sake of
simplicity in the calculations in this study [3,4,5]. In Figure 1, the experimentally observed triple point
pressure (p3) normalized by the critical point pressure
(pc) (that is, p3/pc) is plotted as a function of the
normalized triple point temperature (T3) (that is, T3/Tc)
[5,6,7,8,9,10,11,12,13,14]. This
Figure uses the vapor pressure at the melting point for those instances for which the triple
point pressure has not been reported. It is evident that p3/pc becomes very
small as T3/Tc decreases. In this study, water, oxygen, propane and lithium
were all examined using the vdW technique, and the results of these theoretical calculations
are compared with experimental data. These substances are selected to see how the vdW EOS
can reproduce the normalized pressure p3/pc in a wide normalized
temperature T3/Tc range. Another reason for the selection is the variety in
chemical properties.

2 WATER
The melting line of ice at low pressures (P < 200 MPa) has a negative
tangent, as in the equation below [2,3,4,5].
|
(
d
p
d
T
)
m
e
l
t
i
n
g
<
0
(low density solid - liquid)
| (1) |
This results from the following inequality for the volume per particle,
V/N,
|
(
V
N
)
S
o
l
i
d
>
(
V
N
)
L
i
q
u
i
d
| (2) |
For this reason, solid water at standard pressure is referred to as low-density ice. Many
types of high-density ice have been identified [3],
although here we assume only one type of high-density solid so as to simplify the
calculations. The ice VII and VIII have about twice the density of low density ice case. The
present high-density solid is a model of ice VII and VIII.
According to previously published work [1], the
following set of equations of state can be employed for the pressure, p,
and the internal energy, U, of the water system, in which the vdW
coefficients ε ( = a/b) and b are
used.
|
p
L
ε
b
=
k
T
ε
1
V
N
b
−
1
−
(
N
b
V
)
2
,
(
V
N
b
>
1
)
,
(liquid)
| (3) |
|
U
L
N
=
3
k
T
−
ε
b
N
V
+
3
k
T
−
1.5
ε
,
(
liquid
)
| (4) |
|
p
S
ε
b
=
k
T
ε
1
V
N
b
−
1.15
−
3
(
N
b
V
)
2
,
(
V
N
b
>
1.15
)
,
(solid)
| (5) |
|
U
S
N
=
3
k
T
−
3
ε
b
N
V
+
3
k
T
−
1.5
ε
+
1.51
ε
(
adjustable
)
, (solid)
| (6) |
|
p
H
ε
b
=
k
T
ε
1
V
N
b
−
0.6
−
1.5
(
N
b
V
)
2
,
(
V
N
b
>
0.6
)
,
(high density solid)
| (7) |
|
U
H
N
=
3
k
T
−
1.5
ε
b
N
V
+
3
k
T
−
1.5
ε
+
1.43
ε
(
adjustable
)
, (high density solid)
| (8) |
The parameter b in equation (3) has a meaning of hard sphere volume of the
molecule in the liquid state. For this reason the volume of liquid must satisfy the
inequality mentioned in equation (3). The first term in equations (4), (6) and (8) is the
kinetic energy in the internal energy, the second term is the density-dependent potential
energy, and the other terms are the density-independent potential energy. The average of
potential energy has also kinetic energy term which depends on the degree of freedom. Water
molecule has translational and rotational degrees of freedom. An adjustable parameter is
assumed in the case of the internal energy of the solid.
In Figure 2, the pressure values are plotted as
functions of the normalized number density (Nb/V) at T =
0.125 ε/k for three states. Here, the high-density solid, the liquid and the low-density
solid-states appear as the density decreases, because of the inequality associated with the
van der Waals coefficient b, as below.
|
b
S
=
1.15
b
>
b
>
b
H
=
0.6
b
| (9) |
Figure 3 presents the internal energy per
particle, U/N, as functions of the normalized number density at
T = 0.125 ε/k. The internal energy of the high-density solid is seen to
be lowest in the region of highest density, while the liquid phase is energetically stable
in the intermediate density region around 0.826 < Nb/V < 1 and the
low-density solid is stable in the region 0.758 < Nb/V < 0.826.
The entropy differences, ΔS, were calculated using the first law of
thermodynamics, as in a previous study [1]. The origin
for S was selected as follows.
|
S
(
V
/
N
=
2
b
,
T
=
ε
/
k
)
=
0
| (10) |
The entropy difference, ΔS, is called as S, hereafter. The resulting
S values are summarized in Figure
4 as functions of the normalized number density, Nb/V, at
T = 0.125 ε/k. The S values are evidently minimized near
the density boundaries, as follows.
|
N
b
/
V
<
1
/
0.6
, (High density solid)
N
b
/
V
<
1
, (Liquid)
N
b
/
V
<
1
/
1.15
, (Solid)
| (11) |
In contrast, S becomes very large at the low-density limit, such that the
following holds true.
|
S
→
∞
,
when
N
b
/
V
→
0
| (12) |
As a result, the Gibbs energy, G, is sufficiently low in the low-density
limit, as shown in Figure 5, which plots the
number density dependence of G at T = 0.125 ε/k. The
pressure (Figure 2) and the Gibbs energy (Figure 5) both exhibit a so-called vdW loop.
In each case, the phase boundary was obtained numerically in the same manner as reported in
a previous paper [1]. There are two types of triple
points in this system, one of which is the low pressure triple point seen in Figure 6, for which the triple point temperature is
0.125 ε/k. The Gibbs energy per particle, G/N, is plotted as a function of
pressure at this temperature in Figure 6, and it
can be seen that the solid, liquid and gas branches all cross at the point labeled “T3.” The
associated triple point pressure, p3, is given below.
|
p
3
=
3.0
×
10
−
4
ε
/
b
| (13) |
Figure 6 shows the following
inequalities.
|
G
(
Gas
)
>
G
(
High Density Solid
)
>
G
(
Solid
)
>
G
(
Liquid
)
,
if
p
>
p
3
G
(
High Density Solid
)
>
G
(
Liquid
)
>
G
(
Solid
)
>
G
(
Gas
)
,
if
p
<
p
3
| (14) |
The second triple point is the high-pressure triple point at (T3H, p3H) as
shown in Figure 7, and as given
below.
|
T
3
H
=
0.100
ε
/
k
p
3
H
=
0.24
ε
/
b
| (15) |
The inequalities around the high-pressure triple point are as follows.
|
G
(
Solid
)
>
G
(
Liquid
)
>
G
(
High Density Solid
)
,
if
p
>
p
3
H
G
(
Solid
)
<
G
(
Liquid
)
<
G
(
High Density Solid
)
,
if
p
<
p
3
H
| (16) |
The vdW coefficients ε ( = a/b) and b can be determined
from the experimental critical temperature, Tc, and the critical pressure,
pc [4], using the following
equation and the resulting values are shown in Table
1.
|
T
c
=
8
27
ε
k
=
647
K
p
c
=
1
27
ε
b
=
22.1
MPa
| (17) |
Table 1.
The van der Waals coefficients
a(
= εb),
ε and
b.
| substance |
a/(Jm3) |
ε/J |
(ε/k)/K |
b/m3 |
(ε/b)/Pa |
| H2O |
1.53E-48 |
3.01E-20 |
2.18E+03 |
5.06E-29 |
5.96E+08 |
| O2 |
3.81E-49 |
7.20E-21 |
5.22E+02 |
5.29E-29 |
1.36E+08 |
| C3H8 |
2.59E-48 |
1.72E-20 |
1.25E+03 |
1.50E-28 |
1.15E+08 |
| Li |
1.17E-47 |
1.50E-19 |
1.09E+04 |
7.78E-29 |
1.86E+09 |
The calculated phase diagram is compared with the experimental data [3,4,5] in Figure 8, where it is evident that
the calculated melting temperature is suitably close to the observed value. Although the
estimated triple point pressure is not as low as the experimental value, the overall
features of the calculated phase diagram are similar to those of the experimental diagram,
even when using simple vdW equations of state.
The liquid-gas-phase boundary shown in Figure 6
was obtained using the same procedure reported in a previous paper (see Figure 6 in ref.1). This
crossing point was determined using only the original vdW equations of state, and so
included a reduced vapor pressure curve which is a universal function of the reduced
temperature in the vdW model. This function is referred to as
Pv, and is plotted in Figure
9. The right hand end of this curve provides the critical point
(Tc, pc).
|
p
v
a
p
o
r
ε
b
=
P
v
(
T
ε
k
)
| (18) |
3 OXYGEN
The following set of equations of state was assumed for the pressure, p,
and the internal energy, U, of the oxygen system.
|
p
L
ε
b
=
k
T
ε
1
V
N
b
−
1
−
(
N
b
V
)
2
, (O
2
- liquid)
| (19) |
|
U
L
N
=
2.5
k
T
−
ε
b
N
V
+
2.5
k
T
−
1.5
ε
,
(
O
2
−
liquid
)
| (20) |
|
p
S
ε
b
=
k
T
ε
1
V
N
b
−
0.9
−
2.5
(
N
b
V
)
2
, (O
2
- solid)
| (21) |
|
U
S
N
=
2.5
k
T
−
2.5
ε
b
N
V
+
2.5
k
T
−
1.5
ε
+
1.65
ε
(
adjustable
)
, (O
2
- solid)
| (22) |
The G/N vs. p plot at the triple point temperature,
T3 = 0.1 ε/k, is provided in Figure
10. This Figure demonstrates the following inequality regarding the second gas
(Gas2) branch, which appears at the low-density limit of the solid-gas equation of
state.
|
G
(
Gas
2
)
>
G
(
G
a
s
)
| (23) |
The vdW coefficients ε ( = a/b) and b are determined from
the experimental critical temperature, Tc, and the critical pressure,
pc [4], as shown below. The values
of ε and b are presented in Table 1.
|
T
c
=
8
27
ε
k
=
154.5
K
p
c
=
1
27
ε
b
=
5.043
MPa
| (24) |
The calculated phase diagram for oxygen is provided in Figure 11 in (p, T) space. The experimental phase diagram
exhibits many solid structures; however, the fine structure is not clear in the log-scale
plot in Figure 11. The experimental sublimation
pressure is very low. Despite this, the calculated phase diagram is seen to be generally
similar to the experimental diagram.
The sublimation pressure is close to the curve obtained by extrapolation of the vapor
pressure curve. This is because the sublimation pressure is determined from the point at
which the solid and gas branches cross, as shown in Figure 12. The liquid branch is seen to be almost parallel to the solid branch,
while the gas branch has a larger tangent than the liquid and the solid ones. For this
reason, the crossing pressure values are relatively similar, such that the extended vapor
pressure is very close to the sublimation pressure.
4 PROPANE
Propane has a low triple point temperature relative to the critical temperature of
hydrocarbons (Figure 1). The propane case is shown
below:
|
T
3
T
c
=
85
K
369.9
K
=
0.23
| (25) |
For this reason, the propane phase diagram was examined in this study.
The following set of equations of state was assumed for the pressure, p,
and the internal energy, U, of the propane system. The characteristic terms
in this set are the energy parameter, 4εb, and the size parameter,
0.8b, in the solid equation of state, which differ from the terms in the
argon equation of state [1].
|
p
L
ε
b
=
k
T
ε
1
V
N
b
−
1
−
(
N
b
V
)
2
, (propane - Liquid)
| (26) |
|
U
L
N
=
3
k
T
−
ε
b
N
V
+
3
k
T
−
1.5
ε
,
(
propane
−
liquid
)
| (27) |
|
p
S
ε
b
=
k
T
ε
1
V
N
b
−
0.8
−
4
(
N
b
V
)
2
, (propane - solid)
| (28) |
|
U
S
N
=
3
k
T
−
4
ε
b
N
V
+
3
k
T
−
1.5
ε
+
3.88
ε
(
adjustable
)
, (propane - solid)
| (29) |
The G/N vs. p plot at the triple point temperature
T3 = 0.06 ε/k is shown in Figure
13, from which it is evident that the relative triple point temperature is lower
than those of argon [1], water (Figure 6) and oxygen (Figure
10). The calculated relative value of propane is shown below:
|
T
3
T
c
=
0.06
ε
/k
0.296
ε
/k
=
0.20
| (30) |
The van der Waals coefficients ε = (a/b) and b can be
obtained using the experimental critical temperature, Tc, and the critical
pressure, pc, as below [4]. The
values of ε and b are shown in Table 1.
|
T
c
=
8
27
ε
k
=
369.9
K
p
c
=
1
27
ε
b
=
4.25
MPa
| (31) |
The calculated phase diagram for propane is shown in Figure 14, compared with the experimental results [10,11]. The calculated p3
is small but not as low as the experimental value [4],
as shown below.
|
p
3
p
c
=
5.8
×
10
−
8
ε
/
b
0.0370
ε
/
b
=
1.6
×
10
−
6
,
(cal)
| (32) |
|
p
3
p
c
=
1.63
×
10
−
10
ε
/
b
0.0370
ε
/
b
=
4.4
×
10
−
9
,
(exp)
| (33) |
Although the present theoretical work is based on very simple vdW equations of state, the
calculated phase diagram generally matches the main features of the experimental
version.
5 LITHIUM
Lithium has the lowest normalized triple point temperature in Figure 1, although the critical values are estimated from
experimental data [12], as below.
|
T
3
T
c
=
454
K
3223
K
=
0.14
| (34) |
The triple point temperature was estimated based on the melting point [6].
The following set of equations of state was assumed for the pressure, p,
and the internal energy, U, of the lithium system. Because lithium atoms
are spherical, the same equations of state as were formerly employed for argon were used as
a starting point.
|
p
L
ε
b
=
k
T
ε
1
V
N
b
−
1
−
(
N
b
V
)
2
, (lithium - liquid)
| (35) |
|
U
L
N
=
1.5
k
T
−
ε
b
N
V
+
1.6
k
T
−
1.5
ε
,
(
lithium
−
liquid
)
| (36) |
|
p
S
ε
b
=
k
T
ε
1
V
N
b
−
0.9
−
2
(
N
b
V
)
2
, (lithium - solid)
| (37) |
|
U
S
N
=
1.5
k
T
−
2
ε
b
N
V
+
1.5
k
T
−
1.5
ε
+
1.20
ε
(
adjustable
)
, (lithium - solid)
| (38) |
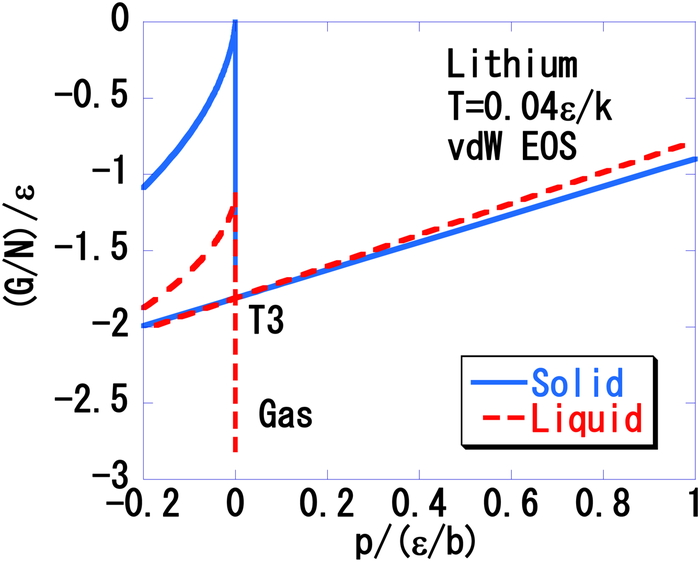
Figure 15 presents the G/N vs.
p plot at the triple point temperature T3 = 0.04 ε/k.
Here, the triple point temperature is lower than those determined for argon [1], water (Figure
6), oxygen (Figure 10) and propane (Figure 13). The following inequalities are evident
from this Figure.
|
G
(
L
i
q
u
i
d
)
N
>
G
(
S
o
l
i
d
)
N
,
for
p
>
p
3
| (39) |
|
G
(
S
o
l
i
d
)
N
>
G
(
L
i
q
u
i
d
)
N
>
G
(
G
a
s
)
N
,
for
p
<
p
3
| (40) |
|
p
3
=
1.3
×
10
−
11
ε/b
| (41) |
The van der Waals coefficients ε ( = a/b) and b were
determined from the experimental critical temperature, Tc, and the critical
pressure, pc [4], as below. The
values of ε and b are shown in Table 1.
|
T
c
=
8
27
ε
k
=
3223
K
p
c
=
1
27
ε
b
=
68.9
MPa
| (42) |
The calculated phase diagram for lithium is provided in Figure 16. These values are also compared with experimental results [4,6,11,12,13]. The high-pressure region (P > 1
GPa) was not an aspect of the current work [14] but,
outside this region, the main features of the experimental phase diagram are well reproduced
by the calculations using simple vdW equations of state.
The calculated normalized triple point temperature and pressure are compared with the
experimental values in Table 2. There is a good
concordance in the case of the triple point temperature, although the agreement is only
qualitative in the case of the triple point pressure. The reason for this outcome can be
seen in Figure 9, which plots a universal function
in vdW equations of state.
Table 2.
The normalized triple point temperature and pressure values determined by vdW
equations of state compared with the experimental data [
3,
4,
5,
6,
7,
8,
9,
10,
11,
12,
13].
| substance |
T3/Tc |
p3/pc |
| vdW |
exp |
vdW |
exp |
| Ar [1] |
0.47 |
0.582 |
0.02 |
0.0142 |
| H2O |
0.42 |
0.422 |
8.E-03 |
2.8E-05 |
| O2 |
0.34 |
0.352 |
1.E-03 |
4.E-05 |
| C3H6 |
0.20 |
0.230 |
2.E-06 |
4.E-11 |
| Li |
0.135 |
0.141 |
4.E-10 |
3.E-16 |
Examples of the Microsoft Excel worksheets used to calculate the phase transition
boundaries are provided in the electronic Appendix to this paper.
6 CONCLUSION
The phase diagrams of water, oxygen, propane and lithium were obtained by thermodynamics
calculations using the van der Waals equations of state. The new development in this work is
the introduction of a solid-gas equation of state with the same functional form as that for
the liquid-gas system. The gas, liquid and solid phases are treated uniformly in the
calculation of the thermodynamic properties. The universality of this EOS was confirmed in a
wide range of chemical substances.
Acknowledgment
The author would like to thank Prof. Hironori Ogata for valuable discussions. The author
also wishes to acknowledge the Research Center for Computing and Multimedia Studies at Hosei
University for providing computing resources.
REFERENCES
- [1] Y. Kataoka, J. Comput. Chem.
Jpn., (accepted).
- [2] P. W. Atkins, Physical
Chemistry, Oxford Univ. Press, Oxford (1998).
- [3] N. H. Fletcher, “The Chemical
Physics of Ice”, Cambridge University Press, (1970).
- [4] NIST Chemistry WebBook,
http://webbook.nist.gov/chemistry/.
- [5] IAPWS R14–08(2011):
http://www.iapws.org/relguide/MeltSub.html “Revised Release on the Pressure along the
Melting and Sublimation Curves of Ordinary Water Substance.
- [6] D. R. Lide, (Ed), CRC Handbook
of Chemistry and Physics, 84th Edition, CRC Press. Boca Raton, Florida,
(2003).
- [7] J. H. C. Lisman and W. H.
Keesom, Physica 2, 901 (1935) O2.
- [8] D. A. Young, “Phase diagram of
elements”, Univ. California Press, Berkeley (1991) O2.
- [9] J. E. Ahern, T. W. Lawson,
http://www.dtic.mil/dtic/tr/fulltext/u2/687852.pdf O2.
- [10] L. E. Reeves, G. J. Scott,
and S. E. Babb, Jr., J. Chem. Phys., 40, 3662 (1964) C2H8.
- [11] K. D. Timmerhaus. Ed., “Advances
in Cryogenic Engineering”, vol. 23 Plenum Press (1964) C2H8.
- [12] I. G. Dillon, P. A. Nelson,
B. S. Swanson, J. Chem. Phys., 44, 4229 (1966), Li. doi:10.1063/1.1726611
- [13] P. W. Bridgman, Proc. Am.
Acad. Arts Sci., 56, 61 (1921), Li. doi:10.2307/20025836
- [14] C. L. Guillaume, E.
Gregoryanz, O. Degtyareva, M. I. McMahon, M. Hanfland, S. Evans, M. Guthrie, S. V.
Sinogeikin, H.-K. Mao, Nat. Phys., 7, 211 (2011), Li.
doi:10.1038/nphys1864