Abstract
An existing van der Waals (vdW) equation of state (EOS) based on hard-sphere repulsions
during intermolecular interactions was extended to a Lennard-Jones (LJ) system.
Specifically, an EOS for a perfect solid and liquid v5 (Y. Kataoka and Y. Yamada,
J. Comput. Chem. Jpn.,12, 181–189 (2013)) was simplified
to satisfy the Rigby conditions for a generalized vdW EOS. The phase diagram of argon was
reproduced in pressure-temperature space using this extended EOS, and a phase diagram in
temperature-density space was also generated and found to be qualitatively consistent with
the LJ system.
1 INTRODUCTION
Molecular liquids and solids are typically considered as Lennard-Jones (LJ) systems [1,2] and are often
modeled using molecular dynamics (MD) and Monte Carlo simulations [3,4,5,6]. Molecular simulations such as these
can provide many of the physical properties for a given local state [3,4]. However, global thermodynamic
properties are determined using an equation of state (EOS). For this reason, simulation
results are usually summarized by a complex EOS involving numerous coefficients [7,8], although our
own group has previously reported simpler EOS’s [9,10,11,12,13,14,15] based on MD simulations.
The van der Waals (vdW) EOS is one of the simplest that may be used to describe a
liquid-gas-phase transition. In prior work, a vdW EOS and a new solid-gas2 vdW EOS were
derived for the solid-liquid-vapor phase transition [16]. The resulting phase diagram in p-T space was found to be
qualitatively similar to the results obtained from simulations and free energy calculations
[16]. However, the phase diagram in
T-density space exhibited a solid-liquid phase boundary for which the
tangent was not in agreement with the results of free energy calculations [17]. This inconsistency was attributed to the hard core
repulsion included in the vdW EOS.
In the present work, the vdW EOS was extended to a LJ system in association with a
continuous interaction function. The LJ potential (u (r)) may be expressed
as a function of the interatomic distance (r) using the
equation
|
u
(
r
)
=
4
ε
[
(
σ
r
)
12
−
(
σ
r
)
6
]
| (1) |
where
ε is the depth of the
potential well and
σ is the separation at which
u (σ) = 0.
ε and
σ are in units of energy and length,
respectively.
This work begins with our simple EOS for a LJ system [14], based on MD simulations, following which the vdW EOS is extended to obtain a
generalized vdW EOS [18]. The resulting phase
diagrams in p-T space and T-density space are subsequently
compared with the results of experimental studies on argon [19,20,21], simulations [22,23,24,25,26,27] and free energy calculations [16,28].
2 EXTENSION OF THE VAN DER WAALSEQUATION OF STATE
The temperature and density dependence of the internal energy and pressure were determined
by MD simulations involving a LJ system and the super-cooled liquid state was also examined
[14]. The sum of the average kinetic and potential
energies at 0 K and the temperature-dependent potential energy was employed as the internal
energy term in the EOS, while the temperature-dependent average potential energy term was
assumed to be a linear function of the temperature and its coefficient was expressed as a
polynomial function of the number density. The pressure was expressed in a similar manner,
such that it satisfied the thermodynamic EOS. Using this approach, the phase equilibrium
conditions for argon were determined numerically. The Gibbs energy value thus calculated
provides a reasonable transition pressure for argon’s three-phase equilibrium state [14]. The resulting EOS is that for a perfect solid and
liquid v5 [14] and is shown below.
|
U
(
V
,
T
)
=
3
2
N
k
T
+
U
e
(
V
,
0
K
)
+
g
(
V
)
N
k
T
| (2) |
|
p
=
N
k
T
V
−
(
∂
U
e
(
V
,
0
K
)
∂
V
)
T
+
f
(
V
)
N
k
T
+
(
d
g
(
V
)
d
V
)
N
k
T
ln
(
k
T
)
| (3) |
Here, U is the internal energy, p is the pressure,
T is the temperature, k is the Boltzmann constant, and
N is the number of particles. The terms
U
e
(
V
,
0
K
)
,
g
(
V
)
and
f
(
V
)
are functions of volume and ln () signifies the natural
logarithmic function. The last term in equation (2) is included to satisfy the thermodynamic
EOS [1].
The generalized vdW EOS derived by Rigby is written as follows.
|
p
=
N
k
T
V
β
(
ρ
)
−
α
(
ρ
)
| (4) |
Here, α(ρ) and β(ρ) are functions of the number density
but do not depend on temperature, and the volume dependent term in g(V) in
equations (2) and (3) is neglected to satisfy the Rigby conditions. For simplicity, the
higher order terms in f(V) are also neglected. Thus the extended vdW EOS’s
for a LJ system (vdW-LJ) are as below.
|
p
f
(
V
,
T
)
=
N
k
T
V
+
ϕ
N
k
T
V
(
4.8
σ
3
v
)
−
∂
U
e
,
f
(
V
,
0
K
)
∂
v
| (liquid) (5) |
|
U
f
(
V
,
T
)
=
3
N
k
T
+
U
e
,
f
(
V
,
0
K
)
| (liquid) (6) |
|
U
e
,f
(
V
,
0
K
)
N
ε
=
(
1.5
σ
18
v
6
−
9
σ
3
v
)
| (liquid) (7) |
|
p
s
(
V
,
T
)
=
N
k
T
V
+
γ
N
k
T
V
(
6
σ
3
v
)
−
∂
U
e
,
s
(
V
,
0
K
)
∂
v
| (solid) (8) |
|
U
s
(
V
,
T
)
=
3
N
k
T
+
U
e
,
s
(
V
,
0
K
)
| (solid) (9) |
|
U
e
,s
(
V
,
0
K
)
N
ε
=
6
(
1
+
1
128
)
σ
12
v
4
−
12
(
1
+
1
5
)
σ
6
v
2
| (solid) (10) |
Here, the temperature-dependent part of the average of the potential energy of the system
is assumed to be (3/2)NkT based on the harmonic oscillator approximation,
and ϕ and γ are adjustable parameters with values of
approximately 1.
3 THERMODYNAMIC QUANTITIES
The entropy change for reversible isothermal expansion and heating at constant volume to
the next change of state was calculated based on the first law of thermodynamics, as in the
equations below [1].
|
Δ
S
≡
S
(
V
f
,
T
i
)
−
S
(
V
i
,
T
i
)
=
N
k
ln
(
V
f
V
i
)
+
(
F
(
V
f
)
−
F
(
V
i
)
)
N
k
+
3
N
k
ln
(
T
f
T
i
)
F
(
v
)
≡
∫
f
(
v
)
d
v
| (12) |
Here, the initial state is as shown in the following equations.
|
T
i
=
ε
k
,
V
i
=
N
v
max
| (13) |
|
S
0
≡
S
i
=
N
k
ln
(
N
v
max
)
+
F
(
N
v
max
)
N
k
+
3
N
k
ln
(
ε
k
)
| (14) |
The volume (vmax) term in these equations is sufficiently large
compared to the unit volume, σ3, and the temperature is expressed in units of
ε/k. The function F(V) is assumed to have a value of zero in the initial
state (see equations (3), (5) and (8)) and, as a result, the entropy change has the
following form.
|
Δ
S
(
N
v
,
T
)
≡
S
(
N
v
,
T
)
−
S
0
=
N
k
ln
(
v
σ
3
)
+
F
(
v
)
N
k
+
3
N
k
ln
(
k
T
ε
)
| (15) |
Hereafter, the entropy change from this S0 value is expressed
simply as the entropy, S.
The other thermodynamic quantities were obtained using standard procedures [1]. The critical temperature was adjusted based on the MD
results as [25]
, while assigning
.
The critical constants were obtained by solving the following equation.
|
(
∂
p
∂
V
)
T
=
(
∂
2
p
∂
V
2
)
T
=
0
| (18) |
The critical constants derived in this manner are compared with the simulation results in
Table 1, from which it is evident that the
present results are similar to those obtained using a perfect EOS for a liquid and solid v8
[15]. These calculated critical constants are
reasonable because of the simplicity of the present model.
Table 1.
The critical LJ system constants as determined using various EOS's and MD
simulations.
|
Tc/(ε/k) |
pc/(ε/σ3) |
Vc/σ3 |
| This work |
1.321 |
0.227 |
2.49 |
| EOS v8 [15] |
1.321 |
0.219 |
2.57 |
| EOS [7] |
1.313 |
0.13 |
3.22 |
| EOS [8] |
1.340 |
0.141 |
3.22 |
| MD [26] |
1.321 |
0.129 |
3.16 |
4 PHASE EQUILIBRIUM IN P–T SPACE
The conditions at the equilibrium between phases 1 and 2 in p-T space can
be expressed as in equation (17).
|
p
1
(
V
1
,
T
)
=
p
2
(
V
2
,
T
)
,
G
1
(
V
1
,
T
)
N
1
=
G
2
(
V
2
,
T
)
N
2
| (19) |
A vdW-LJ EOS is a function of volume and temperature; therefore, equation (17) can be
solved numerically [10], and the
(G/N)p graphs for both branches were
plotted using the volume per particle as an auxiliary variable as shown in Figure 1. The electronic appendix to this paper
provides some example worksheets for such calculations.
The (G/N)p plots in the case of the
triple point are shown in Figure 1. In this
Figure, the adjustable parameter, γ, was assigned as
, and the triple point temperature,
T3, was adjusted based on the free energy calculation results to be
[
17]
.
In order to compare the calculated phase diagram in p-T space with that of
argon experimentally obtained, the potential parameters ε and
σ were selected based on the following two equations.
|
T
c
=
1.321
ε
/
k
=
150.72
K
| (22) |
|
p
c
=
0.227
ε
/
σ
3
=
4.86
MPa
| (23) |
The potential parameters are shown in Table 2,
while the phase diagram in p-T space is presented in Figure 2. The agreement is seen to be satisfactory because of the
simplicity of the present EOS. In fact, the calculated melting curve is very close to the
experimental data [20,21], and also in good agreement with the results of free energy calculations
[17]. The vapor pressure curve generated using the
vdW-LJ EOS is also consistent with that previously reported, based on the EOS [8]. Finally, the present sublimation pressure obtained
from the vdW-LJ EOS is in good agreement with that obtained from the free energy
calculations [17]
Table 2.
The LJ potential parameters for argon.
| ε/J |
(ε/k)/K |
ε/m |
(ε/σ3)/MPa |
| 1.58E-21 |
114.1 |
4.19E-10 |
21.4 |
Table 3 compares the critical constants. In the
case of the critical volume, the relative error is 46%, which is attributed to the error in
equation (23). The critical pressure, expressed in units of ε/σ3, also exhibits a
significant relative error of 76% compared to the MD result. This error indicates a
presently unidentified shortcoming of our simplified EOS.
Table 3.
A comparison of the calculated critical constants with experimental data.
|
Tc/K |
pc/MPa |
Vc(cm3/mol) |
| This work |
150.72 |
4.86 |
110 |
| vdW [16] |
150.72 |
4.86 |
97 |
| exp [21] |
150.72 |
4.86 |
75.25 |
The calculated triple point values are compared with the experimental data in Table 4. As noted, the triple point temperature was
adjusted based on the free energy calculation results. However, our value was still lower
than the experimental T3. For this reason, the calculated
p3 is also lower than the experimental value. The large error in the
molar volume at the triple point (V3f) may result from the error in
equation (23), as discussed in relation to Vc.
Table 4.
A comparison of the calculated triple point values with experimental data. The
molar volume of the liquid at
T3 is given here in the form of
V3f.
|
T3/K |
p3/MPa |
V3f(cm3/mol) |
| This work |
79.0 |
0.015 |
51 |
| vdW [16] |
70.0 |
0.087 |
39 |
| exp [21] |
83.8 |
0.06893 |
28.2 |
The configurational entropy values are compared with the results of free energy
calculations [17] in Figure 3. The configurational entropy, Sc, is the
entropy other than the contribution of the kinetic energy and is obtained from the following
equation.
|
S
c
=
S
+
3
2
N
k
T
ln
(
T
/
(
ε
/
k
)
)
| (24) |
The absolute value has no meaning when comparing configurational entropy values because the
entropy origin is not always the same in the two methods (that is, when using the vdW-LJ EOS
or MC and MD simulations). Therefore, only the temperature dependence of Sc
is compared herein. At the gas-liquid phase boundary, Sc changes rapidly
while, in contrast, the change in Sc as a function of temperature along the
liquid-solid phase boundary is minimal. Figure 3
also demonstrates that the calculated values are consistent with the results of the free
energy calculations [17].
The values for the average of the potential energy, Ue, at the
phase boundary are compared with data from Refs [8,17]. in Figure 4. Along the gas-liquid phase boundary, the calculated values
are consistent with the reported values [8], although
the tangents at the liquid-solid phase boundary are overly steep in comparison with the
results of free energy calculations [17]. This
divergence is attributed to over-simplification in the pressure EOS (the second term on the
right-hand side of equations (5) and (8)). An analysis of the MD results produced two higher
order terms [14] but, these are neglected in the
present work for the sake of simplicity.
5 PHASE EQUILIBRIUM IN T–N/V SPACE
Figure 5 shows the temperature–number density
phase boundaries determined using the vdW-LJ EOS along with a comparison of the calculated
results [8,17].
This Figure shows the densities of the equilibrated phases on the phase boundary plotted in
Figure 2 as functions of temperature. At
temperatures below Tc, the calculated phase boundaries are in reasonably
good agreement. However, the liquid-solid transition boundaries exhibit a systematic
deviation from those of the LJ system obtained from free energy calculations [17]. As noted when discussing Figure 4, this lack of coincidence may result from the
over-simplification of the pressure EOS in equations (5) and (8), in which the higher order
terms were neglected.
However, Figure 5 is qualitatively consistent
with the LJ results, in contrast to the case of a simple vdW EOS incorporating hard core
repulsion [16].
6 THERMODYNAMIC PROPERTIES ATCONSTANT TEMPERATURE
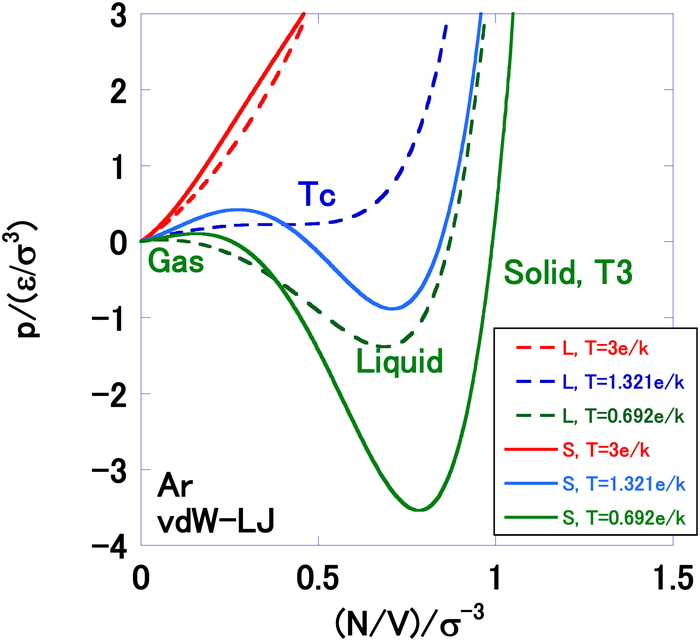
Pressure is plotted as a function of number density in Figure 6, in which the results from the liquid-gas EOS and solid-gas2 EOS are
compared at several temperatures. This Figure displays the so-called vdW loop. Figure 7 plots the internal energy against the number
density at 0 K because the density dependence of the liquid and solid is the same at 0 K in
the present model (see equations (6) and (9)). The minimum values of
U
e
,f
(
V
,
0
K
)
/
N
ε
and
U
e
,s
(
V
,
0
K
)
/
N
ε
are summarized in Table
5, and the entropy, S, is plotted as a function of number density
at T = 0.692 ε/k in Figure 8.
This Figure demonstrates that S becomes very large when approaching the low
density limit, as predicted by equation (13).
Table 5.
The minimum values of
Ue.f and
Ue,s.
| v/σ3 |
Ue,f
(V,0 K)/Nε |
v/σ3 |
sU(V,0 K)/Nε |
| 1 |
−7.5 |
0.9164 |
−8.573 |
The Gibbs energy is plotted as function of number density at T = 0.692 ε/k
in Figure 9, from which it can be seen that the
Gibbs energy falls to a very low value when approaching the low density limit. Comparing
Figures. 6 and 9, the crossing point labeled T3 in Figure
1 can be seen to be reasonable.
7 CONCLUSION
The vdW EOS was extended to a LJ system, and the EOS for a perfect solid and liquid v5
[14] was simplified to satisfy Rigby’s condition
for a generalized vdW EOS. In this manner, the phase diagram of argon was reproduced in
p-T space, and the phase diagram in T-N/V space was
found to be qualitatively consistent with the LJ system.
Acknowledgment
The author would like to thank Prof. Hironori Ogata for valuable discussions and to
gratefully acknowledge the Research Center for Computing and Multimedia Studies at Hosei
University for the use of computer resources.
REFERENCES
- [1] P. W. Atkins, Physical
Chemistry, Oxford Univ. Press, Oxford (1998).
- [2] D. A. McQuarrie, Statistical
Mechanics, Harper Collins (1976).
- [3] M. P. Allen, D. J. Tildesley,
Computer Simulation of Liquids, Clarendon Press, Oxford (1992).
- [4] R. J. Sadus, Molecular
Simulation of Fluids: Theory, Algorithms and Objective-Orientation, Elsevier, Amsterdam
(1999).
- [5] Y. Kataoka, Y. Yamada, J.
Comput. Chem. Jpn., 13, 115 (2014). doi:10.2477/jccj.2013-0023
- [6] Y. Kataoka, Y. Yamada, J.
Comput. Chem. Jpn., 13, 257 (2014). doi:10.2477/jccj.2014-0016
- [7] J. K. Johnson, J. A.
Zollweg, K. E. Gubbins, Mol. Phys., 78, 591 (1993).
doi:10.1080/00268979300100411
- [8] J. Kolafa, I. Nezbeda, Fluid
Phase Equilib., 100, 1 (1994). doi:10.1016/0378-3812(94)80001-4
- [9] Y. Kataoka, Y. Yamada, J.
Comput. Chem. Jpn., 10, 98 (2011). doi:10.2477/jccj.H2308
- [10] Y. Kataoka, Y. Yamada, J.
Comput. Chem. Jpn., 11, 81 (2012). doi:10.2477/jccj.2011-0030
- [11] Y. Kataoka, Y. Yamada, J.
Comput. Chem. Jpn., 11, 165 (2012). doi:10.2477/jccj.2012-0006
- [12] Y. Kataoka, Y. Yamada, J.
Comput. Chem. Jpn., 11, 174 (2012). doi:10.2477/jccj.2012-0009
- [13] Y. Kataoka, Y. Yamada, J.
Comput. Chem. Jpn., 12, 101 (2013). doi:10.2477/jccj.2012-0027
- [14] Y. Kataoka, Y. Yamada, J.
Comput. Chem. Jpn., 12, 181 (2013). doi:10.2477/jccj.2013-0007
- [15] Y. Kataoka, Y. Yamada, J.
Comput. Chem. Jpn., 13, 130 (2014). doi:10.2477/jccj.2014-0002
- [16] Y. Kataoka, J. Comput. Chem.
Jpn., submitted.
- [17] M. A. Barroso, A. L.
Ferreira, J. Chem. Phys., 116, 7145 (2002). doi:10.1063/1.1464828
- [18] M. Rigby, Q. Rev. Chem.
Soc., 24, 416 (1970). doi:10.1039/qr9702400416
- [19] K. Clusius, K. Weigand, Z.
Phys. Chem., B Chem. Elem. Proz. Aufbau Mater., 46, 1 (1940).
- [20] R. K. Crawford, W. B.
Daniels, Phys. Rev. Lett., 21, 367 (1968). doi:10.1103/PhysRevLett.21.367
- [21] CRC Handbook of Chemistry and
Physics. Ed., D. R. Lide, CRC press, Boca Raton (1995).
- [22] J. P. Hansen, L. Verlet,
Phys. Rev., 184, 151 (1969). doi:10.1103/PhysRev.184.151
- [23] D. A. Kofke, J. Chem. Phys.,
98, 4149 (1993). doi:10.1063/1.465023
- [24] R. Agrawal, D. A. Kofke,
Mol. Phys., 85, 43 (1995). doi:10.1080/00268979500100921
- [25] H. Okumura, F. Yonezawa, J.
Chem. Phys., 113, 9162 (2000). doi:10.1063/1.1320828
- [26] H. Okumura, F. Yonezawa, J.
Phys. Soc. Jpn., 70, 1990 (2001). doi:10.1143/JPSJ.70.1990
- [27] M. A. van der Hoef, J. Chem.
Phys., 117, 5092 (2002). doi:10.1063/1.1498462
- [28] A. Ahmed, R. J. Sadus, J.
Chem. Phys., 131, 174504 (2009). , doi:10.1063/1.325368619895022