Abstract
Children of school age spend a large part of their daily lives not only at home but also at school. The present study surveyed the possible health benefits of indoor plant intervention on the indoor environment for 15 students in 6 classrooms (4 classrooms with indoor plants and 2 classrooms without indoor plants) in 2 newly built elementary schools in Seoul, South Korea. Symptom degree of building-related illness was evaluated as sick school syndrome according to indoor plant placement. An observation of the air temperature of the classrooms for 3 months after indoor plant placement did not find a change in the classroom at School A but detect a decrease in the classroom at School B with or without indoor plants. Formaldehyde concentration in indoor air reduced with time spent in the classrooms at both schools, and was not affected by indoor plant placement. After 3 months, volatile organic compounds showed high concentrations in the classrooms without indoor plants but demonstrated low concentrations in the classrooms with indoor plants only at School B. In the comparison of the symptom score, there was a constant decrease in the classroom with indoor plants but not in the classroom without indoor plants. However, multiple regression analysis showed that the subjective symptom degree of sick school syndrome had little relation to indoor plants.
Introduction
In modern society, people spend most of their time indoors (Lim et al., 2006), and therefore the physical indoor environment and indoor air quality have become crucial for their health. The living environment of most people chiefly relies on indoor rather than outdoor factors, so the indoor environment has become one of the most important limiting factors for the well-being of ordinary people.
There have been frequent reports that indoor residents suffer from diseases related to indoor environment, sick building syndrome (SBS), or sick school syndrome (SSS) (Kang et al., 2008; Selter, 1994; Smedje and Norback, 2001; Smedje et al., 1997) in spite of some controversy (Braun-Fahrlander, 2003; Zhao et al., 2008). The terms SBS and SSS were developed in the 1970s and 1980s and were issued in the late 1990s (Kang et al., 2008; Takigawa et al., 2012).
According to earlier studies, people’s living environments contain various air pollutants with a higher concentration indoors than outdoors (Adgate et al., 2004). The most widespread substances as indoor air pollutants are formaldehyde and other volatile organic compounds such as benzene, toluene, ethylbenzene, and xylene (BTEX) (Jurvelin et al., 2001; Kim et al., 2010). The particles of indoor air pollutants were found to be emitted from indoor objects such as building materials, desks and chairs, bookshelves, and other dust-collecting materials (Diez et al., 2000; Farrow et al., 1997). The exposure of school-aged children to formaldehyde and BTEX was reported to cause symptoms of SBS at home and SSS in the classroom (Erdei et al., 2003; Garrett et al., 1999; Hodgson et al., 1994; Jaakkola et al., 2004; Kang et al., 2008; Krzyzanowski et al., 1990; Rumchev et al., 2002; Wantke et al., 1996).
It was reported that the symptom degree of SBS was worsened by other types of indoor air pollutants, such as pesticide residue, nitrogen dioxide, sulfur dioxide, ozone, environmental tobacco smoke, and other biological pollutants (National Institute of Medicine, 2000). Other researchers also noted that exposure to indoor air pollutants could cause irritation of the eyes, nose, and upper respiratory system (Bardana and Montanaro, 1991) and then would bring about asthma and airway inflammation (Franklin, 2000).
Recently, SBS has become one of the most serious allergic diseases for most people (Daisey et al., 2003). For that reason, people have begun increasingly to pay to control their indoor environment. Studies have found that plants have the function of improving air quality (Bourbeau et al., 1997; Fjeld et al., 1998; Kim et al., 2011; Lim et al., 2009; Lohr, 1992; Pearson, 1994) as well as having aesthetic effects (Bringslimark et al., 2009; Hartig et al., 2003; Kaplan, 2001; Lohr and Pearson-Mims, 2000). Moreover, children in the growing phase are more sensitive to environmental factors than adults (Lu et al., 2001; Sheets, 2000). Therefore, the present study was performed to evaluate if indoor plant intervention could improve indoor air quality in a classroom of a newly built elementary school. Additionally, we wanted to see if the intervention affected the self-reported health complaints related to indoor air quality.
Materials and Methods
Measurement site setting and participant arrangement
The symptom degree of SSS was evaluated for 6th grade students in 6 classrooms of 2 newly built elementary schools (School A and B) established in 2011 in Seoul, South Korea. A convenient sample of 115 students participated in the present study.
School A had 46 students in 2 classroom with indoor plants (Group I) and 23 students in a classroom without indoor plants (Group II). School B had 31 students in 2 classrooms in Group I and 15 students in a classroom in Group II. All the classrooms were rectangular, 9 × 7.5 m in dimension. School A had classrooms with a window on one side with mechanical ventilation and School B had classrooms with a window on two sides with natural ventilation. The participants provided information on age, gender, type of housing, and their own and their family history of asthma and allergies at the beginning of this research (March, 2011) (Table 1).
Table 1.
Demographics of subject groups surveyed prior to indoor residence in March, 2011.
| Classification |
Character |
School A |
School B |
|
|
| Without plants |
With plants |
Without plants |
With plants |
| Individuality |
Number |
23 |
46 |
15 |
31 |
| Gender, M/F |
12/11 |
23/23 |
6/9 |
13/18 |
| Age, years |
11.90 ± 0.30 |
12.00 ± 0.27 |
11.79 ± 0.29 |
11.87 ± 0.30 |
| Passive smoking |
34.8% |
39.1% |
73.3% |
36.7% |
| Pet (animal) |
26.1% |
23.9% |
26.7% |
3.3% |
| Housing style |
APT 100% |
APT 100% |
APT 93.3% |
APT 96.7% |
|
| Family history of patient |
Atopic diseases |
21.7% |
23.9% |
0% |
20.0% |
| Allergic rhinitis |
34.8% |
21.7% |
26.7% |
46.7% |
| Allergic conjunctivitis |
0% |
0% |
0% |
6.7% |
| Asthma |
8.7% |
2.2% |
0% |
6.7% |
| Atopic dermatitis |
43.5% |
52.2% |
40.0% |
43.3% |
|
| Individual past history of patient |
Atopic diseases |
21.7% |
19.6% |
20.0% |
3.3% |
| Allergic rhinitis |
26.1% |
32.0% |
26.7% |
13.3% |
| Allergic conjunctivitis |
0% |
0% |
0% |
0% |
| Asthma |
4.3% |
2.2% |
0% |
3.3% |
| Atopic dermatitis |
47.8% |
47.8% |
40.0% |
20.0% |
Mean ± standard deviation.
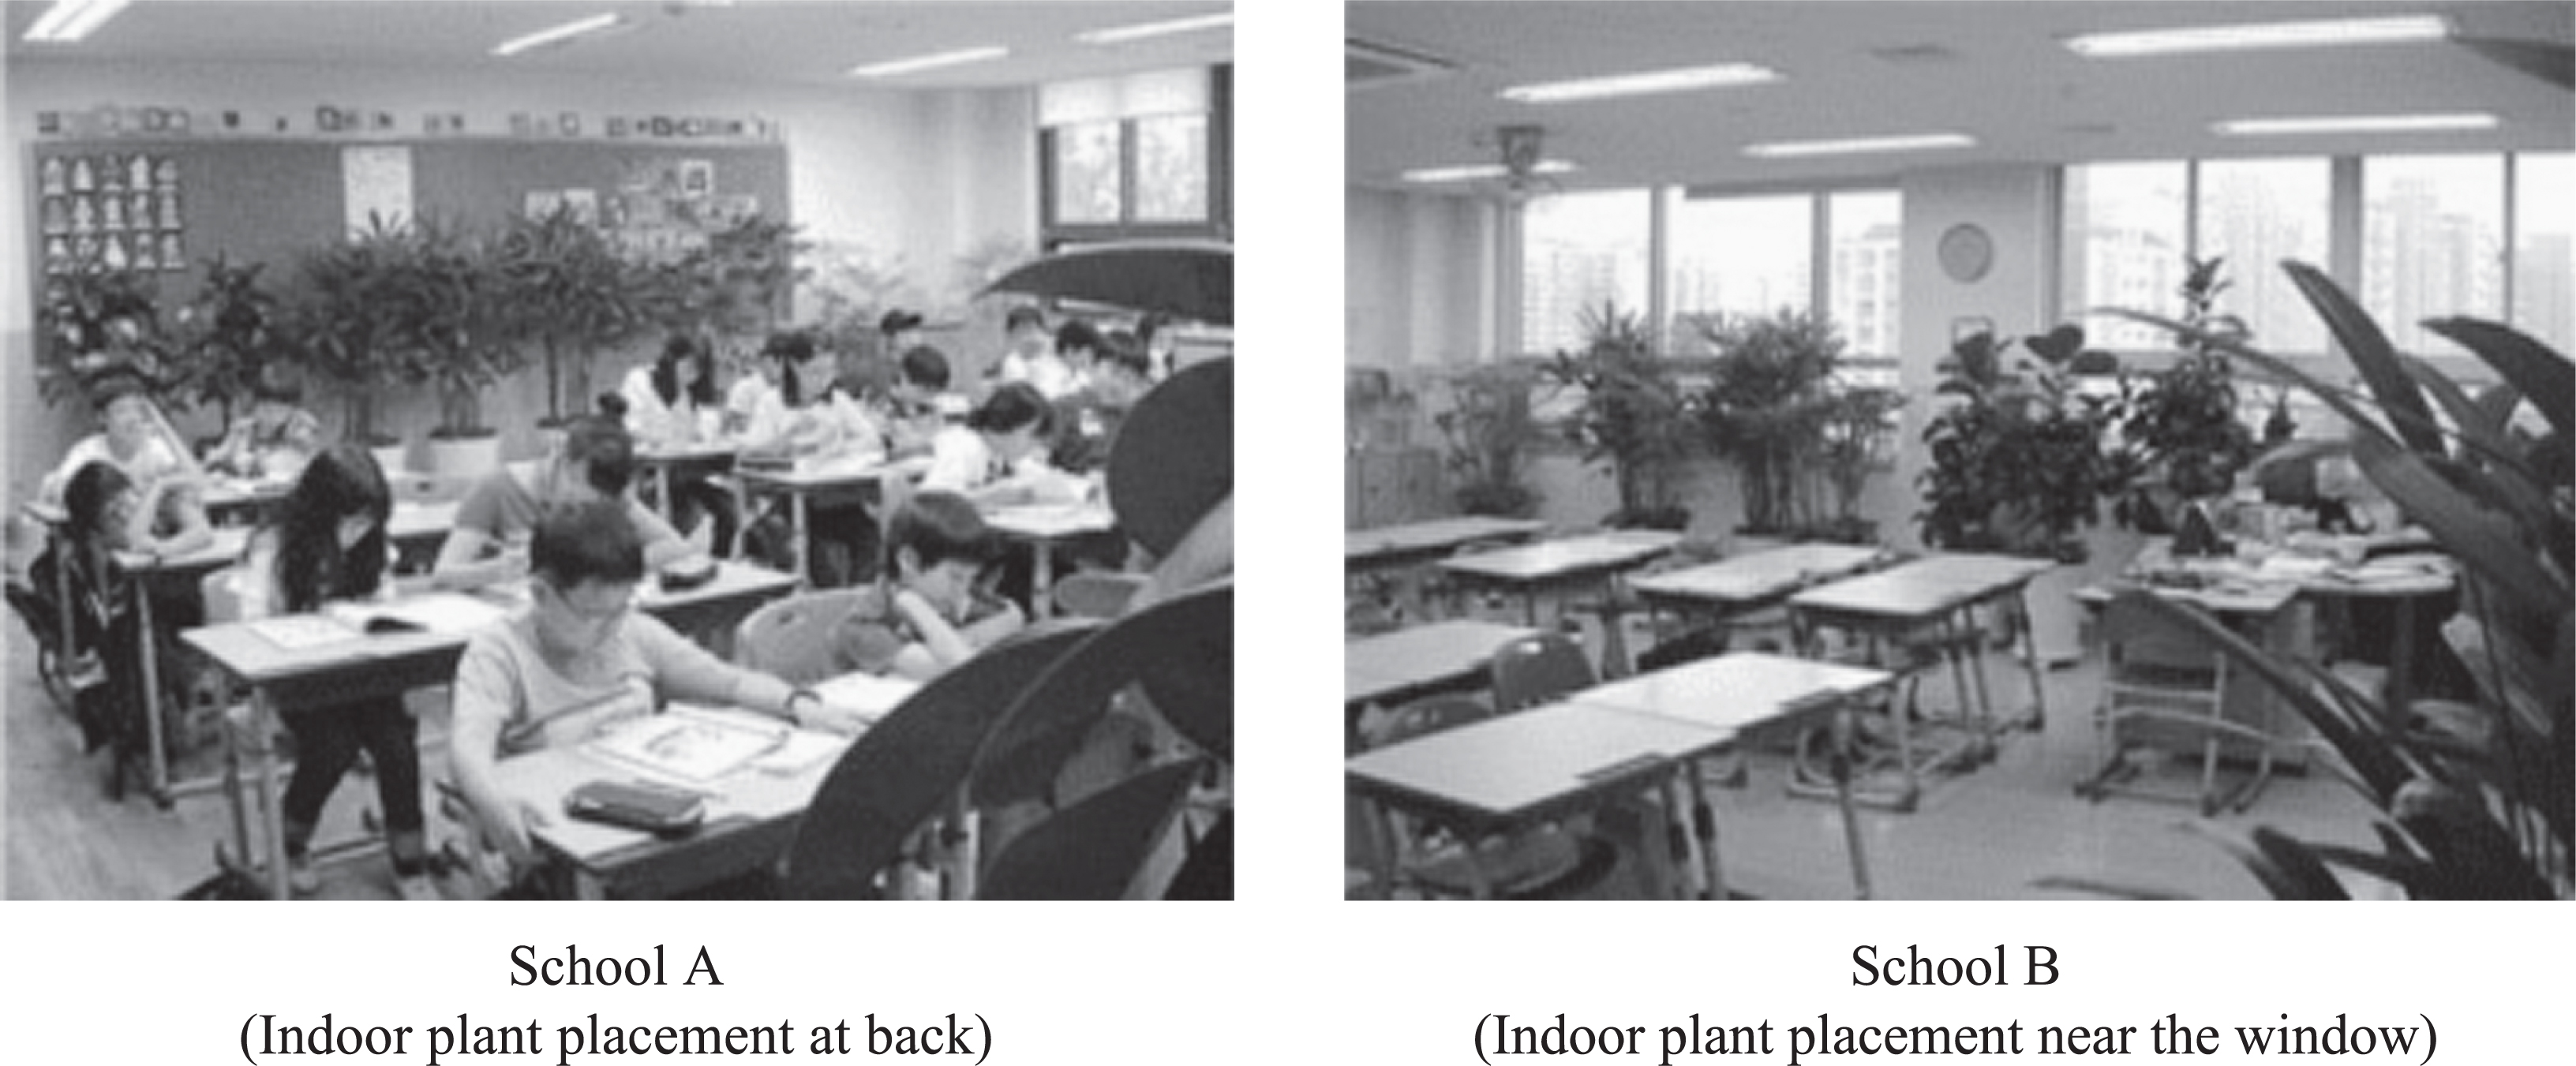
Indoor plants were placed in the classrooms of Group I at School A and B during the observation period from June 25th to September 27th, 2011. The Rural Development Administration in Korea recommended the plant selection (Table 2) and advised installing more than 1 large potted plant (a large plant) and 1 small potted plant (a small plant) per 6 m2 area in a classroom. The pot sizes of the large plants were Ø30 cm × 41 cm (h) (28.967 L) and Ø24 cm × 23.5 cm (h) (10.626 L) and that of small plants was Ø18 cm × 15 cm (h) (3.815 L). The number of installed plants is given in Table 2. Indoor plants were placed at the back of the classroom at School A and on the window side in the classroom at School B to fit the classroom layout, furnishings, and school activities (Fig. 1).
Table 2.
List of indoor plants in a classroom, installed in June and removed in October, 2011.
| Classification |
Common name |
Scientific name |
Size (Diameter × Height) |
Number |
| Large plant |
Lady palm |
Rhapis excelsa |
Ø30 cm × 41 cm |
3 |
| Rubber plant |
Ficus elastica co. robusta |
Ø30 cm × 41 cm |
3 |
| Heavenly bamboo |
Nandina domestica |
Ø24 cm × 23.5 cm |
2 |
| Fatsi, Japanese Aralia |
Fatsia japonica |
Ø24 cm × 23.5 cm |
2 |
|
| Small plants |
Angel’s tears |
Soleirolia soleirolii |
Ø18 cm × 15 cm |
3 |
| English ivy |
Hedera helix |
Ø18 cm × 15 cm |
3 |
| Tiny ardisia |
Ardisia psilla |
Ø18 cm × 15 cm |
2 |
| Golden pothos |
Epipremnum aureum |
Ø18 cm × 15 cm |
2 |
The present study observed the indoor thermal conditions and measured the indoor concentrations of carbon dioxide, formaldehyde, and BTEX twice during the experimental period for all the selected classrooms. The first observation was performed just prior to indoor plant placement (from June 6 to 24th) and the 2nd observation was conducted after indoor plant placement (from September 26th to October 14th). Each observation consisted of 9 measurement days (every Monday, Wednesday, and Friday). The investigation was carried out after closing all the windows and entrance doors to prevent effects from outdoors. The present study observed indoor thermal conditions at 1 site at the height of 1.5 m above floor level in the middle of the classroom (less than 4 m from indoor plant placement) using a digital recorder (Testo950; IS Tech., Seoul, Korea). The observation was conducted for 50 min at 9 a.m. and 1 p.m. every measurement day with the students active. Carbon dioxide in indoor air was measured at 2 sites (front and rear sites, as far as 3 m or 6 m from indoor plant placement) in a classroom at 1 p.m. every measurement day using a digital gas analyzer (Gas Analyser; Witt-Gasetetechnik, Witten, Germany).
The concentrations of formaldehyde and BTEX were measured at 2 sites (front and rear sites, as far as 3 m or 6 m from indoor plant placement) in a classroom at 1 p.m. every measurement day. The concentration of formaldehyde in indoor air was measured as follows. In a personal air sampler (Minipump ΣMP-100H; SIBATA, Saitama, Japan), an ozone scrubber was connected in series with a cartridge filled with 350 mg of 2,4-dinitrophenylhydrazine-silica (100 mg dinitrophenylhydrazine) (Waters Corp., Milford, MA, USA). Then, indoor air was absorbed at a height of 1.5 m above floor level at an air flow rate of 0.5 L·min−1 for 30 min and the indoor level of formaldehyde was analyzed using high-performance liquid chromatography with ultraviolet absorption (Alliance 2690 and 2487; Waters Corp.). The measurement of BTEX concentration in indoor air followed the solid trap and thermal desorption method (Kim et al., 2010; Kim et al., 2011; Lim et al., 2009). BTEX was absorbed with indoor air into a personal air sampler (Minipump ΣMP-30; SIBATA) equipped with a Tenax-TA tube (1/4” × 10 cm stainless steel; Supelco, Bellefonte, PA, USA) at a flow rate of 10 L·min−1 for 30 min and analyzed using gas chromatography (G-14-B; Shimadzu, Tokyo, Japan). The probability of the calibration curve was managed at the level of 0.5% for formaldehyde and BTEX. The extraction efficiencies were 92 to 105% for formaldehyde and 89 to 113% for BTEX.
Evaluation of symptom degree of sick school syndrome
The symptom degree of SSS was evaluated 3 times during the entire experimental duration. The observation was conducted at the beginning of residence in the classroom (March), just prior to indoor plant placement (June), and after 3-month indoor plant placement (September). The present study made use of the questionnaire by Mizoue et al. (2001) in the evaluation of the symptom degree of SSS. All the participants filled out the questionnaire, composed of 12 items on health complaints related to the parts of body, such as the eyes, nose, throat, hands, and head and scalp. Each item had a question with 4-degree answers of frequency for students to complete: none (0 points), occasionally (1 point), sometimes (2 points), and often (3 points). The scores were added up to 36 points and compared for all observation items. An additional questionnaire was conducted on allergic rhino-conjunctivitis to compose a multiple regression model for analyzing the factors affecting SSS.
Statistical analysis
The degrees of indoor thermal condition and indoor air quality were statistically analyzed by the Kruskal-Willis test and Wilcoxon’s rank sum test between the groups with or without indoor plants. Factors affecting the symptom degree of SSS were analyzed by multiple regression in which independent variables included indoor plant placement, indoor air condition, and individual health conditions.
Results
Indoor thermal condition and indoor air quality
In the classroom at School B, the time from June to October saw a significant decrease in air temperature (from 26.7 to 24.0°C), which was accelerated by indoor plant placement during the same period (from 27.2 to 23.2°C). There were no significant changes in temperature and humidity in the classroom at School A and humidity in the classroom at School B, which was hardly altered by indoor plant placement (Table 3).
Table 3.
Changes of thermal environment in a classroom in a newly built school according to indoor plant placement.
| Site |
Measurement (unit) |
Without plants |
With plants |
|
|
| 1st (Jun.) |
2nd (Oct.) |
P value |
1st (Jun.) |
2nd (Oct.) |
P value |
| School A |
Temperature (°C) |
25.2 ± 0.8 |
25.6 ± 2.7 |
NS |
26.3 ± 1.8 |
26.1 ± 3.6 |
NS |
| Humidity (%) |
56 ± 7 |
47 ± 10 |
NS |
57 ± 6 |
48 ± 9 |
NS |
|
| School B |
Temperature (°C) |
26.7 ± 1.4 |
24.0 ± 1.5 |
* |
27.2 ± 1.9 |
23.2 ± 1.2 |
** |
| Humidity (%) |
51 ± 6 |
51 ± 6 |
NS |
56 ± 7 |
51 ± 12 |
NS |
Mean ± standard deviation.
June: prior to indoor plant placement, October: 3 months after indoor plant placement.
* significant at
P < 0.05,
** significant
P < 0.01 by Kruskal-Willis test.
The concentration of formaldehyde in indoor air reduced with high significance from 32.62 to 11.74 μg·m−3 in the classroom at School A and from 29.62 to 12.16 μg·m−3 in the classroom at School B after the 3-month intervention period without indoor plants (Table 4). Indoor plant placement hardly affected the indoor concentration of formaldehyde in the classrooms at both schools. There was no systematic trend in the concentration changes of other volatile organic compounds over the 3-month intervention period. Nevertheless, after 3-month indoor plant placement, the indoor level of benzene decreased in the classrooms at both schools. In the concentration of ethylbenzene in indoor air, indoor plant placement made little difference in the classroom at School A (from 9.40 to 7.88 μg·m−3) but there was a significant decrease in the classroom at School B (from 6.31 to 3.60 μg·m−3).
Table 4.
Changes of air pollutant concentration in a classroom in a newly built school according to indoor plant placement (unit: μg·m
−3).
| Site |
Air pollutant |
Without plants |
With plants |
|
|
| 1st (Jun.) |
2nd (Oct.) |
P value |
1st (Jun.) |
2nd (Oct.) |
P value |
| School A |
Formaldehyde |
32.62 ± 12.28 |
11.74 ± 1.94 |
** |
42.85 ± 15.04 |
11.81 ± 2.96 |
** |
| Benzene |
6.12 ± 2.27 |
4.09 ± 1.58 |
** |
6.08 ± 2.86 |
4.12 ± 1.54 |
** |
| Toluene |
70.97 ± 29.47 |
68.43 ± 48.64 |
NS |
63.99 ± 27.09 |
50.50 ± 38.13 |
NS |
| Ethylbenzene |
9.67 ± 7.18 |
5.48 ± 4.51 |
* |
9.40 ± 6.81 |
7.88 ± 6.38 |
NS |
| Xylene |
6.91 ± 5.16 |
7.08 ± 2.56 |
NS |
8.09 ± 4.39 |
7.38 ± 3.71 |
NS |
|
| School B |
Formaldehyde |
29.62 ± 11.82 |
12.16 ± 3.02 |
** |
24.19 ± 8.85 |
11.06 ± 2.79 |
** |
| Benzene |
5.36 ± 3.02 |
4.87 ± 1.09 |
NS |
5.24 ± 2.52 |
3.42 ± 1.01 |
* |
| Toluene |
61.04 ± 24.10 |
111.07 ± 54.57 |
** |
86.37 ± 33.42 |
26.63 ± 26.75 |
** |
| Ethylbenzene |
9.08 ± 6.35 |
9.23 ± 6.45 |
NS |
6.31 ± 4.77 |
3.60 ± 4.40 |
* |
| Xylene |
7.97 ± 5.96 |
8.12 ± 2.40 |
NS |
7.44 ± 5.83 |
6.02 ± 1.85 |
NS |
Mean ± standard deviation.
June: prior to indoor plant placement, October: 3 months after indoor plant placement.
** significant
P < 0.01 by Wilcoxon’s rank sum test.
All students completed a questionnaire to evaluate their symptom degrees of SSS at 3 observation times: the beginning of residence in the classroom (March), just prior to indoor plant placement (June), and after 3-month indoor plant placement (October). At the second observation time (June), all the students had experienced a decrease in their SSS symptom scores at both schools regardless of indoor plant placement, with a change range of 0.03 to 3.00 points. In the comparison of the symptom score change of SSS at the third observation time (October), the students in the classroom without indoor plants showed an increase in SSS symptom scores from 2.87 to 4.22 points at School A and 8.20 to 9.90 points at School B, but the students in the classroom with indoor plants demonstrated a constant decrease from 6.83 to 5.52 at School A and 8.50 to 7.23 at School B (Fig. 2). However, the evaluation failed to show a significant difference in the symptom score change between the classrooms at each school.

Multiple regression analysis was applied to the subjects in the classrooms at both schools according to indoor plant placement, indoor conditions, and their individuality to examine the factors affecting selfawareness of SSS. The evaluation used independent variables for indoor plant placement, indoor conditions in classrooms, and individuality.
The regression model showed the explanatory power as 14.4% for the students at School A and 11.8% for those at School B. At both schools, indoor plants failed to show a relationship to the subjects in the awareness of SSS symptoms. For the air condition, the higher indoor level of formaldehyde caused more subjects to have selfawareness of SSS symptoms in the classroom at School A. Regarding the other factors of the air condition, subjects seemed to have a reverse (benzene in School A) or little relationship with the self-awareness of SSS symptoms in the classroom at both schools. Observation of the self-awareness degree through individuality showed the highest absolute value of regression estimate (B) for a past history of bronchial asthma with statistical significance for the classroom at School A (P < 0.05) and high significance for the classroom at School B (P < 0.01). Students in the classrooms at both schools also demonstrated high significance (P < 0.01) of the selfawareness degree with second-hand smoking, a past history of allergic rhinitis and a past history of atopic dermatitis. The present study failed to exhibit a trend in the self-awareness degree through differences of gender and atopic family history (Table 5).
Table 5.
Multiple regression analysis of variables affecting the total score of SSS for newly built elementary schools.
| Site |
Classification |
Variable |
Symptom evaluation of total score of sick building syndrome
|
| B |
β |
t |
|
| School A |
Indoor plant |
|
0.836 |
0.072 |
1.306 |
NS |
|
| Air condition |
Formaldehyde |
0.052 |
0.183 |
2.642 |
** |
| Benzene |
−0.298 |
−0.133 |
−3.208 |
** |
| Toluene |
−0.004 |
−0.027 |
−0.507 |
NS |
| Temperature |
0.043 |
0.021 |
0.344 |
NS |
| Relative humidity |
−0.010 |
−0.019 |
−0.240 |
NS |
| Carbon dioxide |
−0.001 |
−0.085 |
−1.712 |
NS |
| Natural ventilation frequency |
0.734 |
0.072 |
1.577 |
NS |
|
| Individuality |
Gender |
−1.797 |
−0.186 |
−4.707 |
** |
| Second-hand smoking |
1.593 |
0.164 |
4.207 |
** |
| Allergic rhinitis past history |
1.311 |
0.125 |
2.918 |
** |
| Bronchial asthmatics past history |
2.831 |
0.098 |
2.535 |
* |
| Atopic dermatitis past history |
−1.576 |
−0.131 |
−3.394 |
** |
| Atopic family history |
0.148 |
0.015 |
0.361 |
NS |
|
| F value |
|
|
8.185 |
|
|
| Adjusted R2 |
|
|
0.144 |
|
|
|
| School B |
Indoor plant |
|
−1.085 |
−0.052 |
−0.274 |
NS |
|
| Air condition |
Formaldehyde |
0.049 |
0.064 |
0.635 |
NS |
| Benzene |
−0.360 |
−0.092 |
−1.180 |
NS |
| Toluene |
0.003 |
0.013 |
0.089 |
NS |
| Temperature |
0.048 |
0.010 |
0.084 |
NS |
| Relative humidity |
−0.027 |
−0.025 |
−0.333 |
NS |
| Carbon dioxide |
−0.001 |
−0.060 |
−0.718 |
NS |
| Natural ventilation frequency |
−0.109 |
−0.007 |
−0.062 |
NS |
|
| Individuality |
Gender |
−0.697 |
−0.044 |
−0.822 |
NS |
| Second-hand smoking |
2.747 |
0.173 |
3.217 |
** |
| Allergic rhinitis past history |
3.605 |
0.177 |
3.447 |
** |
| Bronchial asthmatics past history |
9.445 |
0.179 |
3.493 |
** |
| Atopic dermatitis past history |
−6.034 |
−0.221 |
−4.191 |
** |
| Atopic family history |
2.533 |
0.160 |
3.101 |
** |
|
| F value |
|
|
4.418 |
|
|
| Adjusted R2 |
|
|
0.118 |
|
|
Discussion
The present study failed to find a prevalent tendency in the observation of changes of indoor thermal conditions according to indoor plant placement. Previous researchers suggested that indoor conditions could vary according to the species and management methods of indoor plants (Bourbeau et al., 1997; Fjeld et al., 1998; Lohr, 1992; Pearson, 1994). In the present study, the difference in the sites and methods of indoor plant placement in a classroom might have been responsible for not finding a consistent trend to some degree (Table 3).
According to previous studies, indoor air pollutants are mainly composed of formaldehyde and BTEX (Jurvelin et al., 2001; Kim et al., 2010), so the present study measured the concentrations of these substances in indoor air.
The indoor level of these substances, except xylene, reduced with time, which showed little difference by indoor plant placement. Adgate et al. (2004) reported that the concentration of air pollutants was higher in a closed space than outdoors. Considering that the classroom was not ventilated until June and continued to be ventilated until October to control the indoor condition, it was appropriate to assume that the high concentration of the substances in indoor air was caused by the lack of ventilation. Wood et al. (2006) reported that indoor plant placement showed better results for indoor air quality in spaces with a lower indoor level of air pollutants than with a higher indoor level of these substances. Hence, it could be postulated that the high indoor level of air pollutants decreased the effect of indoor plant placement during the observation period. The indoor levels of formaldehyde and BTEX were reported to be high enough to bring about irritation of the eyes, nose, and lower respiratory system (Bardana and Montanaro, 1991) and other allergic diseases such as asthma (Krzyzanowski et al., 1990; Rumchev et al., 2002). So, the existence of these air pollutants in indoor air at such a level could cause SSS symptoms in indoor residents.
On the other hand, toluene increased in the classrooms at School B without indoor plants over time. Previous researchers pointed out that air pollutants in indoor air were emitted from indoor objects such as building materials, desks and chairs, bookshelves, and cabinets (Diez et al., 2000; Farrow et al., 1997). Additionally, there were distinctive differences between the schools. Indoor plants were installed at the back of the classrooms in School A and near the window in School B. The classrooms in School A had a window on one side with mechanical ventilation and those at School B had a window on two sides with natural ventilation. It could be postulated that indoor plants at different sites would cause different degrees of improvement of indoor air quality. So the present study proposed that indoor plant placement should be conducted at appropriate sites to achieve a suitable degree of indoor air improvement (Table 4).
In the comparison of SSS symptom scores according to indoor plant placement, the students in the classroom without indoor plants experienced a symptom score increase at the third observation time after the decrease at the second observation time, but the students in the classroom with indoor plants showed a constant decrease of their symptom score. Although there was insufficient statistical significance, indoor plant placement seemed to reduce the SSS symptom scores of students. The present study proposed 2 possibilities. First, students experienced a decrease in the SSS symptom score by the aesthetic effects of indoor plants. It could be assumed that there was an aesthetic effect of tranquility based on vision. This suggestion has been reported by several former researchers (Bringslimark et al., 2009; Hartig et al., 2003; Kaplan, 2001; Lohr and Pearson-Mims., 2000). Another possibility is the purifying effect by indoor plants. Thus, the decrease of the SSS symptom score was accompanied with the reduction of indoor air pollutants (Fig. 2).
The present study found that a past history of asthma as an independent variable showed higher explanatory power as it had a higher absolute value of regression estimate (B) in regression analysis. Previous studies have reported the relationship between exposure to volatile organic compounds and respiratory disorders in schoolaged children (Jaakkola et al., 2004). In the present study, students with respiratory disorders such as rhinitis or asthma showed a high SSS symptom score (P < 0.01). Similar results were frequently found in previous research on the relationship between allergic diseases and SBS symptoms (Smedje and Norback, 2001; Smedje et al., 1997). Likewise, the present study showed a similar tendency in the relationship between the concentration of toluene in indoor air and the SSS symptom score (Table 5).
There were several limitations of the present study. The study had insufficient explanatory power in regression analysis to explain plant effects on the indoor environment and SSS because the results were obtained without the consideration of other indoor factors influencing the indoor environment and individual characteristics. Nevertheless, the present study provided results as a practical case study on applying indoor plants to an indoor environment and the individual SSS symptom degree in a newly built elementary school.
Literature Cited
- Adgate, J. L., T. R. Church, A. D. Ryan, G. Ramachandran, A. L. Fredrickson, T. H. Stock, M. T. Morandi and K. Sexton. 2004. Outdoor, indoor, and personal exposure to VOCs in children. Environ. Health Perspect. 112: 1386–1392.
- Bardana, E. J. and A. Montanaro Jr. 1991. Formaldehyde: an analysis of its respiratory, cutaneous, and immunologic effects. Ann. Allergy 66: 441–452.
- Bourbeau, J., B. Brisson and S. Allairc. 1997. Prevalence of the sick building syndrome symptoms in office workers before and after six months and three years after being exposed to a building with an improved ventilation system. Occup. Environ. Med. 54: 49–53.
- Braun-Fahrlander, C. 2003. Environmental exposure to endotoxin and other microbial products and the decreased risk of childhood atopy: evaluating developments since April 2002. Curr. Opin. Allergy Clin. Immunol. 3: 325–329.
- Bringslimark, T., T. Hartig and G. G. Patil. 2009. The psychological benefits of indoor plants: A critical review of the experimental literature. J. Environ. Psychol. 29: 422–433.
- Daisey, J. M., W. J. Angell and M. G. Apte. 2003. Indoor air quality, ventilation and health symptoms in schools: an analysis of existing information. Indoor Air 13: 53–64.
- Diez, U., T. KroeBner, M. Rehwagen, M. Richter, H. Wetzig, R. Schulz, M. Borte, G. Metzner, P. Krumbiegel and O. Herbarth. 2000. Effects of indoor painting and smoking on airway symptoms in atopy risk children in the first year of life results of the LARS-study. Leipzig Allergy High-Risk Children Study. Int. J. Hyg. Environ. Health 203: 23–28.
- Erdei, E., J. Bobvos, M. Brozik, A. Paldy, I. Farkas, E. Vaskovi and P. Rudnai. 2003. Indoor air pollutants and immune biomarkers among Hungarian asthmatic children. Arch. Environ. Health 58: 337–347.
- Farrow, A., H. Taylor and J. Golding. 1997. Time spent in the home by different family members. Environ. Technol. 18: 605–613.
- Fjeld, T., B. Velersted, L. Sandvik, G. Riise and F. Levy. 1998. The effect of indoor foliage plants on health and discomfort symptoms among office workers. Indoor Built Environ. 7: 204–209.
- Franklin, P. J. 2000. Indoor air quality and respiratory health of children. Paediatric Respiratory Reviews 8: 281–286.
- Franklin, P., P. Dingle and S. Stick. 2000. Raised exhaled nitric oxide in healthy children is associated with domestic formaldehyde levels. Am. J. Respir. Crit. Care Med. 161: 1757–1759.
- Garrett, M. H., M. A. Hooper, B. M. Hooper, P. R. Rayment and M. J. Abramson. 1999. Increased risk of allergy in children due to formaldehyde exposure in homes. Allergy 54: 330–337.
- Hartig, T., G. W. Evans, L. D. Jamner, D. S. Davis and T. Garling. 2003. Tracking resoration in natural and urban field settings. J. Environ. Psychol. 23: 109–123.
- Hodgson, M., H. Levin and P. Wolkoff. 1994. Volatile organic compounds and indoor air. J. Allergy Clin. Immunol. 94: 296–303.
- Jaakkola, J. J., H. Parise, V. Kislitsin, N. I. Levedeva and J. D. Spengler. 2004. Asthma, wheezing, and allergies in Russian schoolchildren in relation to new surface materials in the home. Am. J. Public Health 94: 560–562.
- Jurvelin, J., M. Vartiainen, M. Jantunen and P. Pasanen. 2001. Personal exposure levels and micro-environmental concentrations of formaldehyde and acetaldehyde in the Helsinki metropolitan area. Finland. J. Air Waste Manage Assoc. 51: 17–24.
- Kang, S. A., S. J. Choi and Y. S. Kim. 2008. The relativity analysis between indoor air quality and building construction conditions in Incheon area's schools—focused on completion time of building and construction materials. J. Korean Soc. Living Environ. Sys. 15: 277–286.
- Kaplan, R. 2001. The nature of the view from home: psychological benefits. Environment and Behavior. 33: 507–542.
- Kim, K. J., M. I. Jeong, D. W. Lee, J. S. Song, H. D. Kim, E. H. Yoo, S. J. Jeong, S. W. Han, S. J. Kays, Y. W. Lim and H. H. Kim. 2010. Variation in formaldehyde removal efficiency among indoor plant species. HortSience 45: 1489–1495.
- Kim, H. H., J. Y. Lee, J. Y. Yang, K. J. Kim, Y. J. Lee, D. C. Shin and Y. W. Lim. 2011. Evaluation of indoor air quality and health related parameters in office buildings with or without indoor plants. J. Japan. Soc. Hort. Sci. 80: 96–102.
- Krzyzanowski, M., J. J. Quackenboss and M. D. Lebowitz. 1990. Chronic respiratory effects of indoor formaldehyde exposure. Environ. Res. 52: 117–125.
- Lim, Y. W., H. H. Kim, J. Y. Yang, K. J. Kim, J. Y. Lee and D. C. Shin. 2009. Improvement of indoor air quality by houseplants in new-built apartment buildings. J. Japan. Soc. Hort. Sci. 78: 456–462.
- Lim, Y. W., J. Y. Yang, H. H. Kim, Y. G. Lee, Y. S. Kim, S. K. Jang, J. R. Son, Y. M. Roh and D. C. Shin. 2006. Health risk assessment in terms of VOC at newly-built apartment house. J. Kor. Soc. Indoor Environ. 3: 211–223.
- Lohr, V. I. 1992. The contribution of interior plants to relative humidity in an office. p. 117–119. In: D. Relf (ed.). Human Benefits of Plants: Well-Being and Social Development. Timber Press, Portland.
- Lohr, V. I. and C. H. Pearson-Mims. 2000. Physical discomport may be reduced in the presence of interior plants. HortTechnology 10: 53–58.
- Lu, C., D. E. Knutson, J. Fisker-Andersen and R. A. Fenske. 2001. Biological monitoring survey of organophosphorus pesticide exposure among pre-school children in the Seattle metropolitan area. Environ. Health Perspect. 109: 299–303.
- Mizoue, T., K. Reijula and K. Andersson. 2001. Environmental tobacco smoke exposure and overtime work as risk factors for sick building syndrome in Japan. Amer. J. Epidemiol. 154: 803–808.
- National Institutes of Medicine 2000. Clearing the air: asthma and indoor air exposure. National Academy Press, Washington, D. C.
- Pearson, S. 1994. Easy breathing in the office. Horticulture Week, Nov 17: 24–25, 27.
- Rumchev, K. B., J. T. Spickett, M. K. Bulsara, M. R. Phillips and S. M. Stick. 2002. Domestic exposure to formaldehyde significantly increases the risk of asthma in young children. Eur. Respir. J. 20: 403–408.
- Selter, J. M. 1994. Building-related illness. J. Allergy Clin. Immunol. 94: 351–362.
- Sheets, L. P. 2000. A consideration of age-dependent differences in susceptibility to organophosphorus and pyrethroid insecticide. Neuro Toxicol. 21: 57–64.
- Smedje, G. and D. Norback. 2001. Irritants and allergens at school in relation to furnishings and cleaning. Indoor Air 11: 127–133.
- Smedje, G., D. Norback and C. Edling. 1997. Asthma among secondary school pupils in relation to the school environment. Clin. Exp. Allergy 27: 1270–1278.
- Takigawa, T., Y. Saijo, K. Morimoto, K. Nakayama, E. Shibata, M. Tanaka, T. Yoshimura, H. Chikara and R. Kishi. 2012. A longitudinal study of aldehydes and volatile organic compounds associated with subjective symptoms related to sick building syndrome in new dwellings in Japan. Sci. Total Environ. 417–418: 61–67.
- Wantke, F., C. M. Demmer, P. tappler, M. Gotz and R. Jarisch. 1996. Exposure to gaseous formaldehyde induces IgE-mediated sensitization to formaldehyde in school-children. Clin. Exp. Allergy 26: 276–280.
- Wood, R. L., M. D. Burchett, R. Alquezar, R. L. Orwell, J. Tarran and F. Torry. 2006. The potted-plant microcosm substantially reduces indoor air VOC pollution: I. Office field-study. Water, Air, and Soil Pollution 175: 163–180.
- Zhao, Z., A. Sebastian, L. Arsson, Z. Wang, Z. Zhang and D. Norback. 2008. Asthmatic symptoms among pupils in relation to microbial dust exposure in schools in Taiyuan, China. Pediatr. Allergy Immunol. 19: 455–465.