4. Results
4.1 Hourly 222Rn observations
Hourly mean atmospheric 222Rn concentrations observed at the four JMA stations are plotted in Fig. 2, together with the data acquisition rate (ratio of the number of hourly observations to total hours in a month), means, medians, and upper and lower quartiles of data for each month. Atmospheric 222Rn concentrations display clear seasonal cycles with maxima in winter and minima in summer at all stations, with no significant long-term trend. Anomalously high concentrations occur irregularly due to natural causes in all seasons at all stations. The causes are almost exclusively continental transport of 222Rn, as discussed in Section 4.3, while more local conditions such as planetary boundary layer height (PBLH), land-sea breeze, and local emissions are also likely to affect atmospheric 222Rn at RYO, as discussed in Section 4.4. As discussed for the MNM, YON, and RYO stations by Wada et al. (2012, 2013) and Ishijima et al. (2018), seasonal patterns are generally explained by seasonal exchanges of continental and maritime air masses over the western North Pacific, consistent with seasonal changes in wind fields (Figs. 1b, c). Japan is in the East Asian Monsoon region, so it is affected by 222Rn outflow from the Eurasian continent in winter, and in summer it is covered by maritime air containing less 222Rn primarily due to the Ogasawara high, which is usually centered off the southeastern coast of the main island of Japan in summer. Synoptic high-222Rn events occur at the stations more frequently in winter when low-pressure systems develop over the Pacific (Fig. 1b), forming cold fronts with rapid 222Rn transport from the continent behind the frontal line. Such fronts usually migrate eastward, passing over the stations, which then record higher 222Rn concentrations. This typical pattern has been described previously by Ishijima et al. (2018), based on composite analyses of high 222Rn events at remote stations. Although 222Rn observations at station CCJ are reported here for the first time, meteorological processes driving seasonal and synoptic variations there are similar to those at station MNM, as deduced from their locations, windfield seasonality (Fig. 1), and observed concentrations (Fig. 2). The magnitudes of 222Rn concentration at each station roughly reflect the 222Rn transport path distance from continental source regions, considering the short 222Rn half-life of only ∼ 3.8 days. This is discussed further in the following section.

Data acquisition rates were generally > 90 % for the entire observation period, with those at station YON being slightly lower because the station is unmanned. Data may also be missing because of periodic maintenance and typhoon weather etc.
4.2 Seasonal variations of observed and simulated 222Rn concentrations
Figure 3 reports means, medians, and upper and lower quartiles of 222Rn concentrations observed and simulated monthly at each station over the whole observation period (Table 1). Correlation coefficient and standard deviation between monthly mean 222Rn concentrations of each model simulation and observation are also shown. Winter maxima and summer minima commonly occur at MNM, CCJ, and YON for both observations and model simulations. Results for MNM and CCJ are similar due to their similar locations and surrounding environments as remote island stations in the Pacific, far from continental sources. However, the 222Rn concentrations at MNM are almost half those observed at CCJ, reflecting the greater distance from the continental sources. Assuming that the 222Rn transport path from the continental source region to CCJ and MNM in winter (December to March) is roughly linear, the elapsed time and speed of 222Rn transport from CCJ to MNM were estimated as 3.5 days and 4.0 m s−1, respectively, based on mean December–February observations and a CCJ–MNM distance of ∼ 1200 km. The model results gave speeds of 4.1–4.7 m s−1. These speeds seem to be consistent with mean wind speeds (Fig. 1b). Such estimations could provide an index for transport timescales from CCJ to MNM, despite them having different source regions. At RYO, strong local emissions obscure monsoon-driven atmospheric 222Rn seasonality.

The models well simulated the observed monthly patterns at MNM, CCJ, and YON, as shown by the high correlation coefficients of more than 0.9, although 222Rn levels were slightly underestimated by models, especially at CCJ and YON. At MNM and CCJ, there is little difference between model horizontal resolutions and 222Rn emission types, indicating that 222Rn variations are controlled predominantly by synoptic-scale atmospheric transport. Monthly emission simulations match observations slightly more accurately, with higher values for all seasons, particularly at YON. Especially, the lower-resolution model with monthly emission showed the closest values to the observation. It is due to the relationship between station location and land emission area in model. Both constant and monthly emission data gave very low oceanic emissions (0.10 mBq m−2 s−1 and 0.14 mBq m−2 s−1, respectively) in grids surrounding YON station as Yonagunijima island is very small (< 30 km2), as accurately reproduced by the high-resolution model (TL319). However, this was not the case for the low-resolution model (TL95) with monthly emission because grids to the west of YON include eastern Taiwan, which has high land emission (Fig. S2a), causing higher 222Rn values at YON in TL95 than in TL319. In contrast, constant emission simulation by TL319 showed higher values than that by TL95 throughout the year, because there is no land grid at the location of Taiwan in TL95, as mentioned in Section 3.2. Such situations occur for atmospheric component simulations depending on station location and emission distribution. If high-resolution emission data are realistic, a higher-resolution model should better reproduce atmospheric observations at a station such as YON. Nevertheless, if the emission data are not realistic, even if they are of high resolution, a lower-resolution model sometimes better reproduces observations with the unrealistic emission distribution being smoothed out, as is likely at YON. At RYO, the difference in atmospheric 222Rn simulations between emission types is pronounced. Moreover, correlation coefficients for constant emission simulations at RYO show the model resolution dependency, with the lowest correlation coefficient for TL95 (0.6) against high correlation for TL319 (0.85). This is a case that larger emission distribution difference between resolutions for constant emission than that for monthly emission (Figs. S1, S2) is reflected in simulated 222Rn, coupled with the coastal location. Monthly emission simulations significantly underestimate observations, whereas constant emission simulations better reproduce observed 222Rn levels. These results may simply reflect terrestrial emissions from Japan affecting RYO, considering the prevailing wind direction from the west. Monthly emissions in northern Japan are much lower than Eurasian continental emissions (Figs. 1b, c) and land emissions of constant emission (Fig. 1a). Emissions in northern Japan may therefore be significantly underestimated in monthly emission data. Inverse modeling by Hirao et al. (2010b) indicates that emissions estimated by Hirao et al. (2010a) may be underestimated by ∼ 30 %, although no station in the northern main island was used. Continental emissions of monthly emission data seem to be more realistic than those of constant emission data, considering monthly emission results were better at YON, which is most affected by continental emissions among the four stations. The underestimation by models at MNM, CCJ, and YON may be due to the underestimation of emission data for wider East Asian regions (Hirao et al. 2010a), with simulations based on the same constant emission also underestimating observations in China and Korea (Zhang et al. 2021). Throughout comparisons between observations and model simulations at four JMA stations in this section, monthly emission data seems to be slightly better than constant emission data, as also indicated by score values in Fig. 3, although results at RYO are not so simple as mentioned above.
4.3 Synoptic high-222Rn events
High-222Rn events are sometimes observed almost simultaneously at two or three of the four JMA stations, especially in cold seasons, due to frontal activity excited by lows. Figure 4 shows an example of such simultaneous events at YON, CCJ, and MNM in 2017. High-222Rn events occurred during January 20–22, January 30–February 1, and February 2–3 in 2017 at YON, CCJ, and MNM, with the second and third events also being observed on January 30–31 and February 2 at YON, respectively. For all cases, high- 222Rn events were first observed at YON, then at CCJ, and finally at MNM. In each event, a cold front holding high 222Rn concentrations behind the frontal line moved eastward over the stations, with high 222Rn levels being observed in the station order. Model simulations generally reproduce temporal high-222Rn patterns with synoptic timescales of 2–5 days from trough to trough. However, the reproducibility of shorter peaks (< 12 h) sometimes highly depends on the horizontal resolution of the model. The clearest such case was observed on January 21, 2017, at CCJ. The first and second peaks were observed at 01:00 JST and 10:00 JST, respectively. The TL319 model with monthly emissions also simulated two similar peaks, but 1 hour later at 02:00 JST and 11:00 JST, and with constant emission, it showed a very small first peak. The TL95 model simulated only one peak on that day. The cases on January 30–31 and February 1–2 at YON (Fig. 4a) also demonstrate that only TL319 can resolve the observed multiple peaks.

The horizontal distribution and latitude–pressure cross-section of atmospheric 222Rn concentrations at the longitude of CCJ on January 21, 2017 (07:00 JST), are shown in Fig. 5, corresponding to a trough between the two high peaks (Fig. 4b), as simulated by TL95 and TL319 with monthly emissions. Contours of equivalent potential temperature and potential vorticity are also shown as indices for distributions of atmospheric components around a cold front and stratospheric air, respectively. Potential vorticity was calculated from 6-hourly JRA-55 Reanalysis data, spatiotemporally interpolated (Sawa et al. 2008). TL95 shows no trough in 222Rn concentrations around CCJ (Fig. 5a), but TL319 shows an arcuate shape of low 222Rn trough over CCJ (Fig. 5c). To the north and south of CCJ, there are two elongated 222Rn streamlines originating from northern China/Korea and southern China/Taiwan, respectively. The southern and northern branches (Fig. 5c) were observed as the first and second peaks, respectively, on January 21 at CCJ (Fig. 4b). The significant difference in TL319 results at CCJ on January 21 is attributable to the emission in southern China in January being much greater than in July and than the constant emission (Fig. 1). Model resolutions finer than 60 km (corresponding to TL319) are needed to reproduce the general shape of observed high-222Rn peaks at remote stations (Ishijima et al. 2018), but here the sharp edge of the observed peak could not be reproduced, even at high resolution, as also indicated in Fig. 4, especially at CCJ. Latitude–pressure cross-sections clearly show that the southern branch involves 222Rn accumulated behind the frontal surface at around 23°N (Fig. 5d), and the northern branch at around 29°N is visible only in the TL319 result. Radon-222 was seemingly uplifted from near-surface layers to around the 500 hPa level (Figs. 5b, d), although it was likely to be uplifted over the continent and then transported eastward, based on our model simulation results. A low 222Rn trend from ∼ 450 hPa down to ∼ 750 hPa over CCJ might have been caused by stratospheric air intrusion, as shown by the potential vorticity isoline of 1 PVU (PVU = 106 m2 s−1 K kg−1). It seemed that 222Rn, uplifted on the China Mainland, was eastward transported by strong westerlies in the middle troposphere, then the high 222Rn region for the 800–500 hPa was divided by the stratospheric intrusion (Fig. S3). Upward transports looked mainly occurring ahead of the frontal line, as indicated by negative vertical velocities, in the warm sector with less 222Rn. Thus, it is unlikely that 222Rn around the 500 hPa level originated from the nearsurface maritime air. Reid and Vaughan (2004) observed a tropopause fold behind a cold front together with active convection over the frontal surface, based on aircraft observation. The GSAM-TM simulations thus indicate that complicated three-dimensional atmospheric structures may sometimes be produced over cold fronts and related lows, significantly affecting spatiotemporal variations of atmospheric constituents.

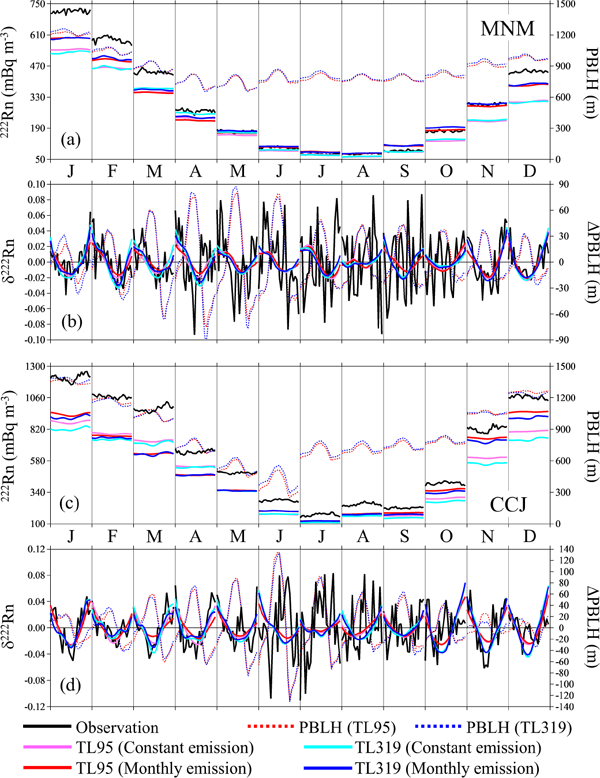
Mean diurnal cycles of observed and simulated 222Rn and simulated PBLH [calculated following the method of Seidel et al. (2012)] at hourly interval (00:00–23:00 JST) for each month at the four stations are shown in Figs. 6 and 7. Diurnal cycles were calculated in two ways, either as the simple mean of hourly data for each hour of each month over the whole observation period, or as hourly data divided by the daily mean and subtracted by one, averaged for each hour of each month. The latter is referred to as δ here, the value normalized to the daily mean. For each day, after calculating the daily mean from 24 hourly data in that day, hourly data are divided by the daily mean, and subtracted by one. δ is the mean of thus obtained values for each hour of each month. In both methods, if a day had missing hourly data, even for 1 hour, that day was not included in the diurnal cycle calculations. Δ also represents the simple mean of hourly data for each hour of each month, but is subtracted by the monthly mean, to make the diurnal amplitude seasonality more distinct.

Most previous studies have reported that the diurnal cycle of atmospheric 222Rn concentration is associated mainly with varying PBLH and local or quasi-local 222Rn emissions (e.g., Moriizumi et al. 2008; Chambers et al. 2019), while remote stations such as MNM or CCJ have been regarded as not having a diurnal cycle, with no local emissions. The atmospheric 222Rn concentration largely changes day by day mainly owing to synoptic transport of 222Rn from continental source emissions (Fig. 4). The lack of local sources and the existence of sporadic synoptic high-222Rn events obscure diurnal cycles at such remote stations. Normalization of hourly data to the daily mean may at least remove the synoptic variation signals. Conversely, synoptic transport of 222Rn from continental sources is needed to cause 222Rn diurnal cycles at such a remote station with no significant local 222Rn emissions, otherwise there is not enough 222Rn supply there. Thus supplied 222Rn in the near-surface atmosphere is affected by the local PBLH variations over the station and could be diurnally varied. We therefore first attempted the δ-calculation approach to extract diurnal signals at remote stations in this study.
The 222Rn has clear diurnal cycles at RYO (Figs. 6a, b), with both absolute and δ values varying in phase, almost opposite that of PBLH. The similar variations of absolute and δ values indicate that the diurnal cycles are caused mainly by local sources and diurnal variation of PBLH, with local sources including 222Rn emissions from upwind areas nearby on the main island of Japan, with westerly winds predominating throughout the year. Moriizumi et al. (2008) reported that Cape Ochiishi station on Hokkaido island displays diurnal 222Rn variations only during November–February, when seasonal northwesterly winds supply 222Rn from local areas upwind. The GSAM-TM also well simulates diurnal cycles with morning maxima and afternoon minima. The observed amplitude of 222Rn diurnal variations is larger in summer than in winter, despite the monthly mean being lower in summer, whereas the models do not show such seasonality of diurnal amplitude. This observed trend has also been reported in East Asia and Europe (Zahorowski et al. 2005; Moriizumi et al. 2008; Zimnoch et al. 2014). The mechanisms for this have not yet been established, but the results have been simply explained by surface heating and active vertical mixing owing to longer daytime insolation in summer. However, this is inconsistent with the monthly mean PBLH maxima in winter around Japan (Figs. 6a, c, 7a, c). In monsoon regions, during the wet season (summer), surface solar heating energy is used mainly to evaporate water, whereas in the dry season (winter), greater surface sensible heat flux is available to drive vertical dry mixing (Chan and Wood 2013), consistent with our simulated PBLH results (Figs. 6a, c, 7a, c). Land and sea breezes should be also considered as possible causes affecting 222Rn diurnal cycles at RYO, which is located on a mountain facing the Pacific Ocean. Although the prevailing wind direction is from the west in all seasons, the wind changes from a land breeze at nighttime to a sea breeze in daytime during April–September (Fig. S4). This could lead to higher and lower 222Rn concentrations in nighttime and daytime, respectively, as does the PBLH variation, with the observed diurnal amplitude being relatively large during these months. Furthermore, in winter strengthened westerlies brings more continental 222Rn, attenuating diurnal amplitudes, as discussed below. Thus, larger fractions of continental 222Rn could enhance the diurnal amplitude reduction in winter. The model also reproduces this observed trend of larger diurnal amplitude in summer but with smaller seasonal changes than those observed, most likely due to the lower model resolution being unable to reproduce diurnal changes in local wind direction (Fig. S4). To summarize, diurnal variations of PBLH, land and sea breezes, and 222Rn from local and remote sources are likely to be important in explaining the seasonal variation of the diurnal amplitude of 222Rn at RYO. The observed diurnal amplitudes in winter, which are lower than those simulated, may also be due to the seasonality of local 222Rn emissions. Lower temperatures could reduce 222Rn diffusion from soil to the atmosphere, due to freezing of soil water and/or temperature decrease in soil. The location of the station in complex terrain may also enhance the effects of local meteorology. However, these other factors are beyond the scope of this study.
At station YON, only observations display large diurnal variations with morning maxima and afternoon minima in summer, but models show negligibly small or opposite phase variations (Figs. 6c, d), because model grids around YON are oceanic with very low 222Rn emission (Figs. 1c, S1, S2). Observations, therefore, capture local 222Rn emission signals, as the station is surrounded by grassland and agricultural fields. A lower PBLH in summer fosters the accumulation of locally emitted 222Rn during night to morning. Remotely transported 222Rn, enhanced in winter, is related to the diurnal amplitude seasonality for observation and simulations, similarly to that at RYO. Trends in δ values in winter are similar at stations MNM, CCJ, and YON, although land and sea breezes are not considered for these stations because they are on small islands where there is little diurnal change in wind direction (Fig. S4).
At MNM and CCJ, diurnal cycles of absolute 222Rn concentrations are negligible or unclear (Figs. 7a, c). However, δ values from winter to spring (November–May) indicate clear diurnal cycles with notable day-time minima, with this temporal pattern being similar for both observations and models (Figs. 7b, d). The minima timings are similar to those of PBLH maxima, suggesting that PBLH variation drives 222Rn diurnal cycles. At the MNM and CCJ island stations, local 222Rn sources are not significant, and in model emissions around the stations are also negligibly small because there are no land grid-points around the stations. To evaluate the influence of oceanic emissions, we performed a test simulation using the TL95 model and modified emission maps, whose oceanic emissions were set to zero. Considering δ diurnal cycles in cold seasons at MNM and CCJ are well reproduced at both model resolutions (Figs. 7b, d), only TL95 simulation is expected to be adequate to obtain quantitative information for that. Consequently, the oceanic emissions seem to have no effect on the diurnal cycles, showing almost the same results as the original emission case (Fig. S6), although absolute 222Rn levels are slightly reduced especially for monthly emissions with larger oceanic emissions (Section 4.2). These results are consistent with the suggestion that variations of 222Rn concentrations in the near-surface atmosphere over the stations, which have been transported from the continental sources, are controlled by diurnal variations of the local PBLH. Therefore, clear diurnal cycles of δ, for both observations and models, occur only in months with high 222Rn concentrations due to active continental outflow of 222Rn (Figs. 1, 3, 4). In order to better understand what kind of condition contributes to the 222Rn diurnal cycles represented by δ, we performed an additional analysis for January, February, March, November, and December (Fig. S7 and its explanation in the supplement). It is found as a consequence that δ values highlight 222Rn diurnal cycles under conditions of lower 222Rn level and/or PBLH at remote stations. It means that variability and phase of δ diurnal cycle tend to be larger and closer to that of the monthly mean diurnal cycle, respectively, when the 222Rn level and/or PBLH are relatively low. They also suggest the possibility that PBLH is high when the 222Rn level is high due to the continental transport, and vice versa. It seems to be reasonable that PBLH generally increases with increasing wind speed and decreases with increasing atmospheric stability. In summer, the diurnal cycle of 222Rn seems not to be well extracted at remote stations even by the δ approach, because the signal-to-noise ratio is too low.
It is difficult to detect diurnal cycles with absolute values because δ values indicate very small diurnal amplitudes (generally < 10 % of daily means) in November–March. Similar diurnal variations of δ values occur at YON during November–December when the contribution of continental-origin 222Rn is more significant than that of local-origin 222Rn. Small δ amplitudes in those months at RYO are likely due to the same effect, although the contribution of local 222Rn is more significant there, even in winter.
Using δ values rather than absolute concentrations seems to successfully derive diurnal cycles from 222Rn concentrations when the station is less and more affected by local-origin 222Rn and episodic continental 222Rn transport, respectively. Especially, δ highlights 222Rn diurnal cycles when 222Rn level and/or PBLH are relatively low. At stations with significant diurnal cycles (e.g., RYO), both absolute and δ values similarly represent true diurnal cycles. The combined use of both absolute and δ values to represent observed and simulated 222Rn diurnal cycles has been helpful in elucidating the relative contributions of local and continental-transport 222Rn. Monthly mean diurnal amplitudes of δ at remote stations are actually very small, being mostly below 10 % of the daily mean 222Rn. Nevertheless, the amplitude and variation phase are quite similar for observation and model simulations. These results are notable, because small diurnal cycles are almost ignored when using only the absolute values (Figs. 7a, c). δ value seems to well function to validate the model performance of simulating the diurnal behavior of atmospheric components in the near-surface atmosphere, even when the atmospheric component shows large synoptic variability and/or very small diurnal variation. Diurnal cycles are important especially for carbon dioxide (CO2), because relative contributions of photosynthesis and respiration of land ecosystems vary between daytime and nighttime. For inverse model estimation of CO2 emissions, model performance for reproducing diurnal cycles significantly affected by PBLH reproducibility seriously affects CO2 emission estimates (e.g., Stephens et al. 2007). In this study, we discussed only temporal variations of 222Rn diurnal cycles, with a newly introduced δ calculation method, and a three-dimensional approach would be needed to further improve our understanding of atmospheric component behaviors around the observation stations.


