Article
Tropical Cyclones Affecting Japan Central Coast and Changing Storm Surge Hazard since 1980

2022 Volume 100 Issue 3 Pages 493-507

Details
2022 Volume 100 Issue 3 Pages 493-507
This study investigated tidal records and landfall tropical cyclone (TC) best tracks from 1980 to 2019 to determine changes in storm surge heights in coastal regions of Central Japan, including Tokyo. The results indicate that annual mean storm surge heights have increased in the last 20 years (2000–2019) compared with those in 1980–1999, and that these changes are noteworthy, particularly in Tokyo Bay. The TC wind intensity and size during landfall have become stronger and larger, respectively, corresponding to increasing storm surge magnitudes from 1980 to 2019. The increased frequency of TCs with more northeastward tracks is another factor that may have contributed to the increased surge hazards around Tokyo. Additionally, a positive correlation between surge heights and a hazard index supports these statistical findings. The central coast of Japan will likely experience increasing numbers of extreme storm surge events in the future if the current increasing tendency continues.
Tropical cyclone (TC)-generated storm surges are one of the most deadly and costly global hazards. In the last two decades, Hurricane Katrina (2005), Cyclone Sidr (2007), Cyclone Nargis (2008), and Typhoon Haiyan (2013) have each caused more than 1,000 fatalities, many of which were the direct result of storm surges (Esteban et al. 2015). Although extreme storm surges do not occur often, the related damage and impacts can be enormous in densely populated urban areas. For example, Hurricane Sandy (2012) inflicted a catastrophic storm surge of ∼ 2.7 m and resulted in USD 50 billion losses, particularly from storm surge along the mid-Atlantic coast, including the New York City metropolitan area (Blake et al. 2013). In 2018, Typhoon Jebi caused an inundation in Osaka Bay, Japan, and the Kansai-Osaka International Airport was entirely inundated, which resulted in USD 2 billion in damages (Le et al. 2019). Recent studies have suggested that the number of residents in coastal urban areas and that of individuals exposed to flooding from once in 100-year storm surge events will continue to increase in the future (Nicholls and Cazenave 2010; Brown et al. 2013; Hallegatte et al. 2013; Neumann et al. 2015). Therefore, it is of great importance to understand whether any changes in storm surge hazards affecting large cities have occurred in recent years, despite the relatively infrequent occurrence of major storm surge events.
Analyzing the changes in storm surge trends in a certain location helps assess whether coastal flooding risk reduction efforts are effective. Therefore, previous studies have analyzed changes in historical surge magnitudes in specific locations or globally. Several of these studies have concluded that surge levels are increasing over time. For example, Woodworth and Blackman (2004) and Menéndez and Woodworth (2010) analyzed storm-induced abnormal sea-level changes using a global tide gauge dataset. They concluded that many of the gauges showed significant increases in abnormal sea levels since 1970. Bromirski et al. (2003) found a significant increasing trend in extratropical surges in San Francisco since 1950. Church et al. (2006) observed an increase in the frequency of high-water levels (storm surges plus mean sea-level rise) after 1950 using data from two tide gauges on the eastern and western Australian coasts. These studies have confirmed that mean sea-level rise, interannual, and decadal variations are the main factors contributing to the increase in maximum surge height. However, changes in TC characteristics such as intensity, track, size, and translation speed are also capable of modulating the surge hazard potential. For example, Irish et al. (2008) evaluated the relationship between TC size (radius to maximum wind speed) and maximum storm surge over idealized continental shelf slopes. Their results demonstrated that storm surges tend to increase with TC size and that this relationship becomes increasingly pronounced for shallow coastal waters. Regarding the effect of TC translation speed on the storm surge, an investigation of the Louisiana–Texas coasts (US) by Rego and Li (2009) revealed that slower TCs (with a translation speed of 12.6–18.0 km h−1) cause more extensive flooding, while faster TCs produce higher surges but with comparatively less flood volume. Sebastian et al. (2014) found that storm surge behavior in a small water basin, such as Galveston Bay (US), is highly sensitive to the local wind direction associated with TC landfall location. These findings support the conclusion of our recent work (Islam and Takagi 2020a), in which we showed that storm surge characteristics in a semi-enclosed bay, such as Tokyo Bay in Japan, is largely sensitive to the landfall location, local wind direction, translation speed, and storm size. Therefore, assessing whether TC meteorological parameters influence storm surge hazards over time at a specific location is also necessary. Specifically, this allows us to investigate the association between temporal variations of surge hazards and surge-sensitive TC meteorological parameters including intensity, size, translation speed, and track.
The Western North Pacific (WNP) basin is the most active area on Earth for TCs, as approximately one-third of the world's TCs develop in the region (Elsner and Liu 2003). The WNP basin includes the Greater Tokyo Area, Central Japan [34–36°N, 137–141°E; Fig. 1], which is one of the largest and busiest coastal urban areas in the world (United Nations Population Division 2018), where TC-induced storm surge poses a considerable threat to millions of coastal inhabitants (Islam et al. 2018). Swiss Re (2013) ranked 616 cities worldwide in terms of their potential risks for natural disasters, including TCs and storm surges, and reported that the Greater Tokyo Area is subject to the highest risks. Although the TC landfall frequency is not very high in Central Japan compared with that of southwestern Japan (Islam and Takagi 2020a), strong TCs sometimes reach the central coast of Japan, causing billions of dollars in damage to the infrastructure (Japan Meteorological Society 2020a). Among the major TCs that have directly affected this region over the past century, a TC in 1917 (known locally as Typhoon Taisho) was the most devastating. The storm surge induced by this typhoon claimed 1,301 lives, destroyed 43,083 houses, and swept away 8,220 marine vessels (Omori 1918). In modern times, most of the coastal areas of Japan, including those of the central coast, are protected from storm surges by coastal dikes. However, the tidal observation periods were short, the required dike heights were not appropriately determined (Torii and Kato 2004). In addition, the coastal embankment height in the bay (i.e., Tokyo Bay) did not sufficiently consider high waves caused by a rare but strong TC, and thus, the structural design height tended to be underestimated (Takagi and Takahashi 2021). Thus, there is uncertainty regarding whether the urban waterfronts of Tokyo and its neighboring cities are sufficiently resilient against future powerful TCs (Islam et al. 2018). Concerns about TCs and storm surge impacts have considerably increased among the local population since Typhoons Faxai and Hagibis hit the Greater Tokyo Area in 2019. These two typhoons caused severe coastal damage and were classified as the strongest typhoons since the Japan Meteorological Agency (JMA) typhoon database was created in 1951 (Shimozono et al. 2020; Takagi et al. 2020). Yamaguchi and Maeda (2020a) showed that the number of TCs, including stronger storms approaching the central coast of Japan, including Tokyo, has a decadal increasing trend since 1980. They also determined that the translation speeds of TCs have decreased from 1980 to 2019, which indicates that Tokyo and its surroundings experienced TC effects of longer duration over time (Yamaguchi and Maeda 2020b). These recent studies and TC events raise questions regarding whether the magnitude of the storm surge that has affected Tokyo and its neighboring cities has increased recently and whether changes in the storm surge hazard potential are larger than previously determined. Currently, there is no study that has examined long-term storm surge observations and factors that influence surge hazards in the central coast of Japan.
This study examines changes in storm surge hazards in the central coast of Japan since 1980 in terms of temporal variations in storm surge heights and statistically investigates factors that influence surge magnitudes. We also inspected changes in the TC tracks and their potential influence on storm surge variations. We used tidal records from 10 tidal stations and best track information for TCs that made landfall around the central coast of Japan. As a secondary objective, we also investigate the applicability of a storm surge index, the storm surge hazard potential index (SSHPI), proposed by Islam et al. (2021), in this region.
In this study, we considered a period spanning from 1980 to 2019 and obtained TC best track data from the JMA archives, including data pertaining to TCs that originated in the WNP and made landfall around the central coast of Japan (Japan Meteorological Society 2020a). The best track data acquired during the pre-satellite era (i.e., before 1980) contain heterogeneities and large uncertainties regarding quality (Chan 2019; Moon et al. 2019) and were therefore ignored. Although the time period processed was relatively short, the period of 1980–2019 was the longest period covered by the JMA best track dataset that has uniform data quality. Data collection was limited to TCs with a maximum sustained wind speed (Vmax) greater than 17 m s−1 (33 kt) that made landfalls in the central coast of Japan. This target area is bounded in latitude by 34°N and 37°N, and longitude by 137°E and 141°E (Fig. 1). It includes major coastal cities including Tokyo, Yokohama, Chiba, Hamamatsu, Shizuoka, Shimoda, Katsura, and Choshi. Adopting a wind intensity threshold is required because TCs are not always powerful (i.e., tropical depressions) and may not produce noticeable storm surges; thus, it would be more meaningful to focus on tropical storms (34 kt ≤ Vmax ≤ 63 kt) or stronger TCs (i.e., categories 1, 2 in the Saffir–Simpson Hurricane Wind Scale) for disaster risk management. Based on these criteria, 36 TCs were selected for analysis (Fig. 1). These TCs were further divided into two categories based on their landfall locations as follows: open coastlines (directly facing the Pacific Ocean) and bay areas (regions surrounded by two land areas that form a concave section of coastline). Of the 36 TCs, 10 made landfalls on open coastlines. The remaining 26 TCs made landfalls between open coastlines and bay areas and affected both regions. Among the 36 TCs, 19 and 12 impacted more than one tidal station located on the open coastlines and bay areas, respectively. As a result, there were 72 and 90 available storm surge cases for open coasts and bay areas, respectively, for a total of 162 cases.

All TCs that made landfall (as per the criteria considered for the selection of TCs) around the central coast of Japan [34–36°N, 137–141°E] in 1980–2019 (Japan Meteorological Agency 2020a). The black-colored box indicates the area of interest.
We analyzed best track TC central positions, intensities, sizes, and translation speeds at the landfall time frame (T) because storm surges tend to be amplified at the time of landfall. However, the TC characteristics during the landfall time frame are not necessarily the most adverse conditions to cause the largest storm surges on coasts. For example, storm surges would take the largest value when the TC track is closer to the bay. In this study, we considered TC landfall time rather than the time closest to each tidal station as a representative condition for causing a peak surge because (a) TC characteristics (i.e., intensity, size, translation speed) after landfall differ from those over the ocean, and thus, the TC information over land is considered less reliable (Huang et al. 2021); (b) although the recent TC best track contains more detailed information about when a TC approaches the land, the JMA best track has historically provided TC information at 6-h intervals, making it difficult to identify the time of closest approach to a station; (c) in the current dataset, 26 of 36 TCs affected both open coasts and bays, and storm surge information was recorded for more than one tidal station for those TCs. Thus, a unique characteristic (i.e., landfalling TC intensity) for each storm can provide a simple basis for statistical analysis.
According to the JMA (Japan Meteorological Society 2020b), TC landfall is identified when the center of a TC reaches the coastline of the mainland (Honshu, Hokkaido, Kyushu, Shikoku) in Japan. We detected the approximate landfall point at which a TC track intersects a coastline using vector data provided by the Geospatial Information Authority of Japan (2021). Figure 2 shows TC landfall points (n = 36) along the coasts of Central Japan. The translation speed at time T (T = landfall time frame) was calculated using the TC central positions at T and T − 6 h. Among the 36 TCs, translation speed, intensity, and size data for 6 of them were not available at T. Hence, estimations for the 6 TCs were obtained via linear interpolation of the available data from immediately before and after landfall. The bathymetry of the target region was obtained from the Japan Oceanographic Data Center (JODC), Japan Coast Guard (Japan Oceanographic Data Center 2020a).

TC landfall points (as per the criteria considered for the selection of TCs) along the central coast of Japan in 1980–2019.
Figure 3 shows the 10 JMA and Japan Coast Guardoperated tidal stations (Japan Meteorological Society 2020c; Japan Oceanographic Data Center 2020b) used to estimate the peak storm surge for each TC. However, it needs to be noted that the observed tidal records are hourly, and thus, the surge records used in this study are not necessarily exact peak values. Among many operational stations, data collection was limited to those that satisfied the following five criteria: (a) fell to the right side of a selected TC track and located within the range of radius of 50 kt wind (R50; during TC landfall time frame); (b) located on an open coast-line or in a bay (stations on islands were excluded); (c) JMA-predicted astronomical tide data were available (Japan Meteorological Society 2020d); (d) elevations of the observation reference plane and the astronomical tide table reference plane were available; and (e) no data gaps occurred when a TC traversed over the station. Five stations were selected from open coastlines (Maisaka, Omaezaki, Irouzaki, Mera, and Choshi), and five were selected from semi-enclosed bays (Shimizuminato, Uchiura, Yokohama, Tokyo, and Chiba). Figure 3 provides details of the selected tidal stations. Notably, wave set-up is often the dominant driver for generating storm surge in some selected tidal stations (e.g., Omaezaki, Irouzaki, and Mera); however, this influence was not considered to keep the analysis simple. Sea-surface anomalies were defined as the storm surge magnitude (in cm in this study) and were estimated by deducting the predicted astronomical tide from the observed storm tide.

Location map of the tide observation stations (a) Maisaka, Omaezaki, Shimizuminato, Uchiura, and Irouzaki; (b) Yokohama, Tokyo, Chiba, Mera, and Choshi (Japan Oceanographic Data Center 2000a; Japan Aerospace Exploration Agency 2015; Japan Meteorological Agency 2020a). TC tracks represent TCs that affected the study area in 1980–2019 (as per the criteria considered for the selection of TCs).
TC-induced annual storm surge hazard potential at T (T = landfall time frame) was calculated to demonstrate how the factors influencing storm surge hazard potentials have changed over the last 40 years. It was estimated for all TCs using the SSHPI (Islam et al. 2021). The SSHPI incorporates meteorological parameters sensitive to storm surge, including TC intensity, size, and translation speed, along with coastal geometry (open coasts and bays) and regional scale bathymetry into a single measure of the expected surge hazard potential along the coast. The effectiveness of the SSHPI for predicting peak surge hazard potential was discussed in Islam et al. (2021). A detailed definition of SSHPI is provided in the Appendix. TC best track data were used to calculate the SSHPI for each storm. Table 1 shows the predictors used in the SSHPI calculation. TC conditions at T were used to estimate SSHPI; therefore, it does not necessarily indicate adequate storm surge heights, especially when landfall points are far from the selected tidal stations.

The storm surge and surge hazard potential time series were calculated based on annual mean storm surge heights and annual mean SSHPIs from 1980 to 2019. We divided the 40-year dataset into two subperiods, 1980–1999 and 2000–2019, hereafter referred to as P1 and P2, respectively. The temporal changes in storm surge height and SSHPI were estimated by linear regression. The percentage change was calculated by dividing the difference between the last and first points of the best-fit line by the first point. The two-tailed Student's t-test was used to determine whether the means of any two sets of data were significantly different. The p-values of the regressions and t-test statistics were calculated based on the two-tailed 95 % confidence-level test.
The time series of annual mean storm surge heights is shown in Fig. 4a. A highly significant increase in storm surge height of +41 % occurred per decade from 1980 to 2019. Annual mean storm surges of 24 cm and 55 cm occurred in the central coast of Japan in P1 and P2, respectively. The difference between the periods is statistically significant at the 95 % level. A similar increasing tendency (+40 % per decade from 1980 to 2019) was observed for the dataset comprising annual peak storm surge heights (Fig. 4b). At least one storm surge event with a peak surge height of ∼ 100 cm occurred annually since 2011 in Central Japan. In terms of the criteria considered in this study (see Section 2 for the definition of TC landfall), P1 contained 11 years when no identifiable storm surge occurred in Central Japan (1980, 1982, 1984, 1986, 1987, 1988, 1992, 1994, 1995, 1996, and 1999). In contrast, P2 contained only 4 years without a storm surge occurrence (2003, 2006, 2008, and 2010). Such differences in the TC landfall frequency appear to contribute to a larger storm surge tendency in P2 than in P1. However, a significant change was also evident in the years with storm surge events. To test the robustness of the statistics presented here, particularly the outliers, the results were reaffirmed using the L1 norm (not shown) in place of the ordinary least-squares (L2) norm. A slight change was observed, but none of the significant changes from the L2 regression became insignificant.
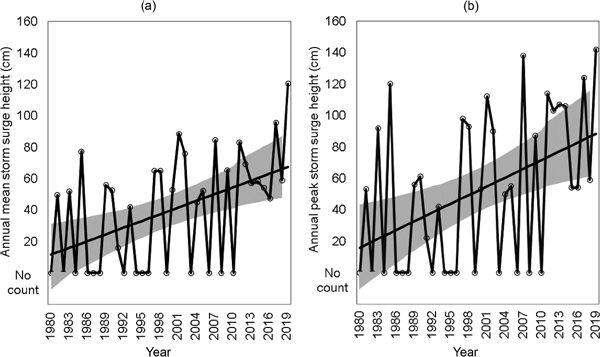
Time series of (a) annual mean storm surge height (cm); (b) annual peak storm surge height (cm) along the central coast of Japan over 40 years (1980–2019). Gray shading indicates the two-sided 95 % confidence bounds around the linear regression line. The difference in the storm surge height averaged over 1980–1999 and 2000–2019 is statistically significant at the 95 % level.
The distribution of storm surge events exhibited a clear shift toward greater heights during P2, and the differences were significant throughout most of the distribution (Fig. 5). For example, there was a significantly higher probability of larger storm surges of more than 95 cm during P2, but a significantly higher probability of smaller storm surges of less than 65 cm during P1. In other words, the occurrence frequency of significant storm surges (i.e., > 95 cm) in the study area was higher in P2 (eight times) than in P1 (twice). It needs to be noted that the present analyses are limited for the specified target area; if storm surge information for other regions had been included, the surge characteristics for Central Japan coast could be different.

Change in the annual mean storm surge distribution along the coast of Central Japan. The changes are shown between P1 (1980–1999) and P2 (2000–2019). Error bars show two-sided 95 % confidence intervals.
Figure 6 shows the spatial distribution of storm surge statistics between P1 and P2 at the 10 tidal stations. While an overall increase in storm surge height was evident at all stations, a statistically increase tendency was more pronounced at four stations (Harumi, Chiba, Yokohama, and Mera) in Tokyo Bay. The magnitude of the change indicates that storm surge heights in Tokyo Bay increased by an average of +45 % per decade, which is 4 % larger than the overall increase (+41 %) observed along the Central Japan coasts, including Tokyo and its' neighboring cities (considering all 10 stations). Only one case shows the storm surge exceeded 100 cm in Tokyo Bay during P1, in contrast with six events recorded during P2, including four in the last decade. Additionally, similar significant increases in storm surge heights were evident along open coasts (+33 % per decade; considering five stations on open coastlines) and in semi-enclosed bays (+44 % per decade; considering five stations in bays).

Spatial distribution of storm surge change statistics between P1 (1980–1999) and P2 (2000–2019) along the coast of Central Japan.
Table 2 shows the differences in the TC parameters that can influence surge magnitude, including wind speed, TC size, and translation speed at the landfall time, between P1 and P2. TCs during P2 had greater influence on greater storm surge generation than those in P1 due to their stronger wind speeds and larger sizes. Differences in wind speed and size between P1 and P2 were statistically significant at the 95 % level. Although landfalling TC translation speeds during P2 decreased by ∼ 5 % compared with P1, this difference was not statistically significant. This finding contrasts with those of Yamaguchi and Maeda (2020b), who found a significant decrease (36 %) in the translation speed of approaching TCs in the central coast of Japan. However, Yamaguchi and Maeda's (2020b) findings were valid for the selected approaching TCs (including those that did not make landfall) in September over the last 40 years (1980–2019). In this study, we considered all the TCs that made landfall in any month (the selected 36 TCs made landfall between June and October) during the same 40-year period.

Figure 7 shows the occurrence frequency of the TCs that made landfalls in Central Japan coast as a function of their wind intensities, sizes, and translation speeds at the time of landfall. Note that the occurrence frequency is not equal to the total number of TCs as it indicated the number of landfalling TCs that fulfilled the criteria used in this study (n = 36; see Section 2, data and methods for the selection of TC). The occurrence frequencies of TCs with Vmax > 60 kt during P1 and P2 were 0.15 year−1 and 0.75 year−1, respectively (Fig. 7a). Thus, the probability was five times higher for a TC to affect Central Japan during P2 than during P1, i.e., the frequency of strong TCs has increased over time. This finding is consistent with those of Yamaguchi and Maeda (2020a), who found that the frequency of strong TCs with a central pressure of less than 980 hPa that approached the coast of Central Japan increased by 2.5 times. Figure 7b shows that the occurrence frequencies during P1 and P2 in the R50 ≤ 40 nautical miles (NM) bin were 0.3 year−1 and 0.35 year−1, respectively. In contrast, TCs with R50 > 70 NM had five times more likely to affect the central coast of Japan during P2 compared with P1. No clear changes in frequency were observed in terms of TC translation speed during the last 40 years (Fig. 7c). It needs to be noted that the statistics presented in Fig. 7 are based on low-frequency TC events (lower than one per year); therefore, the likelihood of over- or underestimation is not negligible.

Average annual number of landfalling TCs (as per the criteria considered for the selection of TCs) along the coast of Central Japan in 1980–2019 as a function of the (a) maximum sustained wind speed (kt); (b) radius of 50 kt wind (NM); and (c) translation speed (km h−1) at the landfall time frame.
This study aimed to determine whether there have been significant changes in the storm surge hazards in the central coast of Japan in the last 40 years by examining TC parameters that can influence the surge hazard in addition to the storm surge magnitudes. We have shown in the previous section that surge-sensitive TC parameters, including intensity and size, have changed from 1980 to 2019. It is important to quantify the contribution of those parameters on the increasing surge magnitude, as shown in Section 3. Therefore, we applied SSHPI (Islam et al. 2021) to demonstrate the statistical sensitivity of each TC parameter in changing surge hazards.
Figure 8 shows the annual mean SSHPIs at the time of TC landfall and the annual mean storm surge heights for the central coast of Japan. SSHPI takes into account surge-sensitive TC meteorological parameters; thus, it can be used to quantify hazardous surge events by varying the parameters. The correlation coefficient of 0.825 indicates a strong positive correlation between annual mean SSHPI and mean storm surge height. This result supports the analysis by Islam et al. (2021), in which SSHPI was shown to be strongly correlated with actual surge heights observed throughout Japan. The SSHPI time series exhibited an evident increase of +61 % per decade from 1980 to 2019, which is similar to the decadal storm surge increasing (+41 %) tendency. It needs to be noted that SSHPI underestimated observed surges in P1, which caused the difference between the overall increasing tendency by SSHPI and that of the observed storm surges. A similar increasing tendency was observed for both the open coastlines and semi-enclosed bays (not shown). Annual mean SSHPIs of 0.21 and 0.71 were obtained for P1 and P2, respectively. The difference between these SSHPIs is statistically significant at the 95 % level, indicating that the increase in the SSHPI during P2 is unusual, with a large upswing in surge heights observed particularly in the last decade (2010–2019). This increase in the SSHPI and surge height may result from the more intense and larger TCs that occurred in this period.

A measure of the storm surge hazard potential by TCs that affected the central coast of Japan compared with the annual mean storm surge height in 1980–2019.
There are reasons to believe that the changes in TC intensity and size have influenced the storm surge and SSHPI. Table 3 presents our attempt to quantify the contributions of the TC meteorological parameters to the storm surge variations. For this calculation, we individually changed each SSHPI parameter, or sets of parameters, to their P2 values, and maintained the other parameters at their P1 averages (Table 2). Changes in TC intensity and size contributed 35 % and 32 %, respectively, to the overall increase in surge height. Furthermore, their joint contribution may be responsible for as much as 79 % of the surge variance. Figure 9 shows similar findings by comparing surge height with the time series diagram of the surge index, which reduces the number of predictors from the SSHPI into the following three patterns: (a) Vmax; (b) Vmax and R50; and (c) Vmax, R50, and TC translation speed (S). Although surge variance decreases slightly (9 %) by the combined influence of wind intensity, size, and translation speed than that of wind intensity and size, the influence of translation speed in storm surge studies is not negligible (Rego and Li 2009; Islam and Takagi 2020b; Islam et al. 2021). Nevertheless, it becomes clear from Table 3 and Fig. 9 that changes in TC intensity (Vmax) may have played the most significant role in the increase in SSHPI and storm surge magnitudes from 1980 to 2019, followed by changes in TC size (R50). This finding is consistent with the findings of Islam and Takagi (2020a, c), who numerically showed that, at a constant TC wind intensity, the storm surge heights in Tokyo Bay increased linearly as the TC size increased, possibly because a large swath of strong winds can affect a larger ocean area for a longer period, inducing larger storm surges. Thus, the observed increases in storm intensity and size shown in Table 2 and Fig. 7 have contributed to the increases in surge height and SSHPI.


Comparison between annual mean storm surge heights observed along the central coast of Japan during 1980–2019 and possible contribution of TC meteorological parameters in SSHPI. See also Table 3.
We also inferred the reasons for the increase in storm surge magnitude by analyzing the differences in the TC tracks between P1 and P2. Six-hourly TC best track positions, along with intensity information of landfalling TCs, were analyzed at each grid point from 34°N to 37°N and from 137°E to 141°E, at 1° intervals (Figs. 10a, b). The ratios of the changes in landfalling TC frequency for each grid point (i.e., the ratio of the number of TC central positions in P2 to P1) are shown in Fig. 10c. An overall increase in TC activity is evident in the grids covering the coast of Central Japan. One remarkable feature is a statistically significant increase in TC activity close to Tokyo Bay near [34–36°N, 139–140°E] during P2. In other words, the occurrence frequency of more northeastward TC tracks that impacted Tokyo's shallow coastal areas (Fig. 3b) increased during P2 compared with that during P1 (Figs. 10c, 2). A significant number of TCs of greater intensities (i.e., Vmax ≥ 64 kt) impacted Tokyo Bay during P2, whereas such TCs occurred at low frequencies during P1 (Figs. 10a, b). Although the storm surge increasing tendency is independent of the TC frequency (discussed in Section 3), changes in the occurrence frequency of more northeastward TC tracks can be regarded as the third most influential factor after Vmax and R50. Therefore, the large increase in surge magnitude, particularly inside Tokyo Bay (Fig. 6), over the past 40 years, may be attributed to the combined influence of TC intensity, size, and track change.

Landfalling TC six-hourly best track position along with intensity information bounded in latitude by 34°N and 37°N, and longitude by 137°E and 141°E. (a) 1980–1999; (b) 2000–2019; (c) change in the landfalling TC activity (the number of TCs central position in 2000–2019 divided by that in 1980–1999; green colored number) in each grid.
Based on observational data, the present study demonstrates that storm surge heights in the central coast of Japan, including those in Tokyo, have increased significantly from 1980 to 2019. The SSHPI increased more than three times from P1 to P2, which suggests that the changes in both TC intensity and size at the time of landfall played a significant role in increasing storm surge magnitudes. This finding is consistent with the observation that TCs have become stronger and larger during P2 compared with those during P1. Additionally, the increase in occurrence frequency of TCs with more northeastward tracks contributed to the increase in surge hazards.
This study suggests that the coast of Central Japan is likely to experience increasing numbers of extreme storm surge events in the future if the current increasing tendency continues. The coastal flooding of Tokyo and its neighboring cities can substantially affect the Japanese economy because much of the Japanese GDP is concentrated in the Greater Tokyo Area. Thus, our findings are valuable for disaster risk managers, coastal engineers, climate change scientists, and governmental bodies attempting to mitigate the storm surge risk in coastal urban areas. The SSHPI can help explain variations in surge events on regional and local scales, such as the area targeted in this study.
The analyses presented in this study do not intend to assess the contribution of global warming and climate change to the increasing storm surge tendency. The difference between P1 and P2 could be regarded as a trend associated with global warming, and several recent studies have projected, with high confidence, that the sea-level rises that accompany warming will lead to higher storm inundation levels (e.g., Knutson et al. 2019, 2020; Mori et al. 2021). However, Yamaguchi and Maeda (2020a) reported that this difference may not be distinguishable in the interdecadal variability of such a short period (i.e., 40 years). In addition, significant interdecadal variations exist in TC activity in the WNP basin (i.e., Chan 2015; Li and Zhou 2018). Thus, further research should include quantitative evaluations of the contributions of global warming and interdecadal variations to the increasing storm surge tendency using numerical simulations.
This study statistically quantifies the contribution of TC meteorological parameters in changing surge hazards. In particular, we have discussed the possible contribution of TC wind speed, size, and track in changing surge hazards in the coast of Central Japan; nonetheless, other factors such as air pressure and wave set-up can also modulate surge hazards. The physical meaning of these influential factors remains unknown. The present analyses can be improved further by improving the current data quality in terms of time and spatial coverage.
Observed storm tide data can be downloaded from the JMA (https://www.data.jma.go.jp/kaiyou/db/tide/genbo/index.php) and JODC (https://jdoss1.jodc.go.jp/vpage/tide.html) websites. Predicted tide data can be obtained from the JMA (https://www.data.jma.go.jp/kaiyou/db/tide/suisan/index.php) website. TC best track data can be derived from the JMA (https://www.jma.go.jp/jma/jma-eng/jma-center/rsmc-hp-pub-eg/trackarchives.html) website. The data analysis files are available in J-STAGE Data. https://doi.org/10.34474/data.jmsj.19200350.
The first author is thankful to the Ministry of Education, Culture, Sports, Science, and Technology (MEXT) of Japan for the provided scholarship to conduct research in the field of disaster risk reduction. This study was conducted while the first author was participating in the internship at the Atmosphere and Ocean Research Institute, The University of Tokyo. The authors are grateful to Dr. Munehiko Yamaguchi, Japan Meteorological Agency, for providing the approached TC number information for the Tokyo area (1980–2019). This research was funded by the grants awarded to the Tokyo Institute of Technology (Japan Society for the Promotion of Science, 16KK0121 and 19K04964). This work was also partially supported by a grant awarded to Md. Rezuanul Islam (The Obayashi Foundation: Overseas Practical Training Grant). No potential conflict of interest was reported by the author(s).
The SSHPI is a dimensionless and continuous surge index. It is defined as
 |
The mathematical equation for the SSHPI (Eq. 1) adopts and modifies those previous surge indexes, specifically, the hurricane surge index (HSI; Eq. 2; Kantha 2006, 2008) and surge scale (SS; Eq. 3; Irish and Resio 2010), and further adds a coastal geometry parameter (a) and TC forward speed information (S) (Islam and Takagi 200b).
 |
 |
 is the ratio of the storm size to L30m and Ψx is the dimensionless storm size function to adjust that ratio. Vref and Rref in Eq. (2) are the climatological reference constants: 33 m s−1 and 96.6 km.
The SSHPI (Eq. 1) and HSI (Eq. 2) have quadratic dependence to Vmax because wind momentum input at the water surface is proportional to V2max. The linear dependence of surge indexes on the storm radius is due to the fact that the storm surge impact is most often confined to a broad but roughly linear strip along the coastline (Kantha 2008). Another underlying assumption is that integration of storm size and wind strength over the footprint of the TC provides a bulk amount of energy/momentum transferred from the storm to the water column, and thus, the total water level functionally depends on the velocity and storm radius (Islam et al. 2021). Furthermore, the relationship between R50 and storm surge forecasting has been discussed in many prior studies (e.g., Takagi and Wu 2016; Klotzbach et al. 2020; Islam and Takagi 2020a). The linear dependence of the SSHPI on the TC forward speed is two-fold. First, in semi-enclosed bays, the effective cross-shore shallow area over which TC winds act is larger and the time scale for mass redistribution (to generate a sea-surface slope) is on the order of hours, which is longer than along the open coasts. Thereby, with cross-shore wind stress components, a slower TC has more time to interact with the seawater and pushes more into shallow areas of a bay (Mastenbroek et al. 1993; Weisberg and Zheng 2006; Islam and Takagi 2020a, b). In contrast, in the open coastlines, it is plausible that a fast-moving TC would energize a shelf wave and cause an increased storm surge because the TC translation speed tends to coincide with the long-wave propagation speed (Proudman 1953; Rego and Li 2009). L30m is used in Eqs. (1) and (3) because Irish and Resio (2010) and Chavas et al. (2013) have reported that L30m is an optimal characteristic length scale for storm surge generation in the US coasts.
A stationary or very slow-moving TC (i.e., S = 5 km h−1) would result in very low SSHPI values (using Eq. 1) on the open coast and extremely high values in semi-enclosed bays (and vice-versa). A TC of a very large size (i.e., R50 = 170 nm) would also result in very high SSHPI values (and vice-versa). Such TCs are infrequent in Japan, but can sometimes occur elsewhere. Compared with Vmax and L30m, the upper and lower bounds of TC size  and forward speed
  in Eq. (1) restrict their contribution in generating surge hazards and, thus, prevent discrete jumps in the SSHPI. In this study, the reference constants (Vref, Rref, and Sref) represent a baseline TC event that occurs relatively frequently. This suggests that large (i.e., R50 > 95 nm) and quickly moving (i.e., S > 35 km h−1) intense (i.e., Vmax > 50 kt) TCs will generate a larger storm surge along open coasts, whereas bays are more susceptible to large, slowly moving (i.e., S < 35 km h−1) intense TCs.
Furthermore, the SSHPI does not directly consider the inverse barometer effect and the influence of the TC approach angle, waves, and astronomical tide, to keep the SSHPI simple. Thus, the SSHPI will tend to somewhat underestimate/overestimate the total surge height for some TC events. This limitation is particularly relevant in open coasts, where wave set-up and inverse barometer effect are often the dominant drivers behind storm surge and coastal flooding. SSHPI was derived to explain distinctive surge characteristics between open coasts and bays. On the other hand, the prediction with SSHPI was not fully verified for locations in the middle point of a bay and open coast. Furthermore, a very steep coast (i.e., L30m = 0.5 km) would result in a low SSHPI value (using Eq. 1); however, a strong TC could still cause a significant storm surge (Islam et al. 2021). Lastly, the SSHPI is largely dependent on the quality of the input parameters. The correlation statistics for the SSHPI shown in this study will improve as the uncertainties (Landsea and Franklin 2013) associated with the TC information become smaller.
Observed storm tide data can be downloaded from the JMA (https://www.data.jma.go.jp/kaiyou/db/tide/genbo/index.php) and JODC (https://jdoss1.jodc.go.jp/vpage/tide.html) websites. Predicted tide data can be obtained from the JMA (https://www.data.jma.go.jp/kaiyou/db/tide/suisan/index.php) website. TC best track data can be derived from the JMA (https://www.jma.go.jp/jma/jma-eng/jma-center/rsmc-hp-pub-eg/trackarchives.html) website. The data analysis files are available in J-STAGE Data. https://doi.org/10.34474/data.jmsj.19200350.