Abstract
Twentieth-century atmospheric reanalysis datasets are important for understanding climate in the early era of the century. This paper first compares two sets of the 20th-century atmospheric reanalyses, the NOAA-CIRES-DOE 20th-Century Reanalysis Version 3 (20CRv3) and the European Centre for Medium-Range Weather Forecasts (ECMWF) 20th-Century Reanalysis (ERA20C), as far as the summer low-level cross-equatorial flows (CEFs) over the Asian-Australian monsoon region are concerned. The results show evident regional differences in the intensity of individual branches of CEFs between the two reanalyses despite an overall agreement in the climatological seasonal mean and variability. At the interannual timescale, significant differences are observed prior to 1925 and in the 1940s. During the two periods, there are often opposite variations in Somali CEF in the two datasets, along with obvious different amplitudes in the Bay of Bengal (BOB) and Australian CEFs. At the interdecadal timescale, the two datasets have different periodicities in Somali CEF and have a greater fluctuation of BOB CEF after 1925 in ERA20C than 20CRv3, as well as an opposite decadal variation in the Australian CEF prior to 1940 and in the 1960s. As for the long-term trend, both the Somali and BOB CEFs exhibit intensification in both the datasets, but the intensification amplitude is bigger in 20CRv3 than in ERA20C for Somali CEF; the Australian CEF exhibits a weakening trend in both the datasets but is less evident in 20CRv3. To figure out which of the two datasets is relatively more reliable, the observed cross-equatorial meridional gradient of sea-level pressure index and the Indian summer monsoon rainfall index, which both have longer instrumental records, are used as benchmarks to validate the CEFs in view of their close connections. The results indicate that ERA20C is more reliable and thus more suitable for investigating decadal climate variability of the 20th century across the hemispheres.
1. Introduction
Atmospheric reanalysis produces datasets for synoptic and climate research through a fixed data assimilation system and atmospheric general circulation model ingesting all available observed variables every several hours. It provides an estimate of the climate state at each time step, and the variable outputs from the system are dynamically consistent with one another. The reanalysis datasets are thus an important resource for the research community (Deng et al. 2010; Zhao et al. 2010).
The first generation of atmospheric reanalysis dataset was developed in the mid-1990s by the joint efforts of the National Centers for Environmental Prediction (NCEP) and the National Center for Atmospheric Research (NCAR) (NCEP/NCAR) (Kalnay et al. 1996), which extended back to 1948 and continues to the present. During the recent decades, various global atmospheric reanalysis products have been developed, including the fifth-generation atmospheric reanalysis (ERA5) (Hersbach et al. 2020) and the interim reanalysis (ERA-Interim) (Dee et al. 2011) from the European Centre for Medium-Range Weather Forecasts (ECMWF), the second version of the Modern-Era Retrospective Analysis for Research and Applications (MERRA-2) (Gelaro et al. 2017) from the National Aeronautics and Space Administration, Climate Forecast System Reanalysis (CFSR) (Saha et al. 2010) from NCEP, Japanese 55-year Reanalysis (JRA-55) (Kobayashi et al. 2015) generated by the Japan Meteorological Agency, and the Global Atmospheric Reanalysis (CRA-40) (Wang et al. 2018) from the China Meteorological Administration. The length period of most of these datasets covers just after 1950, especially after 1979 when the satellite era began. However, as the decadal variability issues gain increasing attention due to their involvement in global warming, a demand for longer observational series beyond decades has become more and more urgent. Thus, researchers began to develop century-long reanalyses.
There are three sets of century-long reanalyses: the first is the NOAA-CIRES-DOE 20th-Century Reanalysis (20CR) (Compo et al. 2011), which assimilates the surface pressure and extends the period to 1836 as well as updates the latest version, 20CRv3 (Slivinski et al. 2019). The other two are from the ECMWF, including the ECMWF 20th-Century Reanalysis (ERA20C) (Poli et al. 2016) and the ECMWF Coupled 20th-Century Reanalysis (CERA20C) (Laloyaux et al. 2018). All the two ECMWF datasets have a period spanning from 1900/1901 to 2010. Among them, ERA20C assimilates surface and mean sea-level pressures as well as marine surface winds; CERA20C uses the coupled model, which simultaneously ingests atmospheric and ocean observations. These century-long reanalyses are used for various climate researches (Bett et al. 2017; Polonskii et al. 2017; Stankunavicius et al. 2017; Welker and Martius 2014). However, the results when using different reanalyses are often inconsistent with each other. For example, the wind speeds in the North Atlantic and North Pacific in ERA20C and CERA20C exhibit a significant increasing trend, but no obvious trend is observed in 20CR (Wohland et al. 2019). Correspondently, there is an obvious upward trend in the Arctic Oscillation mode and wind speed along the northern storm path due to a biased weakening trend in the sea-level pressure over the Arctic in ERA20C (Bloomfield et al. 2018; Rohrer et al. 2019). Furthermore, ERA20C and 20CR show a difference in the trend of extratropical cyclones and storms even in their signs and magnitudes (Befort et al. 2016). There is an inconsistency in the regional extreme precipitation trend among them (Donat et al. 2016). All these differences pose a challenge to decadal studies: which reanalysis is more reliable and which dataset can be selected for use. Therefore, assessing the quality of the available century-long reanalyses is important.
On the other hand, as the exchange channels of momentum, water vapor and energy across the hemispheres, cross-equatorial flows (CEFs) over the Asian-Australian monsoon region play a significant role in global teleconnection (Wang and Xue 2003; Zurita-Gotor 2020) and Asian monsoon climate (Fan et al. 2018; Jain et al. 2021; Lei and Yang 2008). They are also important for global climate (Hoskins et al. 2020; Zeng and Li 2002). There are primarily three branches of CEFs in boreal summer in the lower atmosphere of the Asian-Australian monsoon region (Fig. 1), namely, the Somali CEF, the Bay of Bengal (BOB) CEF, and the Australian CEF from west to east. The Australian CEF is composed of three sub-branches, i.e., the South China Sea, Celebes Sea, and New Guinea subbranches, respectively. Among them, Somali and BOB CEFs supply a majority of moisture for the South Asian summer monsoon (Halpern and Woiceshyn 2001), which can induce a drought or flood. They also influence the East Asia summer monsoon by providing partly water vapor and contributing to the eastward withdrawal of the Northwest Pacific subtropical high (Gao and Xue 2006; Li and Wu 2002). The variation of Australian CEF is directly related to the outbreak of the South China Sea summer monsoon, adjusting the advance and retreat of the Northwest Pacific subtropical high and then affecting the distribution of the rain belt in East Asia (Li and Li 2014, 2016). The above three CEFs have a similar distribution of climatological mean and variability in ERA20C and 20CRv3 compared with ERA5 and NCEP/NCAR as well as JRA55 in the period of 1958–2010 (Fig. 1).
To understand the decadal variability of CEFs, century-long datasets are needed. Researchers often used two sets of the 20th-century reanalysis, ERA20C and 20CRv3, to serve this purpose (Attada et al. 2019; Huang et al. 2018; Huang et al. 2019; Prasanna 2016; Wu and Mao 2019). Although there is another reanalysis, CERA20C, it does not exhibit a significant improvement in Asian monsoon relative to ERA20C and is thus seldom used (Laloyaux et al. 2018). However, there is a large uncertainty in the quality of both ERA20C and 20CRv3 in the early stage due to the scarcity of instrumental records, particularly in the Indian Ocean (McPhaden et al. 2009), also due to the bias of both model and assimilation system used to produce the reanalysis products (Ajayamohan 2007; Martin et al. 2000; Prasanna et al. 2020). Therefore, an inter-comparison and assessment of these two reanalyses, ERA20C and 20CRv3, are needed and constitute the motivation of the present study.
2. Datasets and methods
Monthly meridional wind component is from eight reanalyses, including the 20CRv3, ERA20C, ERA5, NCEP/NCAR, JRA55, ERA-Interim, MERRA-2, and CFSR. Furthermore, the first five reanalyses also provide monthly zonal wind component. Among them, 20CRv3 is an ensemble of 80 members, which is produced by the NCEP Global Forecast System coupled atmosphere, Noah land surface, and thermodynamic ice model with the assimilation of surface pressure observations from the International Surface Pressure Databank (ISPD) (Cram et al. 2015) version 4.7. It consists of two sub-versions: 20CRv3si (1836–1980) and 20CRv3mo (1981–2015), which use different datasets as SST boundary conditions, including the Simple Ocean Data Assimilation with Sparse Input version 3 (SODAsi.3) (Giese et al. 2016) and HadISST2.2. ERA20C is a single-member reanalysis, which is produced by ECMWF's Integrated Forecast System with a coupled model of atmosphere, land surface, and ocean waves, assimilating the observations of surface and mean sea-level pressures from ISPD version 3.2.6 and the International Comprehensive Ocean-Atmosphere Data Set (ICOADS) (Woodruff et al. 2011) version 2.5.1, as well as surface marine winds from ICOADS. HadISST version 2.1.0.0 provides ERA20C's SST and sea ice boundary conditions. Both 20CRv3 and ERA20C have a horizontal resolution of 1° × 1°. Data from other six reanalyses have been regridded using a bilinear interpolation method to a horizontal resolution of 2.5° × 2.5°. In this study, summer is referred to as the period from June to August.

Because no benchmark can be referred to as a realistic observation, we use two proxies here, the cross-equatorial large-scale meridional sea-level pressure (SLP) gradient (CEPG) index over the tropical Indian Ocean and the Indian summer monsoon rainfall index (ISMR), to validate the CEFs, in view of their substantial connections with CEFs and relatively higher quality, in addition to longer availability. The SLP used is from the Hadley Centre (HadSLP2) spanning from 1850 to 2012, with a horizontal resolution of 5° × 5° (Allan and Ansell 2006). CEPG is defined as the difference of June–August averaged SLP in a southern box [5–10°S, 38–60°E] minus that in a northern box [5–10°N, 38–60°E]. Here, the longitudinal range of the two boxes corresponds to the region dominated by the Somali CEF. The rainfall dataset used to calculate ISMR is from the Indian daily rainfall data (IMD4) covering the 20th century with a horizontal resolution of 0.25° × 0.25° (Pai et al. 2014). ISMR is defined as the June–August averaged rainfall in the Indian monsoon core region [18–24°N, 76–87°E].
A common period of 1901–2010 among these two datasets is focused on. The CEF comparison is performed from the spatial distribution of climatological meridional wind components and their standard deviation, as well as the evolution of different timescale components, including the long-term trend and the interdecadal and interannual components. The long-term trend is obtained via linear regression, the interdecadal component is calculated from the 11-year running mean, and the interannual component is from a 10-year high-pass filter, respectively. The consistency between the two reanalyses is evaluated through their temporal correlation. The deviation between them is measured using the root-mean-square error (RMSE) as follows:
where
xi and
yi denote the members of samples
x and
y, respectively, and
n is the length of the sampling. Because the degree of freedom has changed after the filters, the Monte Carlo method is applied to calculate the critical value of the correlation coefficient with significance presented in
Table 1 (
Shi et al. 1997;
Zhao and Han 2005;
Thompson 1979). The significance test for the difference between the reanalyses in terms of climatological mean and standard deviations are the Student's
t-test and the
F-test, respectively.
3. Results
3.1 Differences between the two reanalyses, ERA20C and 20CRv3
The vertical distribution of climatological CEFs expressed as the meridional wind along the equator (average of 5°S–5°N) and their standard deviations are presented in Fig. 2. A consistency in both reanalyses is that the Somali CEF is obviously stronger than the BOB and Australian CEFs. Another consistency exhibits in their variability distribution, for the Australian CEF in both reanalyses has a violent fluctuation, and the Somali and BOB CEFs are relatively stable. The Somali CEF maximum is located at 850–925 hPa and the other two at 925–1000 hPa. To quantify the CEF, we refer to the longitudinal range of 38–60°E for Somali CEF, 79–94°E for BOB CEF, and the three separated longitudinal ranges of 103–113°E, 122–132°E, and 145–150°E for the three sub-branches of Australian CEF. The latitude range used to calculate CEFs is limited to 5°S–5°N.

From Fig. 2c, an inconsistency in the climatological mean CEFs is seen, in that the maximum intensity of Somali CEF is weaker in 20CRv3 than in ERA20C, along with a greater intensity in its eastern side; BOB CEF is also stronger in 20CRv3. A similarly stronger amplitude is seen in the two western sub-branches of Australian CEF in 20CRv3, along with a weaker amplitude of their eastern counterpart. The difference in the CEF variability is also evident (Fig. 2f). There is a spatial contrast in the Somali CEF as ERA20C has greater variability on the western side of Somali CEF, and 20CRv3 exhibits stronger fluctuations on the eastern side. It is opposite for the east sub-branch of the Australian CEF. The rest of the CEF branches show greater variability in 20CRv3.
To scrutinize these regional differences between the two reanalyses, we define the CEF index (Fig. 3) as the average meridional wind at 925 hPa within their corresponding range, and the Australian CEF index is the average of its three sub-branches. The Somali (Australian) CEF has a similar intensity of 8.85 m s−1 and 8.87 m s−1 (2.90 m s−1 and 2.98 m s−1) in the two reanalyses, respectively. In contrast, the BOB CEF is stronger in 20CRv3 with a value of 3.18 m s−1, whereas it is 2.70 m s−1 in ERA20C. Furthermore, the standard deviations of the BOB CEF (0.47 m s−1 and 0.46 m s−1) and Australian CEF (0.77 m s−1 and 0.80 m s−1) are very close to each other in the two reanalyses. However, the Somali CEF has greater variability in 20CRv3 as its standard deviation is 0.44 m s−1, which is greater than 0.37 m s−1 in ERA20C.
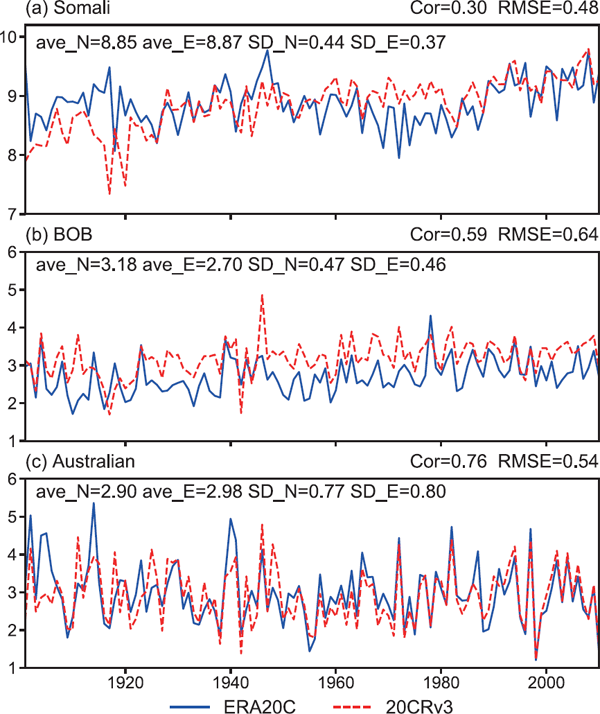
From the year-to-year evolution of three CEFs, one can see an evident inconsistency between the two reanalyses (Fig. 3), especially for the Somali CEF, which in ERA20C is stronger from 1901 to 1925 but becomes weaker during the period of 1960–1980. The BOB and Australian CEFs show an overall consistency in the two reanalyses, with the temporal correlation of 0.59 and 0.76 between the two datasets for the two CEFs, respectively. But the BOB CEF in ERA20C is constantly lower than that in 20CRv3 throughout the century, and the amplitude gap prior to 1950 in Australian CEF is still un-negligible. Moreover, all these three CEFs exhibit multi-timescale variation, which contributes to the above differences. Therefore, we investigate their difference with respect to timescales.
For the interannual timescale (Figs. 4a, c, e), there is a gap between the Somali CEFs in the two datasets but a consistency in the other two CEFs. This is also seen from their distinct correlations with the coefficients of 0.25, 0.64, and 0.80 for Somali CEF, BOB CEF, and Australian CEF, respectively. To isolate the major periods with a large gap between the datasets, an 11-year running correlation and 11-year running RMSE are calculated between the reanalyses (Figs. 4b, d, f). For the Somali CEF, there are three periods with a large gap: prior to 1925, 1945–1955, and around 2000, during which the CEF's correlations between the reanalyses are weak or even negative and the CEF anomalies are often opposite to each other in the two datasets. The large gap periods for BOB CEF are pre-1920, the 1940s, and the 1970s, respectively. For the Australian CEF, they are pre-1950 and around 1990. Nevertheless, these gaps are mainly caused by their amplitude. An overall agreement in the interannual component of these two CEFs is basically kept, which is seen from a steady correlation above the 90 % significance level throughout the whole period.

The gaps in the CEF interannual component are mainly in the period prior to 1950. This is understandable as the observations available for assimilation are relatively few (Cram et al. 2015; Hersbach et al. 2015; Woodruff et al. 2011) due to the limitations of observation technology and the impacts of World War I (1914–1918) and World War II (1939–1945). Therefore, the biases caused by models cannot be well removed to yield reality, leading to a large divergence between the reanalyses.
For the interdecadal timescale, all the three CEFs vary inconsistently in the two reanalyses (Fig. 5), albeit the consistency in Australian CEF is relatively high with a correlation of 0.51. To understand the gap in depth, the power spectrum analysis is first considered. As presented in Fig. 6, the Somali CEF in the two reanalyses displays a different variation cycle. The dominant periodicity in ERA20C is around 50 years in accompany with the positive anomalies in the periods before 1920, 1933–1952, and after 1988 and the negative anomalies in 1921–1932 and 1953–1987 (Fig. 5). In comparison, the Somali CEF in 20CRv3 has two cycles of 15–30 and 60–80 years, respectively, being in the positive phase in 1906–1910 and 1925–1975 and in the negative phase in 1911–1924 and 1976–2005. For the BOB CEF, even though it shares the same cycles of 20 and 40 years in the two datasets, there are still differences in intensity and phase period. The fluctuation in 20CRv3 becomes weak after 1925, whereas in ERA20C, the 40-year cycle lasts the whole century; the 20-year cycle is also evident before 1970. As a consequence, the interdecadal component of the BOB CEF in 20CRv3 basically stays positive from 1925 to 1990, but in ERA20C, there are two positive periods in 1936–1948 and 1973–1996 and three negative periods in 1906–1935, 1949–1972, and after 1996, respectively. The major noticeable gaps in the Australian CEF between the two reanalyses appear before 1940 and in the 1960s. In the first period, the Australian CEF in 20CRv3 displays a periodic fluctuation of 10–20 years and remains positive. However, in ERA20C, it basically stays in the negative phase and exhibits more frequent fluctuations with two cycles of 8–15 years, around 20 years. In the second period, the anomaly of the Australian CEF is positive in ERA20C but negative in 20CRv3.


For the long-term trend, both ERA20C and 20CRv3 exhibit an enhancement in the Somali and BOB CEFs but weaken in the Australian CEF (Fig. 7). As for the amplitude, the BOB CEF in both the reanalyses has the same trend of 0.5 m s−1 from 1901 to 2010, but the Somali CEF has evidently amplified intensification with the increment of 1.0 m s−1 in 20CRv3, much greater than that in ERA20C, which has the value of 0.2 m s−1. In contrast, 20CRv3 yields a smaller weakening trend in the Australian CEF with the southerly wind speed declining by 0.08 m s−1 during the 20th century, whereas the value is 0.4 m s−1 in ERA20C. In general, both the two reanalyses yield a consistent trend in all the three CEFs during the past century but with a different amplitude.
3.2 Validation of the reliability of CEFs in the two reanalyses
a. The benchmark indices for validation
The above comparison suggests that both ERA20C and 20CRv3 bear an overall consistency in the interannual component and long-term trend of the three CEFs but a substantial gap in the interdecadal component. It does not imply which one of the two reanalysis datasets is more realistic or reliable. Due to the lack of instrumental records in the early 20th century, it is challenging to validate the CEFs in these reanalyses. Therefore, we investigated the accuracy of CEFs in the two reanalyses based on climate dynamic teleconnection.
We seek proxy indicators to validate CEFs. The indicators should have a clear physical meaning and stable dynamical connection with the CEF, in addition to having a long record. It is well known that the cross-equatorial meridional gradient of SLP is the primary driver of the CEF; meanwhile, SLP (say HadSLP2) has a longer instrumental record. Thus, CEPG can act as one proxy indicator for the CEFs. Furthermore, the ISMR is significantly affected by the Somali CEF, and they bear a steady, solid correlation. Thus, ISMR can be used as another indicator for Somali CEF. Therefore, we consider these two variables and explore their feasibility as the benchmark index.
The validation is conducted by using the period of 1981–2010 during which the quality of the reanalyses is significantly guaranteed. One low-pass filter is used to obtain the CEF interdecadal component. Five reanalyses, ERA5, ERA-Interim, JRA55, MERRA-2, and CFSR, are used to derive the CEF indices. As presented in Fig. 8, one substantial consistency exists in each CEF among the five reanalyses, even if there is one tiny divergence at the late 20th century. Therefore, we take their ensemble mean as the reality of the CEFs.
Comparing the individual CEPG with the corresponding CEF index, one substantial agreement is seen in the BOB and Australian CEFs, albeit there are few discrepancies in the Somali CEF in the last several years. Thus, the CEPG index defined here is a reasonable indicator for the CEF interdecadal component.
The Indian summer rainfall is closely connected to Somali CEF because its water vapor is mainly from the transport of Somali CEF (Kumar et al. 1999; Ordonez et al. 2013; Zhu 2012). Although some studies demonstrated that factors such as mid-latitude disturbance and topographic distribution exert a significant impact on the Indian summer rainfall and lead to a considerable spatial variability (Kumar et al. 1995; Parthasarathy et al. 1993), here we consider the core area of ISMR. Figure 9 presents the spatial distribution of the interdecadal correlation between the Indian summer rainfall and the Somali CEF in the five reanalyses as well as their ensemble mean. It is easy to see that the rainfall in the Indian monsoon core region (purple box) has a strongly positive correlation with the Somali CEF. This is well reflected in previous researches, because the variation of the rainfall in this area corresponds to the active and break phases of the monsoon and is always accompanied by the intensity adjustment of the Somali CEF (Joseph and Sijikumar 2004; Rajeevan et al. 2010; Raman et al. 2011). Therefore, the ISMR index can be taken as another proxy indicator for the Somali CEF.

It is worth noting that the early air pressure observations over the Indian Ocean were relatively deficient, which affects the reliability of the Somali CEPG index. We compared it with the ISMR index and found that they verify each other (Fig. 10), with a correlation of 0.58. In comparison, the early observation over the subtropical Northwest Pacific is relatively intense, which implies a relatively greater credibility of the Australian CEPG index. Therefore, we have sufficient confidence in the reference value of these indicators, but it is slightly weaker in the BOB CEPG index.
b. Validation result
Table 2 presents a comparison of the correlations of the individual CEF indices derived from the two reanalyses with the correspondent proxy index. Visually, ERA20C outperforms 20CRv3 in all the three CEFs. This is also from one comparison of the interdecadal variation of the CEFs in the two reanalyses with the proxy index (Figs. 10, 11). Both the variations of the Somali CEPG and the ISMR index are similar to the Somali CEF index derived from ERA20C, with a cycle around 50 years, but different from that in 20CRv3. The latter has two cycles of 15–30 years and 60–80 years. Furthermore, the Somali CEF index derived from ERA20C reproduces the increase in the proxy indices in the 1920s and 1980s and the decrease in the 1960s, albeit some discrepancies exist prior to 1920 and after 1990. In comparison, the evolution of the Somali CEF index in 20CRv3 missed all these shift points after 1920.


For the BOB CEF, its decadal components in both reanalyses are less connected with the BOB CEPG index with the insignificant correlation of 0.33 and 0.17. This is verified by their different variation periodicities. The BOB CEPG index has a periodicity of 40–50 years before 1970 and then 15 years and 30 years. This is different from the BOB CEF in the two reanalyses, which both have two periodicities of 20 years and 40 years, even evident before 1930 in 20CRv3. Nonetheless, the BOB CEF derived from ERA20C is obviously different from the proxy index in the two periods. The first is 1920–1950 when the BOB CEPG index stays positive, but the BOB CEF in ERA20C exhibits a strong 20-year cycle fluctuation. Another period is after 1983, during which the BOB CEF in ERA20C is anomalously positive until 1996, whereas the BOB CEPG index turns negative in the mid-1980s but positive in the early 21st century. The only consistent period between the BOB CEF in 20CRv3 and the BOB CEPG index is after 1975.
For the Australian CEF, the CEF index derived from ERA20C and 20CRv3 resembles the Australian CEPG index unanimously with the correlation coefficients of 0.67 and 0.59, respectively. But during the two gap periods of the two reanalyses mentioned above, ERA20C shows a better consistency with the proxy CEPG index. For example, the Australian CEF index and the CEPG index have two similar cycles of 8–15 years and around 20 years before 1940. But the Australian CEF index derived from 20CRv3 is opposite to the CEPG index, except for a short period of 1920–1930 with the same positive anomaly. Also, in the 1960s, both the CEPG index and the CEF index derived from ERA20C are positive, but the CEF index in 20CRv3 is negative, in spite of a consistent enhancement in the CEF index in both the reanalyses and the Australian CEPG index in the preceding period. In brief, all these validations of the interdecadal component indicate that ERA20C is more closely similar to the proxy and is thus more credible than 20CRv3.
4. Summary and discussions
This paper first compared the two 20th-century atmospheric reanalysis datasets, ERA20C and 20CRv3, as far as the boreal summer low-level CEFs over the Asian-Australian monsoon region are concerned. The results suggest an overall consistency with respect to the spatial structure of the CEF climatology and their variability expressed as standard deviation. Furthermore, substantial gaps between the two datasets are seen as follows:
1) Climatologically, the intensity of BOB CEF and the variability of Somali CEF are stronger in 20CRv3 than in ERA20C. For the year-to-year evolution in ERA20C compared with that in 20CRv3, the Somali CEF is stronger from 1901 to 1925 but is weaker during the period of 1960–1980. The BOB CEF is constantly lower throughout the century, and the Australian CEF has weaker amplitude prior to 1950.
2) At interannual timescale, significant differences between the two datasets are observed in 1901–1950, with frequently opposite anomalies in the Somali CEF and different amplitudes in the BOB and Australian CEFs.
3) At interdecadal timescale, the two reanalyses show weak correlations over three CEFs, with different decadal variation cycles in the Somali CEF, along with the weaker periodic fluctuation of the BOB CEF in 20CRv3 and the opposite anomaly in the Australian CEF before 1940 and in the 1960s.
4) As for the long-term trend, the two reanalyses show consistency in the signal, with an upward trend in the Somali and BOB CEFs and a downward trend in the Australian CEF. However, there are gaps in the trend amplitude, with a stronger strengthening in the Somali CEF but a less evident weakening in the Australian CEF in 20CRv3.
The gaps in the interdecadal component of all the CEFs between the reanalyses raise one issue: which one is more reliable and which dataset can be selected for use? It is difficult to directly address this issue because there are no sufficient instrumental wind records in the early 20th century. Here, this is conducted by comparing CEFs in the two datasets with two proxy indicators. The first is the cross-equatorial meridional gradient of SLP, and the second is the Indian monsoon core region rainfall. They both have substantially dynamic connections with the CEFs and longer instrumental records. In addition, they verify each other during the 20th century. The validation results indicate that all the CEFs in ERA20C are more reasonable relative to 20CRv3, because the Somali CEF has the same periodicity variation as the two proxy indicators, and the Australian CEF has a consistent fluctuation with the proxy indicator. Thus, ERA20C is more suitable for investigating interdecadal climate variability associated with CEFs.
The finding that ERA20C is a more reliable dataset is important for understanding the interdecadal variability of Asian-Australian summer monsoon, as well as for realizing global climate change. There is no doubt that the exchange of mass, momentum, water moisture, and energy across the hemispheres is exclusively important for global climate distribution. Furthermore, the significant gap in the interdecadal component of the CEFs between the reanalyses provides some clues for developing next-generation atmospheric reanalysis products. The evident lag in the decadal variation of the Somali CEF before 1920 and after 1980 in ERA20C relative to 20CRv3 and the two proxy indicators implies an urgent need to assimilate the oceanic observations into reanalysis dynamic system.
There are some deficiencies in this study. First, the benchmark indices used for the CEF validation are only approximate and cannot fully explain the variability of the CEFs. Second, the reason for the gap in the interdecadal variation of three CEFs in the two reanalyses is unclear. According to their similar variation periodicity to AMO and PDO, one may guess that the model used for the two reanalyses may have deficiencies in capturing decadal variability associated with PDO and AMO. The other possible reason is that the SST datasets applied for boundary conditions in the two reanalyses are different, leading to the bias of cross-equatorial SST gradient and contributing to the difference of CEFs between the reanalyses. Nonetheless, this issue deserves further investigation.
Acknowledgments
This work is jointly supported by the Strategic Project of the Chinese Academy of Science (Grant XDA19070402) and NSFC (Grant 41731177). 20CRv3 dataset is provided by the Office of Science Biological and Environmental Research (BER), US Department of Energy, the National Oceanic and Atmospheric Administration Climate Program Office, and the NOAA Physical Sciences Laboratory. ERA20C dataset is provided by ECMWF.
References
- Ajayamohan, R. S., 2007: Simulation of South-Asian summer monsoon in a GCM. Pure Appl. Geophys., 164, 2117-2140.
- Allan, R., and T. Ansell, 2006: A new globally complete monthly historical gridded mean sea level pressure dataset (HadSLP2): 1850–2004. J. Climate, 19, 5816-5842.
- Attada, R., H. P. Dasari, A. Parekh, J. S. Chowdary, S. Langodan, O. Knio, and I. Hoteit, 2019: The role of the Indian Summer Monsoon variability on Arabian Peninsula summer climate. Climate Dyn., 52, 3389-3404.
- Befort, D. J., S. Wild, T. Kruschke, U. Ulbrich, and G. C. Leckebusch, 2016: Different long-term trends of extratropical cyclones and windstorms in ERA-20C and NOAA-20CR reanalyses. Atmos. Sci. Lett., 17, 586-595.
- Bett, P. E., H. E. Thornton, and R. T. Clark, 2017: Using the Twentieth Century Reanalysis to assess climate variability for the European wind industry. Theor. Appl. Climatol., 127, 61-80.
- Bloomfield, H. C., L. C. Shaffrey, K. I. Hodges, and P. L. Vidale, 2018: A critical assessment of the long-term changes in the wintertime surface Arctic Oscillation and Northern Hemisphere storminess in the ERA20C reanalysis. Environ. Res. Lett., 13, 094004, doi: 10.1088/1748-9326/aad5c5.
- Compo, G. P., J. S. Whitaker, P. D. Sardeshmukh, N. Matsui, R. J. Allan, X. Yin, B. E. Gleason, R. S. Vose, G. Rutledge, P. Bessemoulin, S. Brönnimann, M. Brunet, R. I. Crouthamel, A. N. Grant, P. Y. Groisman, P. D. Jones, M. C. Kruk, A. C. Kruger, G. J. Marshall, M. Maugeri, H. Y. Mok, Ø. Nordli, T. F. Ross, R. M.
Trigo, X. L. Wang, S. D. Woodruff, and S. J. Worley, 2011: The Twentieth Century Reanalysis Project. Quart. J. Roy. Meteor. Soc., 137, 1-28.
- Cram, T. A., G. P. Compo, X. Yin, R. J. Allan, C. McColl, R. S. Vose, J. S. Whitaker, N. Matsui, L. Ashcroft, R. Auchmann, P. Bessemoulin, T. Brandsma, P. Brohan, M. Brunet, J. Comeaux, R. Crouthamel, B. E. Gleason, P. Y. Groisman, H. Hersbach, P. D. Jones, T. Jónsson, S. Jourdain, G. Kelly, K. R. Knapp, A. Kruger, H. Kubota, G. Lentini, A. Lorrey, N. Lott, S. J. Lubker, J. Luterbacher, G. J. Marshall, M. Maugeri, C. J. Mock, H. Y. Mok, Ø. Nordli, M. J. Rodwell, T. F. Ross, D. Schuster, L. Srnec, M. A. Valente, Z. Vizi, X. L. Wang, N. Westcott, J. S. Woollen, and S. J. Worley, 2015: The International Surface Pressure Databank version 2. Geosci. Data J., 2, 31-46.
- Dee, D. P., S. M. Uppala, A. J. Simmons, P. Berrisford, P. Poli, S. Kobayashi, U. Andrae, M. A. Balmaseda, G. Balsamo, P. Bauer, P. Bechtold, A. C. M. Beljaars, L. van de Berg, J. Bidlot, N. Bormann, C. Delsol, R. Dragani, M. Fuentes, A. J. Geer, L. Haimberger, S. B. Healy, H. Hersbach, E. V. Hólm, L. Isaksen, P. Kållberg, M. Köhler, M. Matricardi, A. P. McNally, B. M. Monge-Sanz, J.-J. Morcrette, B.-K. Park, C. Peubey, P. de Rosnay, C. Tavolato, J.-N. Thépaut, and F. Vitart, 2011: The ERA-Interim reanalysis: Configuration and performance of the data assimilation system. Quart. J. Roy. Meteor. Soc., 137, 553-597.
- Deng, X., P. Zhai, and C. Yuan, 2010: Comparative analysis of NCEP/NCAR, ECMWF and JMA reanalysis. Meteor. Sci. Technol., 38, 1-8 (in Chinese).
- Donat, M. G., L. V. Alexander, N. Herold, and A. J. Dittus, 2016: Temperature and precipitation extremes in century- long gridded observations, reanalyses, and atmospheric model simulations. J. Geophys. Res.: Atmos., 121, 11174-11189.
- Fan, Q., Z. Li, and J. Wang, 2018: Contact between precipitation anomaly in Asian-Australian monsoon region and low-level cross-equatorial flow variation over South China Sea in summer. Trans. Atmos. Sci., 41, 684-691 (in Chinese).
- Gao, H., and F. Xue, 2006: Seasonal variation of the crossequatorial flows and their influences on the onset of South China Sea summer monsoon. Climatic. Environ. Res., 1, 57-68 (in Chinese).
- Gelaro, R., W. McCarty, M. J. Suárez, R. Todling, A. Molod, L. Takacs, C. A. Randles, A. Darmenov, M. G. Bosilovich, R. Reichle, K. Wargan, L. Coy, R. Cullather, C. Draper, S. Akella, V. Buchard, A. Conaty, A. M. da Silva, W. Gu, G.-K. Kim, R. Koster, R. Lucchesi, D. Merkova, J. E. Nielsen, G. Partyka, S. Pawson, W. Putman, M. Rienecker, S. D. Schubert, M. Sienkiewicz, and B. Zhao, 2017: The Modern-Era Ranalysis for Research and Applications, version 2 (MERRA-2). J. Climate, 30, 5419-5454.
- Giese, B. S., H. F. Seidel, G. P. Compo, and P. D. Sardeshmukh, 2016: An ensemble of ocean reanalyses for 1815–2013 with sparse observational input. J. Geophys. Res.: Oceans, 121, 6891-6910.
- Halpern, D., and P. M. Woiceshyn, 2001: Somali Jet in the Arabian Sea, El Niño, and India rainfall. J. Climate, 14, 434-441.
- Hersbach, H., P. Poli, and D. Dee, 2015: The observation feedback archive for the ICOADS and ISPD data sets. ERA Report Series, No. 18, ECMWF, Reading, UK, 31 pp. [Available at https://www.ecmwf.int/en/publications.]
- Hersbach, H., B. Bell, P. Berrisford, S. Hirahara, A. Horányi, J. Muñoz-Sabater, J. Nicolas, C. Peubey, R. Radu, D. Schepers, A. Simmons, C. Soci, S. Abdalla, X. Abellan, G. Balsamo, P. Bechtold, G. Biavati, J. Bidlot, M. Bonavita, G. De Chiara, P. Dahlgren, D. Dee, M. Diamantakis, R. Dragani, J. Flemming, R. Forbes, M. Fuentes, A. Geer, L. Haimberger, S. Healy, R. J. Hogan, E. Hólm, M. Janisková, S. Keeley, P. Laloyaux, P. Lopez, C. Lupu, G. Radnoti, P. de Rosnay, I. Rozum, F. Vamborg, S. Villaume, and J.-N. Thépaut, 2020: The ERA5 global reanalysis. Quart. J. Roy. Meteor. Soc., 146, 1999-2049.
- Hoskins, B. J., G.-Y. Yang, and R. M. Fonseca, 2020: The detailed dynamics of the June–August Hadley Cell. Quart. J. Roy. Meteor. Soc., 146, 557-575.
- Huang, B., U. Cubasch, and Y. Li, 2018: East Asian summer monsoon representation in re-analysis datasets. Atmosphere, 9, 235, doi:10.3390/atmos9060235.
- Huang, X., T. Zhou, W. Zhang, J. Jiang, P. Li, and Y. Zhao, 2019: Northern Hemisphere land monsoon precipitation changes in the twentieth century revealed by multiple reanalysis datasets. Climate Dyn., 53, 7131-7149.
- Jain, S., S. K. Mishra, A. Anand, P. Salunke, and J. T. Fasullo, 2021: Historical and projected low-frequency variability in the Somali jet and Indian Summer Monsoon. Climate Dyn., 56, 749-765.
- Joseph, P. V., and S. Sijikumar, 2004: Intraseasonal variability of the low-level jet stream of the Asian summer monsoon. J. Climate, 17, 1449-1458.
- Kalnay, E., M. Kanamitsu, R. Kistler, W. Collins, D. Deaven, L. Gandin, M. Iredell, S. Saha, G. White, J. Woollen, Y. Zhu, M. Chelliah, W. Ebisuzaki, W. Higgins, J. Janowiak, K. C. Mo, C. Ropelewski, J. Wang, A. Leetmaa, R. Reynolds, R. Jenne, and D. Joseph, 1996: The NCEP/NCAR 40-year reanalysis project. Bull. Amer. Meteor. Soc., 77, 437-472.
- Kobayashi, S., Y. Ota, Y. Harada, A. Ebita, M. Moriya, H. Onoda, K. Onogi, H. Kamahori, C. Kobayashi, H. Endo, K. Miyaoka, and K. Takahashi, 2015: The JRA-55 Reanalysis: General specifications and basic characteristics. J. Meteor. Soc. Japan, 93, 5-48.
- Kumar, K. K., M. K. Soman, and K. R. Kumar, 1995: Seasonal forecasting of Indian summer monsoon rainfall: A review. Weather, 50, 449-467.
- Laloyaux, P., E. de Boisseson, M. Balmaseda, J.-R. Bidlot, S. Broennimann, R. Buizza, P. Dalhgren, D. Dee, L. Haimberger, H. Hersbach, Y. Kosaka, M. Martin, P. Poli, N. Rayner, E. Rustemeier, and D. Schepers, 2018: CERA-20C: A coupled reanalysis of the twentieth century. J. Adv. Model. Earth Syst., 10, 1172-1195.
- Lei, X.-C., and X.-Q. Yang, 2008: Interannual variation characteristics of East Hemispheric cross-equatorial flow and its concurrent relationships with temperature and rainfall in China. J. Trop. Meteor., 14, 97-100.
- Li, C., and S. Li, 2014: Interannual seesaw between the Somali and the Australian cross-equatorial flows and its connection to the East Asian summer monsoon. J. Climate, 27, 3966-3981.
- Li, C., and S. Li, 2016: Connection of the interannual seesaw of the Somali-Australian cross-equatorial flows with China summer rainfall. Chin. Sci. Bull., 61, 1453-1461 (in Chinese).
- Li, C., and J. Wu, 2002: Important role of the Somali cross-equator flow in the onset of the South China Sea summer monsoon. Chin. J. Atmos. Sci., 26, 185-192 (in Chinese).
- Martin, G. M., K. Arpe, F. Chauvin, L. Ferranti, K. Maynard, J. Polcher, D. B. Stephenson, and P. Tschuck, 2000: Simulation of the Asian summer monsoon in five European general circulation models. Atmos. Sci. Lett., 1, 37-55.
- McPhaden, M. J., G. Meyers, K. Ando, Y. Masumoto, V. S. N. Murty, M. Ravichandran, F. Syamsudin, J. Vialard, L. Yu, and W. Yu, 2009: RAMA: The research moored array for African-Asian-Australian monsoon analysis and prediction. Bull. Amer. Meteor. Soc., 90, 459-480.
- Ordonez, P., P. Ribera, D. Gallego, and C. Pena-Ortiz, 2013: Influence of Madden-Julian Oscillation on water budget transported by the Somali low-level jet and the associated Indian summer monsoon rainfall. Water Resour. Res., 49, 6474-6485.
- Pai, D. S., L. Sridhar, M. Rajeevan, O. P. Sreejith, N. S. Satbhai, and B. Mukhopadhyay, 2014: Development of a new high spatial resolution (0.25° × 0.25°) long period (1901–2010) daily gridded rainfall data set over India and its comparison with existing data sets over the region. Mausam, 65, 1-18.
- Parthasarathy, B., K. R. Kumar, and A. A. Munot, 1993: Homogeneous Indian Monsoon rainfall: Variability and prediction. Proc. Indian Acad. Sci., 102, 121-155.
- Poli, P., H. Hersbach, D. P. Dee, P. Berrisford, A. J. Simmons, F. Vitart, P. Laloyaux, D. G. H. Tan, C. Peubey, J.-N. Thépaut, Y. Trémolet, E. V. Hólm, M. Bonavita, L. Isaksen, and M. Fisher, 2016: ERA-20C: An atmospheric reanalysis of the twentieth century. J. Climate, 29, 4083-4097.
- Polonskii, A. B., S. B. Krasheninnikova, and D. V. Basharin, 2017: Interdecadal variability of the meridional Ekman heat and mass transport in the North Atlantic and its relation to the Atlantic Multidecadal Oscillation. Russ. Meteor. Hydrol., 42, 653-660.
- Prasanna, V., 2016: South Asian summer monsoon rainfall variability and trend: Its links to Indo-Pacific SST anomalies and moist processes. Pure Appl. Geophys., 173, 2167-2193.
- Prasanna, V., B. Preethi, J. Oh, I. Kim, and S. Woo, 2020: Performance of CMIP5 atmospheric general circulation model simulations over the Asian summer monsoon region. Global Planet. Change, 194, 103298, doi:10.1016/j.gloplacha.2020.103298.
- Rajeevan, M., S. Gadgil, and J. Bhate, 2010: Active and break spells of the Indian summer monsoon. J. Earth Syst. Sci., 119, 229-247.
- Raman, M. R., M. V. Ratnam, M. Rajeevan, V. V. M. Jagannadha Rao, and S. Vijaya Bhaskara Rao, 2011: Intriguing aspects of the monsoon low-level jet over Peninsular India revealed by high-resolution GPS radiosonde observations. J. Atmos. Sci., 68, 1413-1423.
- Ramesh Kumar, M. R., S. S. C. Shenoi, and P. Schluessel, 1999: On the role of the cross equatorial flow on summer monsoon rainfall over India using NCEP/NCAR reanalysis data. Meteor. Atmos. Phys., 70, 201-213.
- Rohrer, M., S. Brönnimann, O. Martius, C. C. Raible, and M. Wild, 2019: Decadal variations of blocking and storm tracks in centennial reanalyses. Tellus A, 71, 1586236, doi:10.1080/16000870.2019.1586236
- Saha, S., S. Moorthi, H.-L. Pan, X. Wu, J. Wang, S. Nadiga, P. Tripp, R. Kistler, J. Woollen, D. Behringer, H. Liu, D. Stokes, R. Grumbine, G. Gayno, J. Wang, Y.-T. Hou, H-Y. Chuang, H.-M. H. Juang, J. Sela, M. Iredell, R. Treadon, D. Kleist, P. Van Delst, D. Keyser, J. Derber, M. Ek, J. Meng, H. Wei, R. Yang, S. Lord, H. van den Dool, A. Kumar, W. Wang, C. Long, M. Chelliah, Y. Xue, B. Huang, J.-K. Schemm, W. Ebisuzaki, R. Lin, P. Xie, M. Chen, S. Zhou, W. Higgins, C.-Z. Zou, Q. Liu, Y. Chen, Y. Han, L. Cucurull, R. W. Reynolds, G. Rutledge, and M. Goldberg, 2010: The NCEP climate forecast system reanalysis. Bull. Amer. Meteor. Soc., 91, 1015-1057.
- Shi, N., F. Wei, G. Feng, and T. Sheng, 1997: Monte Carlo test used in correlation and composite analysis of meteorological fields. J. Nanjing Inst. Meteor., 20, 355-359 (in Chinese).
- Slivinski, L. C., G. P. Compo, J. S. Whitaker, P. D. Sardeshmukh, B. S. Giese, C. McColl, R. Allan, X. Yin, R. Vose, H. Titchner, J. Kennedy, L. J. Spencer, L. Ashcroft, S. Brönnimann, M. Brunet, D. Camuffo, R. Cornes, T. A. Cram, R. Crouthamel, F. Domínguez-Castro, J. E. Freeman, J. Gergis, Ed Hawkins, P. D. Jones, S. Jourdain, A. Kaplan, H. Kubota, F. Le Blancq, T.-C. Lee, A. Lorrey, J. Luterbacher, M. Maugeri, C. J. Mock, G. W. K. Moore, R. Przybylak, C. Pudmenzky, C. Reason, V. C. Slonosky, C. A. Smith, B. Tinz, B. Trewin, M. A. Valente, X. L. Wang, C. Wilkinson, K. Wood, and P. Wyszyński, 2019: Towards a more reliable historical reanalysis: Improvements for version 3 of the twentieth century reanalysis system. Quart. J. Roy. Meteor. Soc., 145, 2876-2908.
- Stankunavicius, G., D. Basharin, R. Skorupskas, and G. Vivaldo, 2017: Euro-Atlantic blocking events and their impact on surface air temperature and precipitation over the European region in the 20th century. Climate Res., 71, 203-218.
- Thompson, R. O. R. Y., 1979: Coherence significance levels. J. Atmos. Sci., 36, 2020-2021.
- Wang, H., and F. Xue, 2003: The interannual variability of Somali jet and its influences on the inter-hemispheric water vapor transport and the East Asian summer rainfall. Chin. J. Geophys., 46, 11-20.
- Wang, M., S. Yao, L. Jiang, Z. Liu, C. Shi, K. Hu, T. Zhang, Z. Zhang, and J. Liu, 2018: Collection and preprocessing of satellite remote-sensing data in CRA-40 (CMA's Global Atmospheric Reanalysis). Adv. Meteor. Sci. Technol., 8, 158-163 (in Chinese).
- Welker, C., and O. Martius, 2014: Decadal-scale variability in hazardous winds in northern Switzerland since end of the 19th century. Atmos. Sci. Lett., 15, 86-91.
- Wohland, J., N.-E. Omrani, D. Witthaut, and N. S. Keenlyside, 2019: Inconsistent wind speed trends in current twentieth century reanalyses. J. Geophys. Res.: Atmos., 124, 1931-1940.
- Woodruff, S. D., S. J. Worley, S. J. Lubker, Z. Ji, J. E. Freeman, D. I. Berry, P. Brohan, E. C. Kent, R. W. Reynolds, S. R. Smith, and C. Wilkinson, 2011: ICOADS release 2.5: Extensions and enhancements to the surface marine meteorological archive. Int. J. Climatol., 31, 951-967.
- Wu, X., and J. Mao, 2019: Decadal changes in interannual dependence of the Bay of Bengal summer monsoon onset on ENSO modulated by the Pacific Decadal Oscillation. Adv. Atmos. Sci., 36, 1404-1416.
- Zeng, Q., and J. Li, 2002: Interactions between the Northern and Southern hemispheric atmospheres and the essence of monsoon. Chin. J. Atmos. Sci., 26, 433-448 (in Chinese).
- Zhao, J., and Y. B. Han, 2005: Estimation of correlation significance levels after moving average. J. Beijing Natl. Univ.: Nat. Sci., 2, 139-141 (in Chinese).
- Zhao, T., C. Fu, Z. Ke, and W. Guo, 2010: Global atmosphere reanalysis datasets: Current status and recent advances. Adv. Earth Sci., 25, 242-254 (in Chinese).
- Zhu, Y., 2012: Variations of the summer Somali and Australia cross-equatorial flows and the implications for the Asian summer monsoon. Adv. Atmos. Sci., 29, 509-518.
- Zurita-Gotor, P., 2020: The impact of divergence tilt and meridional flow for cross-equatorial eddy momentum transport in Gill-like settings. J. Atmos. Sci., 77, 1933-1953.


