Abstract
Iwamizawa, situated on the Sea of Japan side of Hokkaido, is a city in Japan that experience frequent heavy snowfall events. Warm surface-layer ocean anomalies over the Sea of Japan can induce heavy snowfall over the Sea of Japan side of Japan; however, the relationship between ocean temperature over the northern Sea of Japan and snowfall events at Iwamizawa remains uncertain. This study used reanalysis data to investigate atmospheric and oceanic circulation anomalies associated with each anomalous heavy snowfall winter month at Iwamizawa. During all anomalous snowfall winter months at Iwamizawa, a cold air anomaly with northwesterly winds existed over the Far East that was associated with a dipole pattern with anticyclone anomalies over the northern coast of the Eurasian Continent and cyclonic anomalies extending zonally over the Far East and northern Pacific Ocean. The surface cold air temperature and strong wind speed anomalies are major factors for anomalous upward turbulent heat flux over the northern Sea of Japan during all anomalous snowfall winter months at Iwamizawa. Additionally, during anomalous snowfall in January, warm surface-layer ocean anomaly over the northern Sea of Japan, which preceded the heavy snowfall events at Iwamizawa by 2 months, plays an important role in the upward turbulent heat flux anomaly. This preceding warm ocean temperature anomaly was associated with a strong Tsushima Warm Current anomaly. Results showed that the warm surface-layer ocean anomaly over the northern Sea of Japan that precedes anomalous cold advection from the Eurasian Continent also has a large impact on producing heavy snowfall events over the western Hokkaido coastal regions near Iwamizawa in January.
1. Introduction
During the winter monsoon, the Siberian High over Eurasia and a developed cyclone over the North Pacific create a strong surface pressure gradient over East Asia. The northwesterly winter monsoon associated with this strong pressure gradient leads to outbreaks of cold air from the Eurasian Continent toward Japan. The relatively warm ocean provides a rich supply of water vapor and heat to the cold and dry air moving over the Sea of Japan, thereby resulting in the development of convective clouds that can cause extreme weather with heavy snowfall (e.g., Ninomiya 1968; Yoshizaki et al. 2004; Inoue et al. 2005; Sato et al. 2017).
Takano et al. (2008) reported that the air mass modification over the Sea of Japan is strongly related to a large-scale atmospheric north–south dipole pattern [similar to the western Pacific (WP) pattern]. When the phase of the WP pattern is negative (positive), the winter monsoon is enhanced (reduced) over East Asia, thereby causing anomalous cold (warm) winters over the Far East (Takaya and Nakamura 2013). Additionally, cold air over the Eurasian Continent moves eastward with the movement of a trough in the middle troposphere (Hori et al. 2011). Several mechanisms regarding anomalous cold temperatures over the Eurasian Continent have been reported in previous studies (Honda et al. 2009; Inoue et al. 2012; Sato et al. 2014; Nakanowatari et al. 2014; Mori et al. 2014; Nakamura et al. 2015). The decline of sea ice over the Barents and Kara seas strengthens the Siberian High through enhanced release of oceanic heat (Honda et al. 2009; Nakanowatari et al. 2014; Mori et al. 2014), and a poleward shift of cyclone tracks (Inoue et al. 2012) leads to anomalous cold temperatures over the Eurasian continent. The atmospheric response to changes in the Atlantic warm ocean current (i.e., the Gulf Stream) has direct and indirect effects on cold temperature anomalies over Eurasia (Sato et al. 2014).
Anomalous warm sea surface temperatures (SST) around Japan have a direct impact on the weather over Japan (Manda et al. 2014; Ando et al. 2015). Therefore, the relationships between SST over the Sea of Japan and precipitation over the Sea of Japan side of Japan have been investigated in previous studies (Sato and Sugimoto 2013; Takahashi et al. 2013; Takahashi and Idenaga 2013; Yasunaga and Tomochika 2017). During autumn and winter, positive SST trends were observed over the northern Sea of Japan from the 1980s to the 2000s or 2010s (Sato and Sugimoto 2013; Yasunaga and Tomochika 2017). Numerical experiments have revealed that an anomalous upward latent heat flux associated with the warm SST anomaly (SSTA) over the Sea of Japan enhances snowfall over the Sea of Japan–side regions of Japan (Takahashi et al. 2013). During winter, the amount of precipitation over the Sea of Japan–side regions can increase on the timescale of a few days following increased SST over the Sea of Japan (Takahashi and Idenaga 2013). Conversely, in the same winter month, there is no relationship between monthly mean precipitation over the Sea of Japan side and SST over the Sea of Japan (Yasunaga and Tomochika 2017). This is because there are month-to-month variances of SST over the Sea of Japan in winter months during a strong winter monsoon (Takano et al. 2008). Therefore, the amounts of monthly precipitation over the Sea of Japan–side regions in December are correlated significantly with the 1-month prior SST over the Sea of Japan (Takano et al. 2008; Yasunaga and Tomochika 2017). Warm ocean currents play important roles in changing local and large-scale precipitation systems (Hirose and Fukudome 2006; Kunoki et al. 2015; Sato et al. 2014, 2016, 2021; Minobe et al. 2008, 2010; Minobe and Takebayashi 2015). Specifically, in the Sea of Japan, the stronger transport of the Tsushima Warm Current (TWC) during autumn causes a warm SSTA over the southern Sea of Japan, thereby enhancing the winter snowfall over the Sea of Japan side of Japan (Hirose and Fukudome 2006; Hirose et al. 2009; Sugimoto and Hirose 2014).
Several studies have investigated snowfall amounts over Hokkaido, which is a region of Japan that experiences heavy snowfall during the winter monsoon (Campbell et al. 2018; Shirakawa and Kameda 2019; Inatsu et al. 2020; Kawazoe et al. 2020; Takahashi 2021). When the northwesterly winter monsoon is intensified over the Sea of Japan, the cloud band associated with heavy snowfall events can be observed to extend from the northern Sea of Japan to western Hokkaido (Muramatsu 1979; Fujiyoshi et al. 1992, 1998; Katsumata et al. 1998, 2000; Yoshimoto et al. 2000). A part of cloud band initially forms on the lee side of Russia's Sikhote-Alin mountain range on the eastern coast of the Eurasian continent owing to the topographic effects of the mountains (Muramatsu 1979; Ohtake et al. 2008). Additionally, convective clouds associated with mesoscale systems (i.e., polar lows) bring heavy snowfall over the western parts of Hokkaido (Ninomiya 1994). When the Sea of Okhotsk is covered with sea ice, cold advection from the sea ice area influences on the formations and intensifications of these mesoscale systems (Tsuboki et al. 1989).
The continual cloud band is formed over the Sea of Japan during the winter months, thereby leading to relatively large climatological total amounts of snowfall in the western parts of Hokkaido compared with the eastern parts of Hokkaido (Fig. 1). Specifically, anomalous heavy snowfall at Iwamizawa in western Hokkaido is often greater than that at other stations in Hokkaido. During the 2020/2021 winter, Iwamizawa experienced four extreme heavy snowfall events (Fig. 2a). Although snow cloud bands formed over the western coastal regions of Hokkaido during the other three snowfall events that occurred in December 2020 and early February 2021 (Figs. 2b–d), a strong snowfall band associated with a mesoscale system was observed during the snowfall event near the end of February 2021 (Fig. 2e). There has been no study previously on the relationship between the surface-layer ocean temperature anomaly over the northern Sea of Japan and anomalous snowfall at Iwamizawa. This study investigated the atmospheric and oceanic circulation anomalies associated with anomalous winter snowfall at Iwamizawa.
2. Data and method
To investigate the atmospheric and oceanic fields, monthly mean Climate Forecast System Reanalysis data from January 1979 to March 2011 and Climate Forecast System Version 2 data after April 2011 were used in this study. The National Centers for Environmental Prediction produces both these datasets on 0.5° × 0.5° grids (Saha et al. 2010, 2014). The data include meteorological (e.g., temperature, wind, specific humidity, geopotential height, turbulent heat flux, and radiative heat flux) and oceanographic (e.g., potential ocean temperature and ocean current) parameters at various levels. The atmospheric fields during winter 2020/2021 were based on Japan Meteorological Agency (JMA) Meso Scale Model data (MSM), which are provided after July 2002 (Figs. 2b–d). We supplemented in situ data with gridded analyses of precipitation derived from radar data after June 2003 provided by the JMA. Additionally, we used monthly total snowfall (MTS) data from 116 stations of the Automated Meteorological Data Acquisition System (AMeDAS) in Hokkaido (Fig. 1).

To understand interannual snowfall variations at Iwamizawa, we focused on the time series of MTS anomalies during each winter month (i.e., December, January, and February) at Iwamizawa (Fig. 3). Referring to this time series, we selected typical heavy and light snowfall years for which snowfall values exceed 0.7 standard deviations for each winter month. To compare the broad atmospheric and oceanic circulations, we compiled difference maps of atmospheric and oceanic fields by subtracting composites for heavy vs. light snowfall winter months. Moreover, we calculated correlation coefficients for MTS at Iwamizawa with atmospheric and oceanic parameters for all winter months.

To assess the contributions from SSTA, surface air temperature anomaly (SATA), and surface wind speed anomaly (SWSA) to sensible and latent heat flux anomalies, we used the equations reported by Tanimoto et al. (2003). The sensible and latent heat fluxes are given as the sum of the climatological mean and anomaly. Therefore, the anomalous sensible and latent heat fluxes are expressed as
QE and
QH are the latent and sensible heat fluxes, respectively. Here
ρa is the air density with a value of 1.293 kg m
−3,
L is the latent heat of vaporization for water with a value of 2.50 × 10
6 J kg
−1,
cp is the specific heat of air at constant pressure with a value of 1004 J kg
−1 K
−1,
U is the wind speed, and
CE and
CH are the transfer coefficients for
QE and
QH, respectively. Subscripts
s and
a indicate the values at the sea surface and 2 m height, respectively. Overbars and primes indicate the climatological mean and the deviation from it. The first three terms of
Eqs. (1) and
(2) are considered to represent the respective contributions from SSTA, SATA, and SWSA to sensible and latent heat fluxes (
Tanimoto et al. 2003).
Additionally, we estimated the contributions from horizontal ocean temperature advection (−OV · ∇OT −OU · ∇OT) to heat balance in the surface-layer ocean. Here, OT denotes the surface-layer ocean temperature, and OV and OU denote the surface-layer meridional and zonal ocean current, respectively.
3. Results
3.1 Atmospheric circulations cause heavy snowfall winters in northern Japan
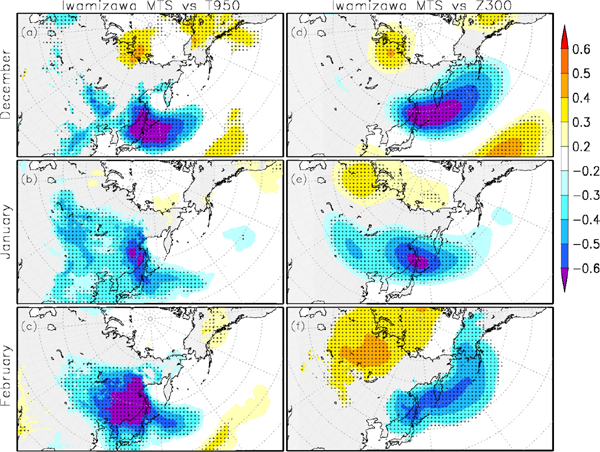
Figures 4a–c shows the difference maps of temperature at 950 hPa (T950) with sea-level pressure between heavy and light snowfall years at Iwamizawa for each winter month. In heavy snowfall years of all winter months, the T950s have significant cold temperature anomalies over the Far East. Dipole patterns with an anticyclonic anomaly over the Eurasian Continent and a cyclonic anomaly over the northern Pacific Ocean can be seen during all heavy snowfall winter months. These patterns cause a pressure gradient over the Far East that induces northwesterly cold advection anomalies over northern Japan. The frequency of formation of cloud bands with heavy snowfall, extending from the eastern Eurasian Continent to western Hokkaido, would be increased by northwesterly cold advection anomalies. In the upper troposphere, the difference in geopotential height at 300 hPa (Z300) has a dipole pattern with anticyclone anomalies over the northern coast of the Eurasian Continent and cyclonic anomalies extending zonally over the Far East and northern Pacific Ocean (Figs. 4d–f). In heavy snowfall winters, the WP pattern, which enhances northerly cold advection associated with the winter monsoon, increases the amount of snowfall over Hokkaido (Inatsu et al. 2021). However, there is no correlation coefficient between the MTS and WP index (available at https://psl.noaa.gov/data/climateindices/list) for all months during 1979 and 2020/2021 (December, January: |r| = 0.0; February: |r| = 0.2), thereby indicating that this dipole pattern is different from the WP pattern.

The propagation of wave-activity flux, which represents the propagation of quasi-stationary Rossby waves, indicates that a wave train appears from the northern Eurasian Continent to the Far East (Figs. 4d–f). Although anomalous sea ice decline over the Barents–Kara seas induces an anticyclonic anomaly over the Barents–Kara sector (Honda et al. 2009; Inoue et al. 2012; Mori et al. 2014; Sato et al. 2014), a statistically significant decline in sea ice in the Barents–Kara seas is not evident during heavy snowfall years for all winter months (Figs. 4d–f). The covered sea ice reduces heat releasing from ocean and causes no significant differences in upward turbulent heat fluxes over the Barents–Kara sector in all heavy snowfall months (not shown). Additionally, during all winter months in heavy snowfall years, there are no differences in other factors that might influence this atmospheric circulation anomaly [e.g., a weakened polar vortex in the stratosphere, as reported by Nakamura et al. (2015) and poleward movement of the Gulf Stream, as reported by Sato et al. (2014)]. Teleconnections between the tropical regions and the Arctic are not seen in all heavy snowfall months, thereby suggesting that a change in another factor over the high latitudes can influence these atmospheric circulation anomalies. Conversely, during heavy snowfall February months, there is a statistically significant positive anomaly in sea ice concentration over the Sea of Okhotsk (Fig. 4f). The relatively cold air mass associated with heavy sea ice cover would influence the formation of convergent cloud with heavy snowfall reported in a previous study (Tsuboki et al. 1989). In fact, during 23 and 24 February 2021, the heavy snowfall event was induced by mesoscale systems (Figs. 2a, e).
To further investigate the relationship between MTS and atmospheric circulation for each winter month, we calculated the correlations between MTS at Iwamizawa and atmospheric parameters (T950 and Z300) for the three winter months (Fig. 5). Air temperature in the lower troposphere (T950) over the Far East has a significant negative correlation with MTS at Iwamizawa in all winter months, with a particularly strong negative correlation (|r| > 0.6) over northern Japan (Figs. 5a–c). In the upper troposphere, there are statistical relationships between MTS at Iwamizawa and the dipole pattern, with a negative correlation (|r| > 0.5) over the northern Pacific Ocean and a positive correlation (|r| > 0.3) over the northern Eurasian Continent in all winter months (Figs. 5d–f). The high correlations between MTS at Iwamizawa and atmospheric variations, which indicate that anomalous cold advection associated with the meridional dipole pattern plays an important role in Iwamizawa snowfall, agree with the findings of previous studies (Hirose and Fukudome 2006; Takano et al. 2008; Takahashi and Idenaga 2013).
To investigate surface-layer ocean temperature anomalies in heavy snowfall years, we examined difference maps of ocean temperature in the surface layer (depth: 5 m) between heavy and light snowfall years at Iwamizawa for all winter months (Fig. 6). In heavy snowfall December months, although there are positive differences in surface-layer ocean temperature over the northern Sea of Japan, the amplitude of this warm anomaly is small (Fig. 6a). Conversely, the difference maps of surface-layer ocean temperature during the months prior (October and November) to heavy snowfall December months (Figs. 6b, c) reveal a statistically significant warm anomaly around the Ishikari Bay. The correlation coefficient between MTS at Iwamizawa during December and surface-layer ocean temperature during prior months (November and October) shows that although the correlations have relatively small magnitude over the northern Sea of Japan, there are significant positive correlations over the Ishikari Bay (Figs. 7b, c). The difference in ocean current velocity in the surface layer shows eastward and northeastward ocean current anomalies from the Sea of Japan to the Ishikari Bay (Figs. 6b, c), thereby suggesting that a strong TWC anomaly would impact the warm surface-layer ocean anomaly over Ishikari Bay. To estimate the impact of the ocean current anomaly associated with the strong TWC anomaly on the surface-layer ocean temperature anomaly, we created difference maps of the contribution from horizontal ocean temperature advection to change in surface-layer ocean temperature between heavy and light snowfall years at Iwamizawa for all winter months (Fig. 8). Although the increase in horizontal advection associated with the strong TWC anomaly during October would contribute to the warm surface-layer ocean anomaly over the Ishikari Bay during November (Figs. 6b, 8c), there is a small magnitude of horizontal ocean temperature advection anomaly with no statistical significance during October (Fig. 8c). To assess the impact of atmospheric variations on the warm surface-layer ocean anomaly, we calculated surface heat flux, which comprises turbulent and radiative heat fluxes. Figure 9 shows the difference maps of surface heat flux between heavy and light snowfall years at Iwamizawa for all winter months. During the months before heavy snowfall December months, there are no positive differences in surface heat flux over the northern Sea of Japan (Figs. 9b, c). These analyses suggest that other oceanic parameters (e.g., diffusion and the entrainment through the bottom boundary of the mixed layer) are a major factor for the warm surface-layer ocean anomaly during the months before heavy snowfall December months. However, the data assimilation would influence the surface-layer temperature anomaly.


In heavy snowfall January months, the ocean temperature in the surface layer has a warm anomaly in the coastal regions of the Siberian continent (Fig. 6d). During the prior months (December and November) of heavy snowfall January months, the magnitude and distribution of statistically significant warm surface-layer ocean anomalies are larger than those in the prior months (November and October) of heavy snowfall December months (Figs. 6b, c, e, f), thereby suggesting that the warm ocean temperature anomalies remain even during heavy snowfall January months (Fig. 6d). The positive correlations between surface-layer ocean temperatures during prior months and MTS during January months are seen over the Siberian coastal regions (Figs. 7e, f). These positive correlation patterns are similar to those of warm surface-layer ocean anomalies in the prior months of heavy snowfall January months (Figs. 6e, f, 7e, f). The preceding warm surface-layer ocean temperature anomaly over the Sea of Japan would influence the MTS at Iwamizawa in January. During the two prior months of heavy snowfall January months, over the Siberian coastal regions, northward ocean current anomalies, which are associated with a strong northward TWC, are seen over these preceding warm surface-layer ocean anomalies (Figs. 6e, f). There are positive differences in horizontal ocean temperature advection over the Siberian coastal regions (Figs. 8e, f), thereby indicating that the warm horizontal advection anomaly associated with the strong TWC anomaly is large enough to cause the warm surface-layer ocean anomaly during the two prior months of heavy snowfall January months. Conversely, the significant positive differences in surface heat flux are not observed over significant warm surface-layer ocean anomaly areas (Figs. 9e, f). Therefore, atmospheric parameters have a small impact on these warm surface-layer ocean anomalies during two prior months. These results reveal that the strong TWC anomalies during the two prior months affect the warm surface-layer temperature anomaly over the Siberian coastal regions.
For heavy snowfall February months, there are no significant differences in surface-layer ocean temperature in regions upstream of Iwamizawa (i.e., the northern Sea of Japan), even during prior months (December and January) (Figs. 6g–i). The insignificant differences in warm surface-layer ocean anomalies indicate that the atmospheric circulation anomalies play an important role in producing heavy snowfall over the coastal regions of western Hokkaido during heavy snowfall February months. Additionally, MTS has no significant correlation with surface-layer ocean temperature, even in the prior months (Figs. 7g–i). The surface-layer ocean temperature would have a small impact on MTS during heavy snowfall February months.
The negative differences in turbulent heat flux between heavy and light snowfall years at Iwamizawa are seen over the northern Sea of Japan in all heavy snowfall months (Fig. 10), thereby indicating that the anomalous upward latent heat flux over the northern Sea of Japan enhances snowfall over the Sea of Japan–side regions of Japan. To assess the impact of atmospheric and oceanic anomalies on turbulent heat flux anomaly (THFA), we further diagnosed the differences in contributions from SSTA, SATA, and SWSA to THFA between heavy and light snowfall months for three winter months (Fig. 11). In all heavy snowfall months, the contributions from SATA have almost the largest negative differences (< −40 W m−2) with statistical significance over the entire northern Sea of Japan, thereby suggesting that SATA plays the most important role in upward THFA (Figs. 11b, e, h). In the contributions from SWSA, negative differences (< −10 W m−2) are seen over the entire northern Sea of Japan in all heavy snowfall months (Figs. 11c, f, i). Although the magnitudes of negative differences in the contribution from SWSA are weaker than those from SATA, there are relatively large negative differences (< −30 W m−2) over the western Hokkaido coastal regions in heavy snowfall December and February months (Figs. 11c, i). The SWSA over the entire northern Sea of Japan also contributes to upward THFA in all heavy snowfall months. Conversely, there were differences in the magnitude and distribution of SSTA contribution in each winter month (Figs. 11a, d, g). In heavy snowfall December months, the negative difference in SSTA over the Ishikari Bay indicates that warm SSTA contributes to upward THFA over these regions (Fig. 11a). However, the amplitude of contribution from SSTA (> −10 W m−2) over the Ishikari Bay is smaller than that from SATA and SWSA (Figs. 11a–c), thereby suggesting that the warm SSTA during heavy snowfall December months has a minor impact on the total snowfall at Iwamizawa compared with atmospheric contribution anomalies (temperature and wind speed). In heavy snowfall January months, the contribution from SSTA has a relatively large negative value (< −30 W m−2) with the largest differences (< −50 W m−2) over the Siberian continent coastal regions (Fig. 11d). The relatively large contributions from SATA and SWSA are seen over the entire northern Sea of Japan (Figs. 11e, f). However, MTS at Iwamizawa had relatively strong positive correlations with turbulent heat flux over the Siberian continent coastal regions in January (not shown), thereby suggesting that the upward turbulent heat flux over the Siberian continent coastal regions plays the most important role in MTS at Iwamizawa in January. These results suggest that in heavy snowfall January months, the SSTA over the Siberian continent coastal region plays an important role in heavy snowfall at Iwamizawa and atmospheric contributions (i.e., SATA and SWSA). The maximum upward THFAs appear over regions downstream of the specific mountain lee side marking the initial point of formation of the thick cloud band (Muramatsu 1979; Ohtake et al. 2008). Over the Siberian continent coastal regions, the warm surface-layer ocean anomaly would provide anomalous heat and moisture to the atmosphere at the initial formation of the cloud band.

To investigate the distribution of MTS anomalies over Hokkaido when Iwamizawa experienced heavy snowfall events, we examined difference maps of MTS between heavy and light snowfall years for all winter months produced using the data from AMeDAS stations in Hokkaido (Figs. 12a, c). During all heavy snowfall winter months, the magnitudes of positive MTS in western Hokkaido are larger than those in eastern Hokkaido owing to the northwesterly winter monsoon over the Eurasian Continent. In heavy snowfall December months, the AMeDAS stations including Iwamizawa in the coastal regions downstream of the Ishikari Bay have relatively large positive MTS differences (i.e., > 100 cm). Furthermore, the significant positive correlation of MTS amounts at AMeDAS stations in the coastal regions of western Hokkaido near the Ishikari Bay with MTS at Iwamizawa indicates that heavy snowfall at these stations coincides with heavy snowfall at Iwamizawa (Figs. 12d, 13a). During heavy snowfall January months, relatively large positive MTS differences are evident at AMeDAS stations near Iwamizawa (Fig. 12b). Moreover, the MTS at stations near Iwamizawa has a relatively high positive correlation with the MTS at Iwamizawa (Figs. 12e, 13b). The transport of air over the Siberian continent coastal regions with the warm surface-layer ocean anomalies is seen near Iwamizawa (Figs. 6d, 10b), thereby suggesting that these surface-layer ocean anomalies influence snowfall at the AMeDAS stations near Iwamizawa (Fig. 12b). Conversely, during heavy snowfall February months, AMeDAS stations with relatively large anomalies and high correlations are not limited to those near Iwamizawa (Figs. 12c, f, 13c). This is because the heavy snowfall at Iwamizawa occurs even without the warm surface-layer ocean anomaly over the northern Sea of Japan when a cold outbreak associated with the northwesterly winter monsoon is strong.

4. Conclusions and discussion
Iwamizawa is in a region of western Hokkaido that experiences frequent heavy snowfall. This study used reanalysis data to investigate the atmospheric and oceanic circulation anomalies associated with heavy snowfall winter months at Iwamizawa. When heavy snowfall occurs at Iwamizawa, the anomalous northwesterly cold flow associated with a dipole pattern with an anticyclonic anomaly over the Eurasian Continent and a cyclonic anomaly over the northern Pacific Ocean causes cold temperatures over northern Japan during all winter months. In heavy snowfall December and January months, a preceding warm surface-layer ocean anomaly is evident in regions upstream of Iwamizawa during the one and two prior months. The MTS has a statistically significant correlation with the atmospheric circulation over East Asia and the surface-layer ocean temperatures in upstream regions in December and January. During these winter months, relatively large positive MTS anomalies are seen at several AMeDAS stations in the coastal regions of western Hokkaido, particularly those near Iwamizawa. The analysis for evaluating the respective contributions from atmospheric (i.e., cold air temperature, strong wind speed anomalies) and oceanic (i.e., SSTA) anomalies to THFA indicates that the atmospheric contribution plays the most important role in heavy snowfall in all heavy snowfall months. However, in heavy snowfall January months, the warm surface-layer ocean anomaly over the northern Sea of Japan associated with strong TWC anomaly also contributes to the increase in the amount of snowfall at these stations.
The relationship between TWC volume transport at the Tsushima/Korea Strait during summer and autumn and precipitation on the Sea of Japan side of Japan in winter has been reported in previous studies (Hirose and Fukudome 2006; Hirose et al. 2009; Sugimoto and Hirose 2014). Hirose et al. (2009) found that the seasonal mean strength of the TWC at the Tsushima/Korea Strait during autumn (September–November) has a positive correlation with both seasonal mean SST over the Sea of Japan and precipitation over the Sea of Japan side regions during winter (December–February). Additionally, over the central Sea of Japan, the warm SSTA related to increase in TWC volume transport at the Tsushima/Korea Strait during the hot seasons (June–October) enhances the latent heat flux from the ocean, thereby contributing to increased precipitation over northern Japan (Sugimoto and Hirose 2014). This investigation revealed that the strong TWC anomaly increases the surface-layer ocean temperature over the northern Sea of Japan, thereby increasing the amount of snowfall at certain stations in the coastal regions of western Hokkaido during January.
Linear positive trends of SST over the Sea of Japan from the late 1980s to the late 2010s are found during all winter months (Yasunaga and Tomochika 2017). Sensitivity experiments with different boundary conditions for SST over the Sea of Japan revealed that the latent heat flux increase associated with warm SSTA enhances the amount of precipitation over the Sea of Japan side of Japan (Takahashi et al. 2013). Thus, warm SSTA over the Sea of Japan would increase the amount of snowfall over western Hokkaido. Further investigation is required to better understand the potential future changes in precipitation over Hokkaido.
Data Availability Statement
All JMA station datasets are available from the Japan Meteorological Agency (JMA) (available at https://www.jma.go.jp/jma/index.html). In this study, we used the Climate Forecast System Reanalysis data from January 1979 to March 2011 and Climate Forecast System Version 2 data after April 2011 (available at https://rda.ucar.edu/). The JMA radar and MSM data are available from the website of the Research Institute for Sustainable Humanosphere, Kyoto University (available at http://database.rish.kyoto-u.ac.jp/index-e.html).
Acknowledgments
This work was supported by a Grant-in-Aid for Scientific Research (KAKENHI JP22K14103, JP19 K14802, JP19K04647). We thank James Buxton of Edanz (available at https://jp.edanz.com/ac) for correcting a draft of this manuscript. We would also like to thank the editor and the anonymous reviewers for their valuable comments regarding the improvement of the manuscript.
References
- Ando, Y., M. Ogi, and Y. Tachibana, 2015: Abnormal winter weather in Japan during 2012 controlled by large-scale atmospheric and small-scale oceanic phenomena. Mon. Wea. Rev., 143, 54-63.
- Campbell, L. S., W. J. Steenburgh, Y. Yamada, M. Kawashima, and Y. Fujiyoshi, 2018: Influences of orography and coastal geometry on a transverse-mode sea-effect snowstorm over Hokkaido Island, Japan. Mon. Wea. Rev., 146, 2201-2220.
- Fujiyoshi, Y., K. Tsuboki, S. Satoh, and G. Wakahama, 1992: Three dimensional radar echo structure of a snow band formed on the lee side of a mountain. J. Meteor. Soc. Japan, 70, 11-24.
- Fujiyoshi, Y., N. Yoshimoto, and T. Takeda, 1998: A dual-Doppler radar study of longitudinal-mode snowbands. Part I: A three-dimensional kinematic structure of meso-γ-scale convective cloud systems within a longitudinal-mode snowband. Mon. Wea. Rev., 126, 72-91.
- Hirose, N., and K. Fukudome, 2006: Monitoring the Tsushima Warm Current improves seasonal prediction of the regional snowfall. SOLA, 2, 61-63.
- Hirose, N., K. Nishimura, and M. Yamamoto, 2009: Observational evidence of a warm ocean current preceding a winter teleconnection pattern in the northwestern Pacific. Geophys. Res. Lett., 36, L09705, doi:10.1029/2009GL037448.
- Honda, M., J. Inoue, and S. Yamane, 2009: Influence of low Arctic sea-ice minima on anomalously cold Eurasian winters. Geophys. Res. Lett., 36, L08707, doi:10.1029/2008GL037079.
- Hori, M. E., J. Inoue, T. Kikuchi, M. Honda, and Y. Tachibana, 2011: Recurrence of intraseasonal cold air outbreak during the 2009/2010 winter in Japan and its ties to the atmospheric condition over the Barents-Kara Sea. SOLA, 7, 25-28.
- Inatsu, M., S. Tanji, and Y. Sato, 2020: Toward predicting expressway closures due to blowing snow events. Cold Reg. Sci. Technol., 177, 103123, doi:10.1016/j.coldregions.2020.103123.
- Inatsu, M., S. Kawazoe, and M. Mori, 2021: Trends and projection of heavy snowfall in Hokkaido, Japan as an application of self-organizing map. J. Appl. Meteor. Climatol., 60, 1483-1494.
- Inoue, J., M. Kawashima, Y. Fujiyoshi, and M. Yoshizaki, 2005: Aircraft observations of air-mass modification upstream of the Sea of Japan during cold-air outbreaks. J. Meteor. Soc. Japan, 83, 189-200.
- Inoue, J., M. E. Hori, and K. Takaya, 2012: The role of Barents Sea ice in the wintertime cyclone track and emergence of a warm-Arctic cold-Siberian anomaly. J. Climate, 25, 2561-2568.
- Katsumata, M., H. Uyeda, and K. Kikuchi, 1998: Characteristics of a cloud band off the west coast of Hokkaido Island as determined from AVHRR/NOAA, SSM/I and radar data. J. Meteor. Soc. Japan, 76, 169-189.
- Katsumata, M., H. Uyeda, K. Iwanami, and G. Liu, 2000: The response of 36- and 89- GHz microwave channels to convective snow clouds over ocean: Observation and modeling. J. Appl. Meteor., 39, 2322-2335.
- Kawazoe, S., M. Inatsu, T. J. Yamada, and T. Hoshino, 2020: Climate change impacts on heavy snowfall in Sapporo using 5-km mesh large ensemble simulations. SOLA, 16, 233-239.
- Kunoki, S., A. Manda, Y.-M. Kodama, S. Iizuka, K. Sato, I. Fathrio, T. Mitsui, H. Seko, Q. Moteki, S. Minobe, and Y. Tachibana, 2015: Oceanic influence on the Baiu frontal zone in the East China Sea. J. Geophys. Res.: Atmos., 120, 449-463.
- Manda, A., H. Nakamura, N. Asano, S. Iizuka, T. Miyama, Q. Moteki, M. K. Yoshioka, K. Nishii, and T. Miyasaka, 2014: Impacts of a warming marginal sea on torrential rainfall organized under the Asian summer monsoon. Sci. Rep., 4, 5741, doi:10.1038/srep05741.
- Minobe, S., and S. Takebayashi, 2015: Diurnal precipitation and high cloud frequency variability over the Gulf Stream and over the Kuroshio. Climate Dyn., 44, 2079-2095.
- Minobe, S., A. Kuwano-Yoshida, N. Komori, S.-P. Xie, and R. J. Small, 2008: Influence of the Gulf Stream on the troposphere. Nature, 452, 206-209.
- Minobe, S., M. Miyashita, A. Kuwano-Yoshida, H. Tokinaga, and S.-P. Xie, 2010: Atmospheric response to the Gulf Stream: Seasonal variations. J. Climate, 23, 3699-3719.
- Mori, M., M. Watanabe, H. Shiogama, J. Inoue, and M. Kimoto, 2014: Robust Arctic sea-ice influence on the frequent Eurasian cold winters in past decades. Nat. Geosci., 7, 869-873.
- Muramatsu, T., 1979: The cloud line enhanced by upwind orographic features in winter monsoon situations. Geophys. Mag., 38, 1-15.
- Nakamura, T., K. Yamazaki, K. Iwamoto, M. Honda, Y. Miyoshi, Y. Ogawa, and J. Ukita, 2015: A negative phase shift of the winter AO/NAO due to the recent Arctic sea-ice reduction in late autumn. J. Geophys. Res.: Atmos., 120, 3209-3227.
- Nakanowatari, T., K. Sato, and J. Inoue, 2014: Predictability of the Barents Sea ice in early winter: Remote effects of oceanic and atmospheric thermal conditions from the North Atlantic. J. Climate, 27, 8884-8901.
- Ninomiya, K., 1968: Heat and water budget over the Japan Sea and the Japan Islands in winter season. J. Meteor. Soc. Japan, 46, 343-372.
- Ninomiya, K., 1994: A Meso-scale low family formed over the northeastern Japan Sea in the northwestern part of a parent polar low. J. Meteor. Soc. Japan, 72, 589-603.
- Ohtake, H., M. Kawasaki, and Y. Fujiyoshi, 2008: The formation mechanism of a thick cloud band over the northern part of the Sea of Japan during cold air outbreaks. J. Meteor. Soc. Japan, 87, 289-306.
- Saha, S., S. Moorthi, H.-L. Pan, X. Wu, J. Wang, S. Nadiga, P. Tripp, R. Kistler, J. Woollen, D. Behringer, H. Liu, D. Stokes, R. Grumbine, G. Gayno, J. Wang, Y.-T. Hou, H.-y. Chuang, H.-M. H. Juang, J. Sela, M. Iredell, R. Treadon, D. Kleist, P. Van Delst, D. Keyser, J. Derber, M. Ek, J. Meng, H. Wei, R. Yang, S. Lord, H. van den Dool, A. Kumar, W. Wang, C. Long, M. Chelliah, Y. Xue, B. Huang, J.-K. Schemm, W. Ebisuzaki, R. Lin, P. Xie, M. Chen, S. Zhou, W. Higgins, C.-Z. Zou, Q. Liu, Y. Chen, Y. Han, L. Cucurull, R. W. Reynolds, G. Rutledge, and M. Goldberg, 2010: The NCEP climate forecast system reanalysis. Bull. Amer. Meteor. Soc., 91, 1015-1058.
- Saha, S., S. Moorthi, X. Wu, J. Wang, S. Nadiga, P. Tripp, D. Behringer, Y.-T. Hou, H.-y. Chuang, M. Iredell, M. Ek, J. Meng, R. Yang, M. P. Mendez, H. van den Dool, Q. Zhang, W. Wang, M. Chen, and E. Becker, 2014: The NCEP Climate Forecast System version 2. J. Climate, 27, 2185-2208.
- Sato, T., and S. Sugimoto, 2013: A numerical experiment on the influence of the interannual variation of sea surface temperature on terrestrial precipitation in northern Japan during the cold season. Water Resour. Res., 49, 7763-7777.
- Sato, K., J. Inoue, and M. Watanabe, 2014: Influence of the Gulf Stream on the Barents Sea ice retreat and Eurasian coldness during early winter. Environ. Res. Lett., 9, 084009, doi:10.1088/1748-9326/9/8/084009.
- Sato, K., A. Manda, Q. Moteki, K. K. Komatsu, K. Ogata, H. Nishikawa, M. Oshika, Y. Otomi, S. Kunoki, H. Kanehara, T. Aoshima, K. Shimizu, J. Uchida, M. Shimoda, M. Yagi, S. Minobe, and Y. Tachibana, 2016: Influence of the Kuroshio on mesoscale convective systems in the baiu frontal zone over the East China Sea. Mon. Wea. Rev., 144, 1017-1033.
- Sato, K., J. Inoue, A. Yamazaki, J.-H. Kim, M. Maturilli, K. Dethloff, S. R. Hudson, and M. A. Granskog, 2017: Improved forecasts of winter weather extremes over midlatitudes with extra Arctic observations. J. Geophys. Res.: Oceans, 122, 775-787.
- Sato, K, J. Inoue, I. Simmonds, and I. Rudeva, 2021: Antarctic Peninsula warm winters influenced by Tasman Sea temperatures. Nat. Commun., 12, 1497, doi:10.1038/s41467-021-21773-5.
- Shirakawa, T., and T. Kameda, 2019: Snow surveys of central and eastern Hokkaido from 2014 to 2018, and meteorological elements affecting snow grain type. Seppyo, 81, 163-182 (in Japanese with English abstract).
- Sugimoto, S., and N. Hirose, 2014: Variations in latent heat flux over the eastern Japan Sea in December. SOLA, 10, 1-4.
- Takahashi, H. G., 2021: Long-term trends in snowfall characteristics and extremes in Japan from 1961 to 2012. Int. J. Climatol., 41, 2316-2329.
- Takahashi, H. G., and T. Idenaga, 2013: Impact of SST on precipitation and snowfall on the Sea of Japan side in the winter monsoon season: Timescale dependency. J. Meteor. Soc. Japan, 91, 639-653.
- Takahashi, H. G., N. N. Ishizaki, H. Kawase, M. Hara, T. Yoshikane, X. Ma, and F. Kimura, 2013: Potential impact of sea surface temperature on winter precipitation over the Japan Sea side of Japan: A regional climate modeling study. J. Meteor. Soc. Japan, 91, 471-488.
- Takano, Y., Y. Tachibana, and K. Iwamoto, 2008: Influences of large-scale atmospheric circulation and local sea surface temperature on convective activity over the Sea of Japan in December. SOLA, 4, 113-116.
- Takaya, K., and H. Nakamura, 2013: Interannual variability of the East Asian winter monsoon and related modulations of the planetary wave. J. Climate, 26, 9445-9461.
- Tanimoto, Y., H. Nakamura, T. Kagimoto, and S. Yamane, 2003: An active role of extratropical sea surface temperature anomalies in determining anomalous turbulent heat flux. J. Geophys. Res., 108, 3304, doi:10.1029/2002JC001750.
- Tsuboki, K., Y. Fujiyoshi, and G. Wakahama, 1989: Doppler radar observation of convergence band cloud formed on the west coast of Hokkaido Island. II: Cold frontal type. J. Meteor. Soc. Japan, 67, 985-999 (with Japanese abstract).
- Yasunaga, K., and M. Tomochika, 2017: An increasing trend in the early winter precipitation during recent decades along the coastal areas of the Sea of Japan. J. Hydrometeor., 18, 2893-2906.
- Yoshimoto, N., Y. Fujiyoshi, and T. Takeda, 2000: A dual-Doppler radar study of longitudinal-mode snowbands. Part II: Influence of the kinematics of a longitudinal-mode snowband on the development of an adjacent snowband. J. Meteor. Soc. Japan, 78, 381-403.
- Yoshizaki, M., T. Kato, H. Eito, S. Hayashi, and W.-K. Tao, 2004: An overview of the field experiment “Winter Mesoscale Convective Systems (MCSs) over the Japan Sea in 2001”, and comparisons of the cold-air outbreak case (14 January) between analysis and a non-hydrostatic cloud-resolving model. J. Meteor. Soc. Japan, 82, 1365-1387.


