Article
Development of a Nocturnal Temperature Inversion in a Small Basin Associated with Leaf Area Ratio Changes on the Mountain Slopes in Central Japan
2022 Volume 100 Issue 6 Pages 913-926

Details
2022 Volume 100 Issue 6 Pages 913-926
Nocturnal temperature inversion (NTI) is an important factor characterizing the local climate in mountainous areas. In central Japan, most of the mountain slopes are covered by forests, but the effects of their leaf expansion/fall on the NTI variations in basins have not been clarified. According to a 3-year leaf area index observation in the mixed forest of the Sugadaira Highland (1320 m a.s.l), Nagano Prefecture, Japan, we identified weakening of the NTI associated with leaf expansion and strengthening after leaf fall in a small basin. Using digital elevation and land-cover data, we defined the distribution of the deciduous and mixed forests in the catchment area of nocturnal cold-air drainage. The estimated timings of leaf expansion/fall at the catchment scale based on the effective cumulative temperature almost coincided with the NTI changes. Micrometeorology observations showed that NTI at the forest floor and downslope winds at the adjacent grassland strengthened during the dormant (leafless) season in the nighttime when the radiative cooling is strong. Calm and clear nights were selected during the spring dormant season and the summer growing season for 22 nights and 30 nights, respectively. The heat loss during the cold-air pool development was estimated and converted to storage heat flux in the forest areas. The storage heat flux was 3.8 W m−2 more on average in the growing season than in the dormant season, and it was less than that of forests estimated in previous studies (several 10 W m−2), indicating that an increase in storage heat flux of the forests with leaf expansion could cancel nocturnal radiative cooling and weaken gravity currents at the forest floor.
Forests are acting as an interface in exchanging water-energy flux between land surface and the atmosphere (Mencuccini et al. 2003). At mesoscale, they control the heat budget through the change in albedo, interception and evapotranspiration at the crown and indirectly modify the process of cloud formation and water cycle (Ellison et al. 2017; Bosman et al. 2018). At microscale, they increase the roughness in the atmospheric boundary layer absorbing the momentum flux and reduce the surface wind speed (Garratt 1992). Forest crowns shield the forest floor from sunshine and increase downward long-wave radiation, which reduces diurnal change in the surface air temperature (Hardwick et al. 2015; Geiger et al. 2003). Such mitigation effects could change not only the ecosystem environment in the forests (von Arx et al. 2013; De Frenne et al. 2013) but also the microclimate around the forests, including soil erosion processes at the floor (Ueno et al. 2015).
People in montane areas tend to live in the basin and valley where nocturnal temperature inversion (NTI) prevails, and the evolution of the cold-air pool with the NTI is sensitive primarily to ambient atmospheric conditions (Dorninger et al. 2011). Conversely, Kiefer and Zhong (2013) demonstrated by a numerical study that sidewall forests strongly affect the temperature inversion to develop cold-air pools. In Japan, the atmospheric heat budget in a basin and thermally induced local circulations between the central mountain areas and the Kanto Plain have been investigated (Kondo et al. 1989; Kimura and Kuwagata 1993; Lee and Kimura 2001). Enhancement of the coastal precipitation system or local circulation in the basin due to mountain-induced katabatic winds has been reported (Tachibana 1995; Uehara et al. 2020). Iijima and Shinoda (2000) identified the seasonal differences of the cold-air pool formation in a hollow in the subalpine areas of the Yatsugatake Range. However, those studies did not consider mountain forests explicitly as a surface boundary condition, and their contribution to the nocturnal local climate has not been fully discussed.
The effects of global-scale climate change on the phenology of mountain forests have been indicated (Diaz et al. 2003). For instance, a longer growing season for deciduous forests due to global warming has been reported (Menzel et al. 2006; Vitasse et al. 2009). Changing of the forest phenology could modify the air temperature and precipitation pattern in the surrounding environments through mesoscale boundarylayer dynamics (Hogg et al. 2000). Wind and stability below the canopy in a deciduous forest causes evident contrasts between the leaf-on and leaf-off seasons against the mountain-valley circulations (Wang et al. 2014). Devito and Miller (1983) observed that nocturnal cold-air drainage prevails in the forest during the leafless phase. Staebler and Fitzjarrald (2005) noted that the impact of leaf area changes on subcanopy flows is more evident at night. Froelich et al. (2011) pointed out the importance of considering the heat storage of physical elements in the canopy to model canopy air cooling. Swenson et al. (2019) also demonstrated that biases in the surface heat flux estimated by the community land model relate to the lack of heat storage in vegetation biomass.
In central Japan, many of the cool temperate forests in mountainous areas are composed of deciduous trees, such as the Japanese larch. Tadaki et al. (1994) studied the altitudinal dependency of the growth of deciduous tree leaves on temperature. Nagai et al. (2015) detected the timing of leaf expansion/fall at different altitudes using satellite data and evaluated the relationship between the timing and daily mean temperature using Automated Meteorological Data Acquisition System (AMeDAS) data from the Japan Meteorological Agency (JMA). Most of the AMeDAS stations are located in the valley or basin in mountainous areas, and a small number of them were more than 1000 m a.s.l. Therefore, applying extrapolation for temperature estimation at high elevations is done without consideration of the effects of forest phenology in the neighboring mountains on the AMeDAS data.
Local climate changes in the Sugadaira Highland, Nagano Prefecture, Japan, have been observed using multiple automatic weather stations with a forest tower placed in the mixed forest of Sugadaira Research Station (SRS), part of the Mountain Science Center of the University of Tsukuba. This study revealed the relation between the seasonal change in leaf area index (LAI) and the formation of a cold-air pool over a small basin during snow-free seasons. Specifically, the microscale meteorology around the forest was observed to identify the formation of nocturnal gravitationally induced drainage flows as a function of LAI changes during the highland-scale radiative cooling nights. We also assessed catchment-area LAI changes that could contribute to the storage heat flux of daytime forest and compared them with the amounts of heat loss to develop cold-air pool estimated for each before and after the leaf expansion.
The Sugadaira Highland area is [36.51–36.55°N, 138.30–138.36°E] (Fig 1a), with an altitude range of 1200–1500 m a.s.l, along the western slope of Mt. Nekodake (2207 m) (Fig 1b). The highland is located between the Nagano (northwest) and Ueda (southwest) basins, where the synoptic winds prevail along a south-north direction around the western edge of the Echigo mountain range. A small basin (called the Sugadaira basin) exists between Mt. Ohmatsuyama (1649 m) and Mt. Taroyama in the highland. Croplands and sports grounds occupy in the basin bottom, and the mountain slopes are covered by deciduous trees [mostly Larix kaempferi (Japanese larch), Betula platyphylla (Japanese white birch), and Quercus crispula (Japanese oak)] and evergreen trees [mostly Pinus densiflora (Japanese red pine)]. Grasslands used for gelande and pastureland also spread along the mountain slopes where Nakamura (1976, 1978) observed the characteristics of gravity currents due to radiative cooling. Kudoh et al. (1982) and Toritani (1985) revealed the development of an inversion layer with an 80–90 m depth in the basin synchronizing the occurrence of gravity currents in the case of calm nocturnal weather.

(a) Topography of central Japan, showing the location of the Sugadaira Highland (black box). (b) Topography around the Sugadaira basin (solid line), with observation points of the AME (blue mark), SRS (green mark), and temporal temperature observations (red crosses). (c) Land cover at the SRS (white dashed lines) with the locations of observation sites (SRS1, CGS, and FTS) and a location of mixed forest (X). The aerial photograph was taken in 2011 and provided by the SRS.
The land-cover condition of the highland was captured in the 2015 European Space Agency Climate Change Initiative Land Cover (ESA CCI-LC) data (Defourny et al. 2017). Synoptic-scale weather conditions, especially for the identification of calm and clear nights, were diagnosed using fifth-generation European Centre for Medium-Range Weather Forecasts atmospheric reanalysis (ERA5) data (Hersbach et al. 2020) and JMA Meso-Scale Model (MSM) data. The grid and temporal scales of each objective analysis data set are 0.1° × 0.125° resolution and every 3 hours for constant pressure levels and 0.05° × 0.0625° and every hour at the surface, respectively. Digital Elevation Model (DEM) data with a 5 m interval, produced by the Geospatial Information Authority of Japan, was used to determine a catchment producing nocturnal cold-air drainage to contribute cold-air pool formation. Snow-cover fractions were identified by the 500 m interval snow ratio data provided by the Moderate Resolution Image Spectroradiometer, NASA and Visible Infrared Imaging Radiometer Suite, Snow and Ice Global Mapping Project (MOD10A1 Snow Products) (Hall and Riggs 2016).
2.2 Observation sitesFixed-point meteorological observation was conducted at the Sugadaira AMeDAS station (AME, 36.533°N, 138.325°E, 1253 m a.s.l) and SRS1 at the SRS (36.524°N, 138.347°E, 1320 m a.s.l), where the air temperature (1.5 m level, platinum resistance thermometer with a ventilated shield, 0.1°C accuracy), precipitation (0.5 mm heated tipping bucket with a wind shield), and snow depth (laser sensor, 1 mm accuracy) were measured (Figs. 1b, c). The temperature difference between the AME and SRS1 was used to detect the NTI over the Sugadaira basin.
The SRS area is composed of grasslands (6 ha) and forests (22.5 ha) covered with Sasa albo-marginata at the floor (Fig 1c). The forests are composed of evergreen trees (4 ha), predominantly Japanese red pine, and deciduous broadleaf trees (14 ha). Mixed forests (4.5 ha) are distributed in the center (Fig 1c, marked with an X), where a temperature profile at six levels with solar radiation, wind direction/speed, and atmospheric pressure at the tower top (approximately 22 m high) were observed by an automated weather station (RX3000 data logger with smart sensors; Onset Co.) as the forest-tower station (FTS, 36.521°N, 138.353°E, 1335 m). Using this station, Ueno et al. (2017) reported that the shading effects of tree crowns under different forest phenology conditions affect the diurnal and seasonal variation of temperature gradients in the forest. An LAI sensor (MIJ-15LAI; Environmental Measurement Japan Co.) was set near the forest tower (4 m south, 2 m above the ground) on April 2018, where seasonal changes in photosynthetically active radiation (PAR, 400–700 nm) and near-infrared radiation (NIR, 700–1000 nm) were automatically measured.
Meteorological conditions outside the forest, such as wind speed and direction at 3 m and temperature and humidity at 1.3 m and 3 m above ground level, were monitored at the campus grass site (CGS) using the same type of an automated weather station at the FTS. A four-component (upward/downward short/long-wave) radiation sensor (CNR4; Kipp & Zonen Co.) was also set, and net radiation (Rn) was measured. Thermistor temperature sensor with a data logging system (U23 and THB type; Onset Co.) at the FTS and CGS was equipped with a natural ventilated shield (0.2°C accuracy and 3-minute time constants in catalog specification). Additional air-temperature observations were conducted using the U23 type system at 3 m with a standing pole from August 2020 to July 2021 at three points (1258, 1295, and 1456 m; Fig 1b, crosses) to monitor the depth of the NTI (observation at 1456 m terminated on November 2020). The data interval was 10 minutes except for 1 hour at the AME and SRS1. In winter, a snow depth of approximately 80 cm occurs in the SRS with heterogeneous redistribution due to windy weather (Ueno et al. 2007). The snow-cover condition was monitored using snow-depth sensors at AME and SRS1 and an albedo sensor at the FTS to identify snow-covered periods.
Using LAI sensor data, the LAI was estimated every 10 minutes by an empirical formula from Kume et al. (2011) based on the tendency of more absorption/scattering of PAR than of NIR at the forest floor due to an increase in the LAI at the crown. As the sensors measure instantaneous radiation without a ventilation system, estimated values sometimes showed an abnormal range with snow/leaf caps, direct insolation, and sunfleck. This study filtered original 10-minute interval data to obtain daily values according to the following steps: (1) daytime values during 10:00–14:00 Japan Standard Time (JST) were used; (2) only the cloudy periods (solar radiation in a range of 50–500 W m−2 at the top of the tower) were nominated; (3) data with (NIR − PAR)/PAR between 0.2 and 1.5 were used; and (4) LAI values more than ±σ (standard deviation) from the daily average were excluded; the candidates were re-averaged to obtain daily data.
Intraseasonal changes of the daily LAI at the FTS were examined for 3 years (2018–2020) (Fig 2a). The records showed an increase in LAI to approximately 3 m2 m −2 from May to September and a decrease to approximately 1 m2 m −2 from October to April (Fig. 2a), obviously indicating the leaf expansion and leaf fall from those deciduous trees. The rate of increase of the LAI in spring was larger than the rate of decrease in autumn, especially in 2018. Nasahara et al. (2008) observed a seasonal change in canopy LAI from 0 to 5 m2 m−2 using LAI-2000 and TRAC sensors based on indirect optical methods at the Takayama site in Gifu Prefecture, central Japan. Kuribayashi et al. (2020) measured the LAI change at the SRS for larch trees using the interval camera method, showing similar timing of leaf expansion and leaf fall with a slightly different amplitude. We defined the dormant season (spring/autumn), leaf-expansion season, growing season, and leaf-fall season using thresholds of 1.5 and 2.0 m2 m−2 of the daily LAI for 3 years (Table 1a).

(a) Seasonal changes in the daily LAI at the FTS. (b) Daily maximum snow depth at the AME and SRS1. (c) Daytime average albedo changes at the FTS. Gray areas indicate no data.

Seasonal changes in the daily maximum snow depth at the AME and SRS1 sites (Fig 2b) were compared with daily albedo changes at the FTS (Fig 2c), where the daily albedo is calculated by averaging daytime (10:00–14:00 JST) 10-minute interval values and screening out the abruptly low values due to snow caps and precipitation. There are 67 m altitudinal differences between the AME and SRS1, but the tendency of day-to-day snow-depth change was similar. Snow-cover periods (more than 30 days of continuous snow) at SRS1 occurred from December to April (Table 1b). The albedo changed at the FTS indicated that snow cover also existed in the forest for periods similar to those at SRS1 except for the later increase in albedo approximately 350–365 DOY (day of year) due to S. albo-marginata at the forest floor that interrupted the ground snow cover. The timing of the leaf expansion/fall in the mixed forest and the start/end of snow cover was different among years (Tables 1a, b). The winter of 2019–2020 was extremely warm with a short snow-cover period; however, the timing of leaf expansion in 2020 was not different from that in other years. We speculated that the effective cumulative temperature (ECT) of the precursor months (e.g., April and May) in 2020, which could affect the leaf expansion of deciduous trees, was not much different from those in other years.
Temporal changes in the surface air-temperature difference between the AME and SRS1 for 8 years, as functions of DOY and JST, are shown in Fig 3. The blue (negative) areas indicated the occurrence of NTI (the temperature at the AME is cooler than that at SRS1). The NTIs were dominant in cold seasons, and they were sometimes interrupted due to windy days by synoptic-scale disturbances (figures omitted). Furthermore, the NTI was diminished in the warm season, such as 150–270 DOY. The start/end of the snowcover and leaf-expansion/fall seasons at the FTS (Table 1) are indicated by blue arrows and red bars after the 2017 winter (Fig 3). It is surprising that the timing of leaf expansion/fall clearly corresponded to that of the weakening/strengthening of the NTI, whereas the starts/ends of snow cover were not related. Additional air-temperature observations between the AME and SRS1 (Fig 1b, cross marks) showed that the NTI was mostly limited below the altitude of the SRS and the thickness of the NTI increased as the temperature difference between the AME and SRS1 increased. In other words, the negative temperature difference in Fig 3 indicates the development of a nocturnal coldair pool in the Sugadaira basin. Particularly, evolution of the nocturnal cold-air pool corresponded to the seasonal LAI changes of the forest crown in the upstream mountain slope.

Time-DOY cross-sections of the hourly air-temperature differences between the AME and SRS1 for 8 years. Each column is composed using the time sequence as a function of DOY and local time starting at 9:00 JST. Blue (red) areas indicate cooler (warmer) temperatures at the AME than at the SRS1. Leaf expansion/fall seasons in Fig 2a are shown as red vertical bars, and the start and end of snow-cover seasons in Fig 2b are indicated by blue horizontal arrows. Gray areas indicate no data.
Drainage flows on the mountain slopes start with the onset of radiative cooling to develop a nocturnal cold-air pool in the basin (Mahrt and Heald 2015). Maki et al. (1986) demonstrated that approximately 80 % of the observed cooling of the whole nocturnal boundary layer in a basin is attributed to horizontal advective cooling from the surrounding mountain slopes when the winds of free atmosphere are weak. We examined the seasonal changes in surface winds around the forest in relation to the development of the cold-air pool. First, calm and clear nights, which are conducive to the forming of a cold-air pool, were selected using MSM and AME data following criteria such as (A) no daily precipitation records at the AME with (B) an averaged (maximum) wind speed from the MSM data at 850 hPa from 18:00 JST to 6:00 JST of less than 7 m s−1 (9 m s−1) at the closest grid point (36.5°N, 138.375°E). The thresholds of wind speed were determined based on the results of Petkovšek (1992). The days with snow cover observed at the AME and MOD10A1 snow products in the Sugadaira Highland were excluded. Seasonal changes in the nocturnal (from sunset to sunrise) averaged surface air-temperature gradient (SATG) and wind speed in the downslope direction (WSDD) at the CGS outside the mixed forest were compared with the changes in LAI and intensity of the temperature inversions (ITIs) at the FTS in the forest in 2019 (Fig 4). The SATG is a vertical temperature gradient calculated as the 1.3 m temperature minus 3.0 m one at the CGS and the 1.0 m one minus the 5.3 m one at the FTS with normalized by the distance. The ITI is the integration of the hourly temperature difference between the AME (1253 m) and SRS1 (1320 m) when the temperature of AME is lower than that of SRS1 during the hours from sunset to sunrise. The negative SATGs, indicating a stable surface boundary layer at night, dominated at CGS (grassland) throughout the season (Fig 4b, black dots). Weak inversion also occurred at FTS (in the forest) in the dormant seasons (Fig 4b, white dots), but it almost disappeared during the growing season. The disappearance of temperature gradient at the forest floor may have corresponded with the reduction in radiative cooling due to the increase in downward long-wave radiation as observed by Ueno et al. (2017). Additionally, the WSDD at the CGS clearly diminished during the growing season (Fig 4c) with the reduction of the ITI (Fig 4d). We could not observe the WSDD in the forest with the automatic weather station because the wind speed was mostly weaker than the detectable range of mechanical wind speed sensor. However, temporal surface wind speed observation using an ultrasonic anemometer from August to November 2020 at the FTS showed an increase in WSDD with the LAI decrease (figures omitted). The results indicated that nocturnal downslope winds were reduced both at the grassland surface and at the forest floor with the weakening of cold-air pool development, even though the stable surface boundary layer prevailed outside the forest.
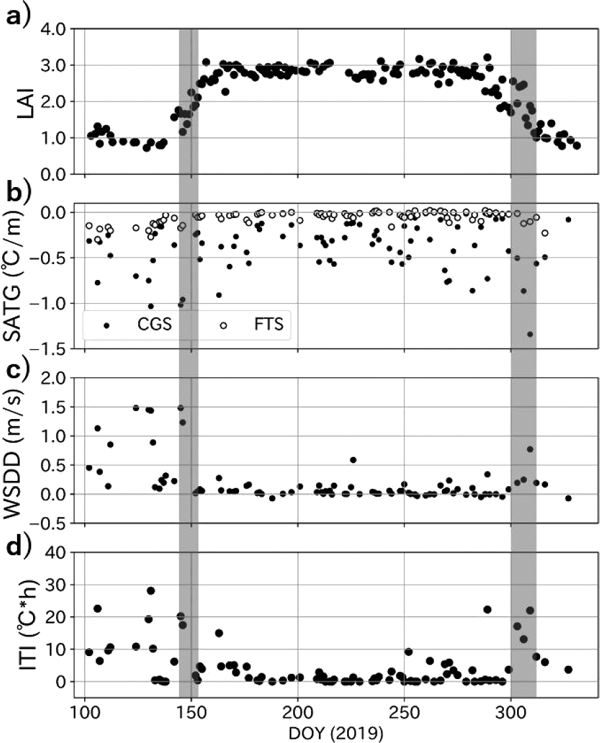
Time sequences of the (a) daily LAI, (b) nocturnal SATG (normalized by sensor height) at the CGS and FTS, (c) nocturnal WSDD at the CGS, and (d) ITI in April-December 2019. Gray bars indicate seasons of leaf expansion/fall at the FTS.
Seasonal differences in the long-wave radiation balance primarily change the intensity of nocturnal cooling in a high mountain hollow (Iijima and Shinoda 2002). Maki and Harimaya (1988) revealed that reduction of downward long-wave radiation affected by the accumulation of cold air in the basin is fed back to enhance the nocturnal cooling at the basin bottom, especially in a deep basin such as at a depth (surrounding mountain height) of 500 m. However, this effect was small for the shallow basin less than 100 m depth such as the Sugadaira basin. Again, we compared the SATG and WSDD/ITI between the high and low LAI days (corresponding to the growing and dormant seasons) in Fig 5 as a function of surface Rn for 3 years on clear and calm nights without snow cover, where the surface Rn was adopted from the nearest grid point value on the ERA5 data (Rn-ERA) to represent a mesoscale radiative cooling condition over the highland. The Rn-ERA showed significant correlation with the Rn observed at the CGS, and seasonal changes in Rn at the CGS did not relate to forest growth/leaf fall (figures omitted). Therefore, the variance of Rn-ERA in Fig 5 is mainly dependent on the seasonal change in mesoscale surface skin temperature, including the effects of downward long-wave radiation from the atmosphere, as demonstrated by Maki and Harimaya (1988), and cloud covers. A nocturnal negative SATG (i.e., stable surface boundary layer) prevailed in the grassland for high and low LAI days and strengthened on stronger radiative cooling nights (less than approximately −60 W m−2 in the Rn-ERA) (Fig 5a). In the forest, the tendency for SATG is the same for high LAI days but was depressed for low LAI days (Fig. 5b). In the grassland, the WSDD increased (downslope winds prevailed) on stronger radiative cooling nights only for low LAI days (Fig 5c). Differences between the growing and dormant seasons were evident especially for stronger radiative cooling nights, and they were associated with increases in the ITIs (Fig. 5d, right). The tendency confirmed that nocturnal downslope winds contributing to the development of the cold-air pool were especially enhanced during the dormant season with the highland-scale strong radiative cooling condition.

Nocturnal averaged SATG at the (a) grassland and (b) forest floor as a function of Rn-ERA. The same for WSDD at the grassland (c) and ITI (d). Left (right) figures indicate a daily LAI of more (less) than 2.5 (1.0). R and N correspond to the correlation coefficient and sample number for linear regression, respectively, and * is the significant correlation at the 1 % level.
Heat-budget analysis has been proposed as a basic methodology to assess the consistency of nocturnal boundary-layer development and radiation balance (Kondo et al. 1989). The consistency of cold-air pool development due to a decrease in the LAI was examined by means of a simple heat-budget theory, paying special attention to canopy heat storage. A basic land-surface heat budget without advection terms can be described by the following Formula (1) during a snow-free season:
 |
 |
 |
Previous sections used an LAI point measured at the FTS to discuss the linkage between the variability in nocturnal downslope winds and the temperature inversion layer. The actual S depends on the tree species and their ages and numbers, and areal evaluation of S in the mixed forests or even at the catchment scale is difficult using point measurements. Timing of leaf expansion/leaf fall also shifts depending on the elevation and local topography (Pellerin et al. 2012). Therefore, this study estimated the heat-amount difference in the atmospheric volume over the basin with and without apparent NTI, corresponding to the dormant and growing seasons, and compared it with the S estimated in previous studies. The following steps were conducted: (i) defining a catchment of the basin (drainage area) in the Sugadaira Highland that provides gravity currents, (ii) comparing LAI changes measured a point and at the catchment scale to consider the timing shift of leaf expansion/leaf fall, and (iii) calculating the amounts of atmospheric heat loss to form the cold-air pool.
For step (i), nocturnal gravity currents in the surface boundary layer were assumed to run off as land-surface water flow. At first, a 5 m interval DEM was smoothed in a spatially moving average within 3 × 3 grids to filter the microtopography. An area of a basin bottom (Fig 6a, surrounded by a solid line) was set, and adjacent grids with higher elevation were included as a target catchment on the 30-meter interval. This interval was adjusted to the grid size of the ESA CCI-LC data. Figure 6a shows the drainage area with four land-cover types defined in the ESA CCI-LC data, where pastures (including grassland, cropland, and sports grounds), mixed forests, and deciduous forests occupy 48, 17, and 32 % of the area, respectively. The mixed forest of the FTS in the SRS exists at the southern edge of the basin (Fig 6a, marked by an X), but it was categorized as a deciduous forest by the ESA CCI-LC data. Figure 6b shows the altitudinal changes in the occupancy of land covers. The forest percentage increases above the 1400 m level, compared to the percentage of grassland/cropland, except at the 1600 m level, in which deciduous tree and mixed forests occupy 65 % of the total coverage of the forests.

(a) Estimated drainage areas (highlight yellow and green colors) with land cover and observation points. A solid black area, Y, indicates the basin bottom, and X indicates the location of mixed forest at the SRS. (b) Altitudinal changes of areas depending on the land cover.
Nagai et al. (2015) investigated the timing of the start/end of the growing season for deciduous trees in central Japan, which can be estimated based on the ECT using daily AME temperature data (Ti) with the following formulas:
 |
 |
The calculation was conducted for 2018–2020, and the DOYs of the start of the leaf-expansion season and the end of the leaf-fall season were averaged to show the catchment-scale duration of the growing season with altitudinal transition (Fig 7a). Seasonal changes in the observed daily LAI at the FTS (1335 m) are also shown (Fig 7b). According to our estimation, it takes almost 1 month to complete the leaf-expansion and leaf-fall seasons within the drainage area. If we focus on the mountain side slopes around the basin below 1600 m, leaf-expansion/fall was almost completed within 2 weeks. Even if we considered those catchment-scale time lags of the leaf expansion/fall (e.g., approximately 10–20 DOY) as part of the time range (Fig 3, red bars), the timings of abrupt change in NTI were almost the same as the basin-scale LAI changes.

Seasonal changes in (a) estimated growing seasons (including leaf-expansion and leaf-fall seasons) depending on altitude and (b) the daily LAI at the FTS for 3 years.
Regarding step iii, clear and calm nights without snow cover from April 2013 to September 2020 were nominated to increase the number of samples for heat-budget analysis. Catchment-scale dormant/growing seasons were redefined in each year using the 3 years average of ECTSGS and ECTEGS at FTS, where the “catchment scale” of each season is defined as the periods when all of the elevations were categorized as being in a nongrowing (dormant) or growing season. Candidates were 112 days in the dormant season (spring), 378 days during the growing season, and 48 days in the dormant season (autumn). As the depth of the temperature inversion cannot be identified in this study, the amount of heat loss in the air according to the NTI development was calculated from below 1320 m to the basin bottom beginning at sunset for 6 hours. Based on the past observational study by Toritani (1985), the upper elevation as 1320 m is reasonable to capture the NTI. We confirmed that temperature at the AME and the southeastern point at the basin bottom correlated with each other, indicating that the AME temperature is representative of the basin bottom. To highlight the condition of nocturnal radiative cooling, night-averaged Rn values at the nearest grid point of the ERA5 data within −70 W m−2 to −60 W m−2 were extracted for 23 nights in the spring dormant season and 31 nights in the growing season. For the candidate days, the hourly potential temperature was calculated at 10 m altitude intervals by temperature interpolation between the AME and SRS1 and atmospheric pressure at SRS1.
The amounts of heat loss (ΔLj) required for temperature cooling at a certain altitude ( j) were calculated as follows:
 |
 |
This study found abrupt changes in the development of the nocturnal cold-air pool in a small basin associated with leaf expansion and leaf fall at a mountain slope mixed-forest site for multiple years. A catchmentscale estimation for the timing of leaf expansion/fall using the ECT coincided with the NTI changes. Croplands in the pasture (Fig 6), where lettuce is cultivated, occupy 15 % of the land, and they change the seasonal land-cover condition. However, the occupancy area is small, and the timing of planting/mowing differs from the LAI changes (Fig 3) and the snowcover condition. Therefore, the NTI changes were not due to the starting/ending of cultivation or occurrences of snow cover. Surface wind and temperature gradient data around the forests confirmed that nocturnal downslope winds contributing to the development of the cold-air pool were especially enhanced in the dormant season in cases of highland-scale strong radiative cooling days. Chen and Yi (2012) noted that optimal conditions for katabatic flows within the canopies are controlled not only by the slope angle but also by the canopy structure. Additionally, Kiefer and Zhong (2013) demonstrated that the NTI in a valley is controlled by the amount of sidewall vegetation. Therefore, we concluded that LAI changes in the mountain forest affected seasonal changes in the development of a nocturnal cold-air pool in the Sugadaira Highland. This means that temperature records at the Sugadaira AMeDAS, one of the representative JMA stations with a high elevation in Nagano Prefecture, are also affected by forest phenology.
According to the heat-budget analysis, the heatamount difference in cold-air pool development before and after the LAI changes was nearly the same or smaller than the total storage heat flux of forest in previous studies. Temporal fluctuations of the nocturnal temperature differences between the AME and SRS1, indicating the NTI in the basin, corresponded to the observed Rn fluctuation at the CGS due to cloud amount changes in several 10 W m−2 (figures omitted). Therefore, the order of estimated heat flux difference (Ldif), such as in several W m−2, is also reasonable to impact on cold-air pool development. The results indicated that daytime forest heat-storage variabilities can compensate for nocturnal radiative cooling from the canopy. Conversely, the effects of LAI changes on the dynamics of catchment-scale drainage flow are rather complicated. For instance, Yi et al. (2005) revealed the presence of a very stable layer at the maximum leaf area density in a subalpine forest and that nighttime drainage flows in the forest are restricted to a relatively shallow layer of air beneath the canopy. Yi (2008) also demonstrated that Reynolds stress to characterize the S-shaped wind profile (Shaw 1977) of drainage flows in the forest can be predicted by the LAI. Particularly, the difference in LAI changes—not only the balance between radiative cooling and heat flux at canopy level but also the wind speed and stability profile in the forest—could modify the heat advection with downslope winds from the forests. Such dynamics would modify the development speed of the cold-air lake and its depth, which this study could not evaluate. At the same time, forest distribution is not uniform but patchy in the Sugadaira Highland (Fig. 6a), and katabatic flows on the upper grasslands may be hampered by the calm air mass in the downstream forests during the growing season. To understand the mechanism of three-dimensional discharges from the forested areas according to the LAI changes, we need to deploy a dense microclimate observation network with modeling strategy. Especially, numerical simulation that could present a realistic forest structure/distribution is expected, along with the preparation of observed boundary-condition data.
The timing of observed leaf expansion/fall varied over several weeks depending on the year; for instance, earlier snow melts for several weeks in 2020 did not accompany earlier leaf expansion. Furthermore, the areal estimated LAI showed later greening and earlier leaf fall at the basin bottom than at the SRS elevation. Schuster et al. (2014) also pointed out that cold-air pools have a considerable impact on the growth period of deciduous trees. This evidence raises interesting questions, such as if upper-stream LAI changes could control the downstream LAI through the weakening of NTI during a dormant season as feedback if the ECT is a key factor. Then, which ECT subseason is important for leaf expansion? Detailed identification of the spatial LAI changes using fine constellation satellite data, such as by the Sentinel mission by the European Space Agency, is expected.
The Sugadaira basin is only part of the upstream hollow in complex terrains, and the cold-air drainage flows finally accumulate in the downwind areas such as the Ueda basin, where human activities are concentrated. Further studies are needed to assess the impact of forest phenology in the mountain range on the nocturnal climate inland.
The LAI data sets generated in this study are available from the corresponding author on reasonable request.
This study was supported by a field research project of the Mountain Science Center in 2018–2019. The aerial photograph in Fig 1c was provided by the SRS. Meteorological observation sites were provided by Sugadaira Farm, Sania Park Sugadaira, and Versoix. Mr. R. Kanai (SRS) continuously supported the forest-tower observation, and Mr. S. Shimizu provided the statistical information about cropland occupation rate. Mr. H. Komaki (University of Tsukuba) provided advice on the identification of tree species. We would like to thank all of them for supporting this study.