Article
Long-Term Precipitation Changes in the Baiu and Akisame Seasons in Japan over the Past 120 Years (1901–2020)
2023 Volume 101 Issue 4 Pages 309-322

Details
2023 Volume 101 Issue 4 Pages 309-322
Long-term variations in precipitation during the major rainy periods in Japan—the Baiu (June–July) and Akisame (September–October) seasons—are investigated using precipitation records from 44 weather stations in western to eastern Japan over the past 120 years (1901–2020). The total amount of Baiu precipitation has increased over the 1901–2020 period, mainly during the mid–late stages of the season (late June–July) over regions on the Sea of Japan side of the country. Conversely, the precipitation amount during the Akisame season has decreased, mainly during the mid-stage (late September–early October) over all regions. The frequency and intensity of heavy precipitation have generally increased in both seasons, but the trends are much stronger for the Baiu season than for the Akisame season. A prominent positive trend, 23.5 % (100 yr)−1 (18.1 % °C−1), which is much higher than the Clausius–Clapeyron rate (approximately 7 % °C−1), is observed for the Sea of Japan side of western Japan for the seasonal maximum one-day precipitation total during the Baiu season. It may be noteworthy that the observed long-term trends differ greatly between the Baiu and Akisame seasons even though the statistical significances of the trends are not so high, because similar differences between the two rainy seasons are found in the results of global warming simulations.
There are two major rainy periods in Japan. The first one appears in early summer (typically June–July) and is called the “Baiu” season, which is identified as the period of peak precipitation and minimum sunshine duration and is especially evident in southwestern Japan (Ninomiya and Murakami 1987). The Baiu season is associated with the seasonal northward migration of the Meiyu–Baiu rainband, which extends zonally from eastern China to southern Japan and is accompanied by a frontal zone (Ninomiya and Murakami 1987; Wang and LinHo 2002). The second one is recognized in early autumn (typically September–October) and called the “Akisame” or “Shurin” season (referred to hereafter “Akisame”), which is associated with the southward migration of a frontal zone (Matsumoto 1988). Akisame precipitation is generally weaker and more intermittent than that during the Baiu season; however, the total precipitation amount is greater in eastern Japan than that during the Baiu season (Sekiguchi and Tamiya 1968; Kato 1997). Most of the annual precipitation falls during the two rainy seasons, making these seasons vital for water resource management; however, heavy precipitation events frequently occur during the rainy seasons, resulting in disasters such as floods and mudslides. Therefore, their long-term variations and changes are one of the major concerns.
From a broader perspective, the Baiu season is a phenomenon associated with the East Asian monsoon, a component of the Asian monsoon system (Wang and LinHo 2002). The Meiyu–Baiu rainband that is responsible for Baiu precipitation is maintained by moisture transport with low-level southerly monsoonal flows, driven by the zonal pressure difference between the warmer Asian continent and the relatively cooler Pacific Ocean (Kodama 1993; Kawamura and Murakami 1998; Wang and LinHo 2002). The rainband is accompanied by a quasi-stationary front that is characterized by the strong meridional gradient for moisture in the western part and temperature in the eastern part (Ninomiya and Murakami 1987; Tomita et al. 2011). The upper-level westerly jet sustains the large-scale ascending motion that triggers convection, forming the rainband (Sampe and Xie 2010; Horinouchi and Hayashi 2017).
There are distinct differences between the background conditions for the Baiu and Akisame seasons, which correspond to the mature and retreat phase of the Asian summer monsoon, respectively (Kurashima 1968). During the Akisame season, low-level northerly winds prevail over central to northern China because of cooling over the Eurasian continent. Conversely, moist low-level southerly flows exist around Japan because the western Pacific subtropical high (WPSH) remains intense owing to active convection over the western North Pacific (Matsumoto 1992; Murakami and Matsumoto 1994; Kato 1997; Chen et al. 2004; Ding 2007). Consequently, a front generally exists between these different natures of airmass, and extratropical cyclones often develop in the background of a relatively strong baroclinicity (Matsumoto 1988; Takahashi 2013). Tropical cyclones (TCs) contribute further to Akisame precipitation, directly and indirectly, through moisture transport and interaction with the upper-level westerly jet (Sekiguchi and Tamiya 1968; Chen et al. 2004; Yoshikane and Kimura 2005; Kodama and Satoh 2022).
Ongoing global warming has influenced spatial and temporal precipitation distribution. As atmospheric moisture content increases with temperature, precipitation intensity can be expected to have increased at short-time scales. In Japan, the intensity and frequency of precipitation extremes at daily and hourly scales have been increasing with statistical significance [Fujibe et al. 2006; Duan et al. 2015; Nakaegawa and Murazaki 2022; Japan Meteorological Agency (JMA) 2022]. Meanwhile, the influence of global warming on total precipitation amount over longer-time scales is not straightforward because it depends on changes in atmospheric moisture and atmospheric circulation (Xie et al. 2015). Nevertheless, the spatial pattern for changes in total precipitation on a broad scale roughly follows a “wet-gets-wetter” pattern (Held and Soden 2006) owing to the thermodynamical change. Given this rough approximation, the precipitation amount during the rainy seasons is anticipated to increase as the climate warms.
Long-term variations and trends of Baiu precipitation have been investigated using precipitation observations. Misumi (1994) found inter-decadal variations of Baiu precipitation (June–July), with a wetter period in 1924–1944 and a drier period in 1952–1972, especially in southwestern Japan. Endo (2011) analyzed precipitation records for western and eastern Japan from 1901 to 2009 and showed that precipitation over the Sea of Japan side of the country had decreased significantly in the early phase (early–mid-June) while it had increased significantly in the late phase (mid–late July) with amplification of year-to-year variability. Otani and Kato (2015) reported a recent decrease in precipitation in northwestern Kyushu in late June by comparing precipitation data for 1971–2000 with data for 2001–2010. They attributed the decline in rainfall to a reduction in heavy precipitation events (> 50 mm d−1). Zhan et al. (2016) investigated a long-term precipitation trend in East Asia from 1951 to 2009 and showed that the early-summer rainy season had generally begun earlier in China and later in Korea and Japan, and that it had ended earlier north of 35°N and ended later in the south. Kato (2022) analyzed hourly precipitation data from the Automated Meteorological Data Acquisition System (AMeDAS, which has 1178 stations in Japan) from 1976 to 2020 and showed a significant increase in the frequency of heavy rainfall events [> 130 mm (3 h)−1] during the Baiu season (June–July), especially in July. Based on precipitation estimates from satellite radar observations, Takahashi and Fujinami (2021) showed that the frequency of heavy precipitation events (> 10 mm h−1) during the Baiu season (mid-June–mid-July) increased by 24 % between 1998–2008 and 2009–2019.
In contrast to these insights into the Baiu precipitation, long-term precipitation variations during the Akisame season are poorly understood. The existing literature is limited to the studies of Oguchi and Fujibe (2012) and Duan et al. (2015), who examined precipitation data from 1901 at seasonal and regional scales in Japan. They identified decreasing trends in precipitation amount during fall (September to November), with a statistical significance at some weather stations. Therefore, it is necessary to investigate the long-term variations for the Akisame season. Comparison of the results with those in Baiu precipitation could help us further understand the characteristics of the two rainy seasons.
This study investigates long-term variations in precipitation for the Baiu and Akisame seasons, as an extension of the work by Endo (2011), by extending the analysis period to recent years and adding an analysis for extreme precipitation and for the Akisame season, and focuses on exploring similarities and differences in the long-term changes between the two rainy seasons. Seasonal variation in precipitation during the warm season in Japan is characterized by two rainy periods separated by a break spell, which are caused by the migration of the Baiu/Akisame frontal zones and development of the WPSH, in association with the seasonal evolution of the East Asian monsoon, resulting in a well-defined wet/dry cycle in the climatology (Chen et al. 2004; Ding 2007; Inoue and Matsumoto 2007). Considering the climatological feature, our analysis includes the beak spell (August), which could provide insight into the mechanism of the long-term variations.
This study analyzed precipitation data recorded continuously at 44 JMA weather stations from western to eastern Japan from 1901 to 2020. In our study, seven weather stations [Niigata (47604), Kanazawa (47605), Choshi (47648), Hiroshima (47765), Okayama (47768), Izuhara (47800), and Saga (47813)] were added to those used in Endo (2011). The analysis was based on daily and 10-day or 11-day accumulated data (e.g., 1–10 July, 11–20 July, and 21–31 July), which were compiled and digitalized by the JMA. Few precipitation records were missing for this period (e.g., Fujibe et al. 2006; Oguchi and Fujibe 2012).
In the analysis, the period from June to October was classified into three seasons: the Baiu season (June–July) and the Akisame season (September–October) as the wet spell, and the high summer season (August) as the relatively dry spell. The Baiu and Akisame seasons are further divided into three stages: the early stage, the mid-stage, and the late stage. Additionally, the mid–late stage is defined for the Baiu season by combining the mid-stage and the late stage.
The weather stations were separated into four regions based on a definition of the JMA (Japan Meteorological Agency 2021): Sea of Japan side of eastern Japan (EJ); Pacific side of eastern Japan (EP); Sea of Japan side of western Japan (WJ); and Pacific side of western Japan (WP). The total stations included in each region were 5, 16, 10, and 13 for EJ, EP, WJ, and WP, respectively. The locations and regional classifications of the weather stations are shown in Fig. 1 and Table 1. We also defined five combined regions: eastern Japan (EJEP) comprises EJ and EP; western Japan (WJWP) comprises WJ and WP; Sea of Japan side of eastern and western Japan (EJWJ) comprises EJ and WJ; Pacific side of eastern and western Japan (EPWP) comprises EP and WP; and eastern and western Japan (ALL) comprises EJ, EP, WJ, and WP. Regional mean data were calculated when more than 80 % of the station data had a quality flag of normal or quasi-normal (Japan Meteorological Agency 2021).

Location of meteorological stations used in this study. Different colors indicate different regions: Sea of Japan side of eastern Japan (EJ; light blue with triangle), Pacific side of Eastern Japan (EP; green with circle), Sea of Japan side of Western Japan (WJ; dark purple with triangle), and Pacific side of Western Japan (WP; magenta with circle). Shading indicates topography height (unit: m).

Long-term changes were evaluated in two ways. In the first way, the climatology between the first half of the 20th century (1901–1950) and the early 21st century (2001–2020) is compared. Here, according to JMA (Japan Meteorological Agency 2022), the surface-air temperature remained relatively low before the 1940s, and the warmest years have all been observed since the 1990s; thus, it would be reasonable to compare the data for the period 1901–1950 and 2001–2020 to obtain possible signals of climate change. In the second way, a linear trend for 1901–2020 is assessed using the least squares method. Statistical significance was estimated using a Student's t-test for the former and the Mann–Kendall trend test (e.g., Wilks 2011) for the latter.
Figure 2 compares the regionally averaged 10-day precipitation climatology between the first half of the 20th century (1901–1950) and the early 21st century (2001–2020) from late May to early November. The first rainy period is around June to July, corresponding to the Baiu season, which is clearly observed in western Japan (WJ and WP). In the earlier epoch, peak precipitation occurred in late June in EP, WJ, and WP, and in early July in EJ. Relative to the earlier epoch, precipitation decreases in the early stage of the Baiu season during the latter epoch, while it increases in the mid–late stages, especially for regions on the Sea of Japan side of the country (WJ and EJ). The magnitudes of the precipitation peaks are higher, and its timing shifts from late June to early July in WJ, WP, and EP compared to the earlier epoch. These suggest an intensification and seasonal delay for the Baiu precipitation.

Regionally averaged 10-day precipitation amounts (mm) during late May to early November for the first half of the 20th century (1901–1950: dashed black line) and the early 21st century (2001–2020: solid red line) in (a) WJ, (b) WP, (c) EJ, and (d) EP. Filled circles denote statistical significance at the 90 % confidence level for a two-sided test, based on the Student's t-test, considering the difference between the two periods. Numbers 1, 2, and 3 for each month along the horizontal axis denote 1st–10th, 11–20th, and 21st–30th (or 31st), respectively.
A short break in precipitation is observed around August, corresponding to the high summer season. Relative to the earlier epoch, precipitation increases in mid–late August over regions on the Sea of Japan side of the country (WJ and EJ) during the latter epoch, suggesting a shortening of the relatively dry spell.
The second rainy period occurs around September to October, corresponding to the Akisame season. In the earlier epoch (1901–1950), peak precipitation occurred in early–mid-September in WJ and in mid-September–early October in WP, EJ, and EP, indicating a significant regional difference. The magnitude of the Akisame precipitation peak was greater for the EP region than that of the Baiu precipitation in the earlier epoch. However, the Akisame precipitation peak is less clear in the recent epoch (2001–2020) over all regions, especially in WJ, and precipitation is slightly increased for the late stage relative to the earlier epoch. As a result of the recent decreasing of Akisame precipitation and the increase in precipitation during mid–late August, the second precipitation peak shift earlier in WJ and EJ.
Next, long-term changes are investigated in another way. A linear trend was calculated for 1901–2020 using the least squares method. The results are summarized in Table 2, which show the changes as mm (Table 2a) and % (100 yr)−1 (Table 2b). The results are generally consistent with the results in Fig. 2. There are negative trends for early-stage Baiu precipitation, ranging from −2.5 % century−1 in WP to −20.9 % century−1 in EJ. Conversely, positive trends are observed for the mid–late stage, especially for the Sea of Japan side (+21.5 % century−1 in EJ and +20.9 % century−1 in WJ), where the trends are statistically significant. These results in increases in the total Baiu precipitation amounts for all regions except EP, although their statistical significances are low. The magnitudes of the negative (positive) trends in the early (late) stage are smaller compared with the results in Endo (2011), which analyzed 37 weather station data for the period 1901–2009.
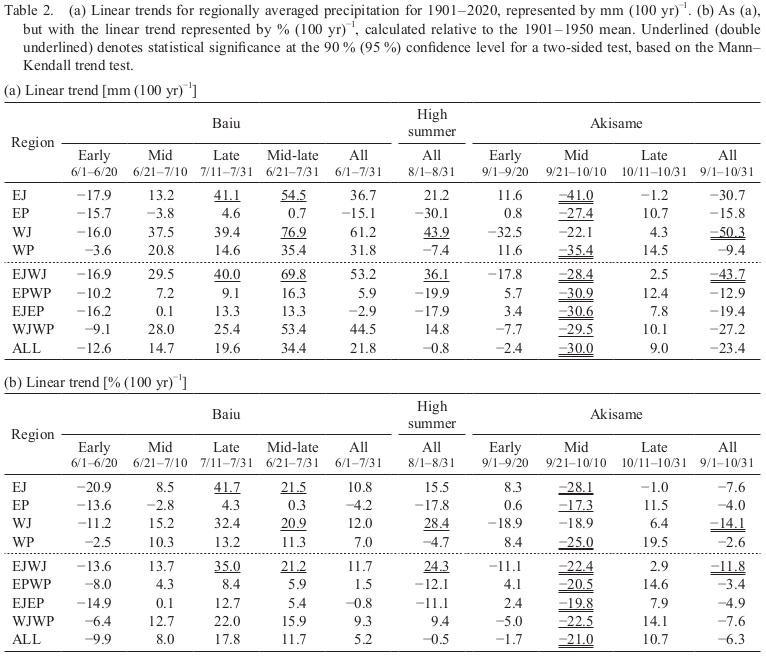
A clear contrast is noted between regions on the Sea of Japan side (+15.5 % century−1 in EJ and +28.4 % century−1 in WJ) and those on the Pacific side (−17.8 % century−1 in EP and −4.7 % century−1 in WP) of the country in the high summer season.
The precipitation amount in the Akisame season tends to decrease in all regions. In particular, statistically significant negative trends are observed for the mid-stage of the season in most regions, ranging from −17.3 % century−1 in EP to −28.1 % century−1 in EJ. There are increasing trends for the late stage, as observed in Fig. 2, although the trends are not statistically significant.
Lee et al. (2017) reviewed studies about the long-term variability of summer precipitation in Korea since the middle of the 20th century. They noted a significant increase in rainfall in August, leading to shortening of the dry spell between the first and second rainy periods (“Changma” and “second Changma”, respectively). Interestingly, this observed feature in Korea is consistent with the long-term trends for WJ and EJ in our study (Fig. 2, Table 2). Lee et al. (2017) attributed the increase in August precipitation in Korea to an enhanced interaction of landfalling TCs and the mid-latitude baroclinic environment.
This section examines long-term changes in heavy precipitation which is defined as precipitation over 100 mm per day (R100mm). Figure 3 compares the frequency of heavy precipitation between the two epochs (1901–1950 and 2001–2020). For the Baiu season, a great increase in the frequency of R100mm events exists for all the regions except EP. The most prominent increase is found for WJ, where the frequency increases significantly in early–mid July and the timing of the peak shifts from late June to early July. No significant change is observed during the high summer season except late August for WJ. As for the Akisame season, the frequency peak for WJ is less clear in the later epoch than in the earlier epoch, as is the case of precipitation amount (Fig. 2a). The changes in the R100mm frequency during the Akisame season are generally smaller than those during the Baiu season, while the frequency increases in the late stage especially for regions in the Pacific side (WP and EP).

As Fig. 2, but for the number of days with precipitation over 100 mm (R100mm).
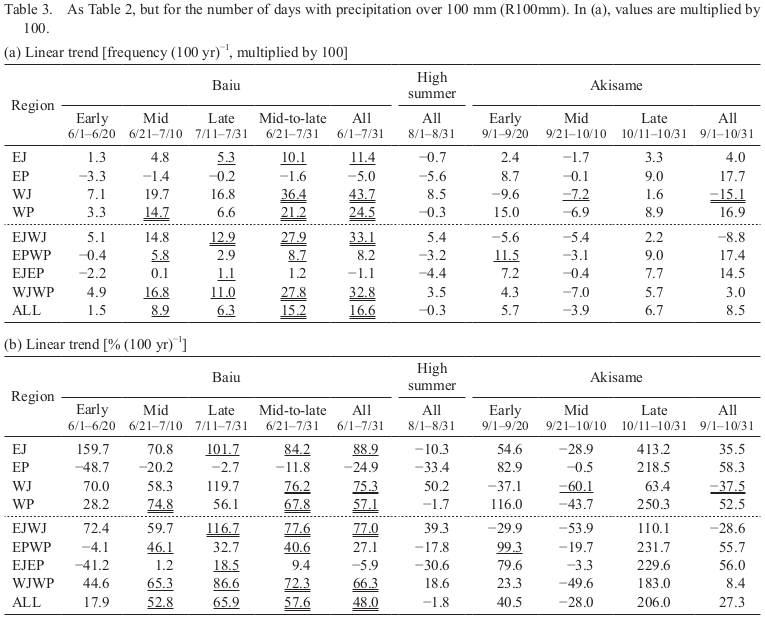
Table 3 summarizes the linear trends from 1901 to 2020. They are generally consistent with the features in Fig. 3. The R100mm frequency during the Baiu season increases in most regions with a statistical significance: +88.9 % century−1 in EJ, +75.3 % century−1 in WJ, and +57.1 % century−1 in WP, which are much larger than those for Baiu precipitation amount. Note that the trends are larger for WJ and WP than those for EJ when they are measured by changes in occurrence frequency. The increase in R100mm frequency is generally observed for all the stages of the Baiu season, especially for the mid–late stages. The exception is the EP region, where small negative trends are observed for all the stages. In the high summer and the Akisame seasons, most trends are not statistically significant, although there are large positive trends for the late stage of the Akisame season when expressed as relative percentages (Table 3b). Thus, there are large differences in the long-term trends between the Baiu and Akisame seasons for precipitation amount and frequency of heavy precipitation events.
This section focuses on the differences between the long-term changes identified for the Baiu and Akisame seasons. Table 4 summarizes regionally averaged long-term trends for surface-air temperature (SAT), precipitation amount, and the intensity and frequency of heavy precipitation. Here, in addition to the frequency of R100mm events described in the previous section, the intensity of heavy precipitation is evaluated using the seasonal maximum 1-day precipitation total (Rx1d), which is defined as the maximum 1-day precipitation total during the Baiu season (June to July) or the Akisame season (September to October) for each year. The long-term SAT trends were calculated using data from selected weather stations to avoid the effects of urbanization, following JMA (Japan Meteorological Society 2022), as shown in Table 1. Two stations, Miyazaki (47830) and Iida (47637), were relocated in May 2000 and May 2002, respectively. The temperature data from these stations were corrected to eliminate the influence of the relocation using the method in Ohno et al. (2011), following JMA (Japan Meteorological Society 2022).

The long-term SAT trends show significant increases for both seasons for all regions, with a slightly larger increase in the Akisame season (Table 4). Meanwhile, the long-term trends for precipitation amount in the Baiu and Akisame seasons are opposing, with large regional differences. For example, the trend for ALL is +5.2 % century−1 (+4.2 % °C−1) for the Baiu season, but it is −6.3 % century−1 (−4.3 % °C−1) for the Akisame season. The seasonal contrast is the most prominent for WJ, where the trend is +12.0 % century−1 (+9.2 % °C−1) for the Baiu season and −14.1 % century−1 (−9.6 % °C−1) for the Akisame season. Negative trends prevail for EP for both seasons, but the statistical significances of these are low.
Rx1d and R100mm frequency have increased overall for both seasons, but the increase rates are much higher for the Baiu season than those for the Akisame season. For example, the trend for Rx1d for ALL is +10.4 % century−1 (+8.4 % °C−1) for the Baiu season, while it is +6.4 % century−1 (+4.4 % °C−1) for the Akisame season. The former rate is close to the increase expected from the Clausius–Clapeyron (C–C) relationship (approximately +7 % °C−1). There are substantial regional variations, including in the high rates for Rx1d: +23.5 % century−1 (+18.1 % °C−1) for WJ and +13.2 % century−1 (+12.7 % °C−1) for EJ during the Baiu season, and +15.5 % century−1 (+12.0 % °C−1) in EP during the Akisame season. These increase rates greatly exceed the C–C rate, suggesting some dynamic enhancement.
Figure 4 shows the geographical distribution of the long-term trends in precipitation amount and Rx1d for the Baiu, high summer, and Akisame seasons. The spatial patterns for the Baiu and high summer seasons are similar: there are increasing trends on the Sea of Japan side as well as in western Japan, while decreasing trends on the Pacific side of eastern Japan. This pattern may be caused by an enhancement of southwesterly moisture flows associated with the East Asian monsoon and its interaction with topography. TC activity may also contribute to the pattern for the high summer season, as noted in Section 3. However, the spatial pattern for the Akisame season is markedly different from those of the previous two seasons, suggesting that different mechanisms may be important. This matter will be discussed in Section 6. It is also noted that the patterns for precipitation amount and Rx1d are dissimilar in the Akisame season, which may indicate different contributions from TC activity.

Geographical distribution of the linear trend [% (100 yr)−1] of (upper panels) precipitation amount and (lower panels) Rx1d for 1901–2020 during (a, b) the Baiu season (June–July), (c, d) the high summer season (August), and (e, f) the Akisame season (September–October). The size of each mark reflects the magnitude of the trend. The red (blue) circles indicate increasing (decreasing) trends, and the cross (minus) indicates absolute values of less than 5 % (100 yr)−1 with an increasing (decreasing) trend. Shading indicates topography height (unit: m). The percentage trend is presented relative to the 1901–1950 mean.
Figures 5–7 show the time series for regional-average precipitation amounts, Rx1d, and R100mm frequency during the Baiu and Akisame seasons. These all vary on different time scales, from years to decades, with a long-term trend. The time series for precipitation amount shows that the variations differ between the Baiu and Akisame seasons (Fig. 5). For the Baiu season, there are decadal-scale variations, especially in WJ and WP, including relatively small values around the 1920s–1940s and large values around the 1950s–1970s, as also found by Misumi (1994). Precipitation amount in the Akisame season has gradually decreased, and its year-to-year variability has increased, resulting in a more frequent occurrence of small precipitation years in the recent decades.
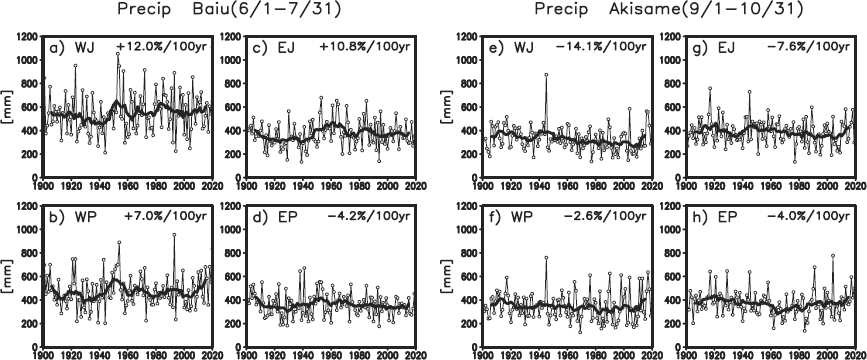
Time series for regionally averaged precipitation during (a–d) the Baiu season (June to July) and (e–h) the Akisame season (September to October) for 1901–2020. (a, e) WJ, (b, f) WP, (c, g) EJ, and (d, h) EP. Thick lines indicate the 11-year running mean. The percentage trend is presented relative to the 1901–1950 mean.

As Fig. 5, but for the seasonal maximum 1-day precipitation total (Rx1d).
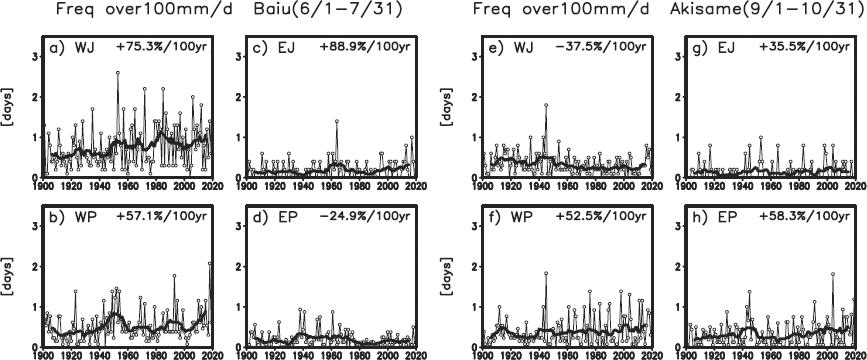
As Fig. 5, but for the number of days with precipitation over 100 mm (R100mm).
The time series for Rx1d (Fig. 6) and R100mm frequency (Fig. 7) also show seasonal and regional differences. The interannual variability for the Akisame season tends to be greater than that for the Baiu season, i.e., the annual standard deviations of Rx1d normalized by its means for the period 1901–2020 are 0.31, 0.32, 0.30, and 0.35 (0.28, 0.28, 0.27, and 0.25) and those of R100mm are 1.72, 0.99, 0.84, and 0.97 (1.34, 1.07, 0.73, and 0.74) for the Akisame season (Baiu season) for EJ, EP, WJ, and WP, respectively. This is possibly because there is more effect of TC activity during the Akisame season (e.g., Lee et al. 2019). There is an interdecadal shift in the magnitude of the interannual variability for the Akisame season, including considerably more variability in WJ during the first half of the 20th century and in WP and EP during recent decades relative to other periods.
We investigated long-term variations in precipitation during the major rainy periods in Japan (the Baiu and Akisame seasons) from 1901 to 2020, using precipitation records from 44 weather stations in western to eastern Japan. Positive trends exist for the total amount of Baiu precipitation over the past 120 years, mainly during the mid–late stages of the season (late June–July) over regions on the Sea of Japan side of the country. A clear contrast is noted between regions on the Sea of Japan side (increase) and those on the Pacific side (decrease) in the following high summer season. Meanwhile, we found that the precipitation amount during the Akisame season has decreased, mainly during the mid-stage (late September–early October) over all regions. Rx1d and R100mm frequency have increased overall for both the Baiu and Akisame seasons, but the increase rates are much higher for the Baiu season than those for the Akisame season. In particular, a prominent positive trend, +23.5 % century−1 (+18.1 % °C−1), which is much higher than the rate expected from the C–C relationship (approximately 7 % °C−1), is observed in WJ for Rx1d during the Baiu season.
This study followed the work of Endo (2011) by extending the analysis period to recent years and adding an analysis for extreme precipitation and for the Akisame season. We have found distinct differences in the long-term trends between the Baiu and Akisame seasons, although the statistical significances of the trends are not so high. In considering possible mechanisms to explain these differences, it is important to recognize that the two rainy periods occur in different background situations. Baiu precipitation occurs during the mature stage of the Asian summer monsoon; thus, its main environmental forcings are moisture transport by southerly flows, driven by the thermal contrast between the Asian continent and the Pacific Ocean, and the upper-level westerly jet that induces adiabatic upward motion (Sampe and Xie 2010). Meanwhile, Akisame precipitation occurs during the retreat stage of the Asian summer monsoon; thus, monsoonal flows are relatively weak. Instead, moisture is supplied mainly from southerly flows along the periphery of the WPSH and from flows induced by TCs. Interactions between these moisture flows and the mid-latitude baroclinic environment, as well as storm track activity, are thought to be responsible for Akisame precipitation (Chen et al. 2004; Yoshikane and Kimura 2005; Lee et al. 2017; Kodama and Satoh 2022). Heavy precipitation in the Akisame season is thought to be strongly influenced by TC activity (Sekiguchi and Tamiya 1968). These differences in environmental factors may be a key to understand the distinct differences in the observed trends. This matter should be pursued in further studies.
Discussing whether these observed trends are influenced by human-induced global warming would be meaningful. Further studies using climate model simulations for the 20th century, such as the Detection and Attribution Model Intercomparison Project (DAMIP; Gillett et al. 2016), would be necessary to answer this question. Here, we would compare our results with future global warming simulations because these are currently more accessible. Future projections with a high-resolution atmospheric general circulation model (Mizuta et al. 2012) indicate that global warming will intensify the Baiu rainband, with its slight southward shift relative to its current position during early summer (Kusunoki 2018; Endo et al. 2021). The model simulations also project little change in precipitation around Japan during early autumn [Fig. 4 of Endo et al. (2021)] and contrasting precipitation changes between the Sea of Japan and the Pacific sides of the country in August (Ose 2019). Opposing responses of the upper-level westerly jet in early summer and the following seasons are thought to be the keys to the seasonality of the precipitation changes (Endo et al. 2021). The intensity of precipitation extremes in East Asia is projected to be stronger in a warmer climate (Kusunoki and Mizuta 2013; Endo et al. 2022). It is notable that the features from the observation records are similar to the simulated future changes in many aspects. This suggests that global warming induced by greenhouse gas (GHG) forcing may influence the observed changes. Underlying mechanisms should be further explored. However, anthropogenic aerosol forcing, the impact of which is generally opposite to that of the GHG forcing, is known to significantly influenced the East Asian summer monsoon in the latter half of the 20th century (Song et al. 2014; Zhou et al. 2020). Estimating the relative importance of the GHG and aerosol forcings to the observed trends should be addressed in future studies.
The observation data analyzed in this study are available from JMA's web page: https://www.data.jma.gojp/obd/stats/etrn/index.php (in Japanese).
The author would like to thank Prof. J. Matsumoto of Tokyo Metropolitan University for his valuable comments on this study, including the members of the Climate Prediction Division of JMA for providing correction data for eliminating the influence of the relocation of the weather stations. The author also acknowledges the editor and two anonymous reviewers for their constructive comments. This work was supported by JSPS KAKENHI (Grant JP21K13154 and JP22H00037) and the Environment Research and Technology Development Fund (Grant JPMEERF 20222002) of the Environmental Restoration and Conservation Agency, Ministry of Environment of Japan.