1. Introduction
Observation data from satellite-borne instruments provide homogeneous atmospheric information over a wide area that cannot be covered by conventional observations, significantly improving the accuracy of numerical weather predictions (NWPs). Recent advances in remote sensing technology have improved the quality of satellite observations, resulting in the procurement of enormous amounts of high-resolution data. In particular, the advent of the hyperspectral infrared sounder (HSS) has drastically improved spectral resolution and allowed acquisition of detailed vertical structures of the atmosphere. Observation data from HSSs, such as the cross-track infrared sounder and infrared atmospheric sounding interferometer, implemented on low-earth-orbiting (LEO) satellites are widely used at operational NWP centers globally, resulting in high impacts on NWP improvement (Menzel et al. 2018).
Geostationary satellites can perform high-frequency measurements over a wide fixed area, whereas LEO satellites can only observe a specific location twice a day. Many geostationary satellites, including the geostationary operational environmental satellite (GOES; Schmit et al. 2017), Meteosat (Schmetz et al. 2002), and Himawari (Bessho et al. 2016), have been equipped with imagers operated at high horizontal and temporal resolutions due to significant advances in instrument performance. They provide helpful information on atmospheric phenomena that cause severe weather events involving localized and rapid atmospheric changes. Furthermore, the HSS on a geostationary satellite (GeoHSS) should provide detailed information on the temporal evolution of the atmosphere's three-dimensional structure and is expected to significantly improve the prediction accuracy of high-impact weather events. In the World Meteorological Organization (WMO) Integrated Global Observing System's (WIGOS's) vision in 2040 (World Meteorological Organization 2020), GeoHSS is one of the high-priority instruments to be installed on geostationary satellites; it plays a vital role in the construction of the global atmospheric observation network. With this background, the geostationary interferometric infrared sounder (GIIRS) was installed on the Chinese geostationary satellite FY-4A launched in 2016 (Yang et al. 2017). The plan has materialized in Europe, and thus, the infrared sounder (IRS) is going to be installed on the Meteosat Third Generation (MTG) satellite (Holmlund et al. 2021); in addition, GeoHSS has been considered for installation on the geostationary extended observations satellite in the United States (Adkins et al. 2021; Lauer et al. 2021). The Japan Meteorological Agency (JMA) also aims to start the operation of the next geostationary satellite around 2029 after Himawari-8 and Himawari-9, currently in operation, and GeoHSS is a promising candidate to be an onboard instrument (Bessho et al. 2021).
As GeoHSS is to be installed on geostationary satellites, several impact evaluations in NWPs have been performed using observing system simulation experiments (OSSEs), with the results indicating the expected data assimilation (DA) impact of this high frequency, widely distributed, and high-resolution three-dimensional observational data (Guedj et al. 2014; Jones et al. 2017; Li et al. 2018; Wang et al. 2021a). A recent DA experiment using actual data from GIIRS with a global four-dimensional variational (4D-Var) system in an intensive typhoon event reported improved forecast accuracy (Yin et al. 2021).
Okamoto et al. (2020) explored the expected impact of the GeoHSS located over Japan on NWPs via OSSE using an integrated global and regional NWP system for the next operational geostationary satellite to replace Himawari-8 and Himawari-9. In their experiment, the reanalysis (RA)-based OSSE (RA-OSSE) technique was applied using the fifth generation of the European Centre for Medium-Range Weather Forecasts RA (ERA5; Hersbach et al. 2020) data as the pseudo-truth atmospheric profile. The OSSE results indicated that the GeoHSS improved representative weather field and typhoon track prediction in the global NWP system, whereas it improved heavy rainfall event prediction in the regional NWP system.
This study extends to the evaluation of the impact of the GeoHSS on the regional NWP system. In this work, we increased the number of events to understand the more general and robust characteristics of the impact of the GeoHSS, focusing on torrential rainfall events in Japan. A 1-week DA cycle was conducted over three rainy seasons to understand the impacts, including the benefits obtained through cycling. To isolate the effect of GeoHSS, we investigated the following events, in which the mechanism of the phenomenon has been well analyzed in the literature.
In the study by Okamoto et al. (2020), the regional DA used the temperature (T) and relative humidity (RH) vertical profiles from ERA5 as pseudo-observational data, regarded as representative atmospheric information obtained from the GeoHSS. However, although the pseudo-observations include the analysis error of ERA5, this method might overestimate the accuracy and information of the GeoHSS observations compared with the actual available data. A more realistic approach to consider a variety of observation error sources was necessary.
There are primarily two methods for the actual data use in DA: one is to directly assimilate the brightness temperature (BT) measured by the GeoHSS, and the other is to assimilate retrievals (such as T and RH) diagnosed from the BT. The DA of HSS BT has not been introduced into the operational regional DA of JMA, and its practical use, including handling bias correction, requires significant effort (Okamoto et al. 2020)1. Thus, we chose to assimilate retrievals in this study, adopting an approach similar to those of Jones et al. (2017), Li et al. (2018), and Wang et al. (2021a). We first derived BT from the ERA5 vertical profile using the radiative transfer for TOVS (RTTOV; Saunders et al. 2018) and applied the 1D-Var retrieval system (Hayashi et al. 2021a, b; Oyama et al. 2019) considering the spectral characteristics of the GeoHSS on the BT to obtain T and RH retrievals. The retrievals were the pseudo-observations of GeoHSS for the OSSE.
Section 2 describes the experiments conducted in this study. Section 3 discusses the impact of the GeoHSS using the RA-OSSE technique for three periods, including heavy rainfall events during the Baiu seasons in 2017, 2018, and 2020. Section 4 provides a summary of the study.
2. Method
2.1 RA-OSSE
In this study, similar to that by Okamoto et al. (2020), we conducted an RA-OSSE using ERA5 as the pseudo-true atmospheric profile, which has high accuracy and should be highly independent of the JMA system used in the experiment. In the conventional OSSE, a nature run is first created as the true state. Then, pseudo-observations are simulated from the nature run for all existing observations and those to be evaluated. However, RA-OSSE uses actual data for the existing observations and generates pseudoobservation data only for the unacquired GeoHSS to be evaluated. Therefore, actual observations can verify RA-OSSE, enabling direct discussion of the impact on the prediction of severe weather events, such as torrential rains. However, we needed to select events where the prediction initiated with ERA5 is more accurate than that with the JMA analysis, so that the impact of the pseudo-observations can be noticeable. Similar approaches based on the RA-OSSE were also used in the studies by Wang et al. (2021a) and Wang et al. (2021b).
The OSSE in this study used an experimental system based on the former mesoscale analysis (MA; Japan Meteorological Agency 2019), which was in operation until March 2020, applying the JMA non-hydrostatic model-based variational DA (Honda et al. 2005). This system runs a three-hourly 4D-Var DA cycle with a 3-h assimilation window on a 4080 × 3300-km domain covering Japan and its surroundings. The 4D-Var uses the incremental approach, optimizing the increments at a horizontal grid spacing of 15 km with 38 vertical layers while generating the first guess and analysis at a horizontal grid spacing of 5 km with 48 vertical layers, both with the model top at ~ 22 km. Various conventional observations as well as satellite and ground-based remote sensing data, which are the same with the data used in MA (Japan Meteorological Agency 2019), are assimilated in addition to the pseudo-observations of the GeoHSS to generate the initial condition for 39-h forecasts at a horizontal grid spacing of 5 km on the same domain using the operational nonhydrostatic model of the JMA, ASUCA, as the forecast model (Ishida et al. 2022).
2.2 GeoHSS pseudo-observations
The T and RH GeoHSS pseudo-observation data are generated as 1D-Var retrievals (Hayashi et al. 2021a, b; Oyama et al. 2019) from ERA5. The ERA5 data are provided at a horizontal grid spacing of ~ 31 km, with 137 vertical layers, a model top of ~ 0.01 hPa, and a 1-h time interval. In the 1D-Var, the all-sky BT calculated from ERA5 is used as the observation data. RTTOV v12 (Saunders et al. 2018) is used to simulate the BT from temperature, specific humidity, cloud fraction, specific cloud ice and liquid water content, ozone mass mixing ratio, 10-m horizontal wind components, 2-m temperature, skin temperature, and surface pressure obtained from ERA5. The position of the geostationary satellite is the same as that of Himawari-8 and Himawari-9 (140.7°E). The spectral characteristics are the same as those of the IRS to be installed on MTG as specified in RTTOV v12, which measures 1738 channels in the long- and mid-wave infrared bands at a spectral resolution of 0.625 cm−1, including temperature (700–742 cm−1) and water vapor (1660–1984 cm−1) channels, similar to that shown by Okamoto et al. (2020).
In 1D-Var processing, the channels are prioritized according to Rodgers (1998) to maximize the information content, and 100 channels are chosen considering the information content and computational cost. However, clouds affect the channels, and the channels are rejected when the difference between the BTs with and without cloud scattering calculations exceeds 1 K (Okamoto et al. 2020). As discussed by Okamoto et al. (2020), this cloud detection scheme cannot be applied in an actual situation as the BT without cloud scattering is unknown. Thus, this scheme assumes that the estimation of cloud effect becomes available with high accuracy.
The observation error in 1D-Var are ~ 0.3 K and 1 K for temperature and water vapor channels, respectively, based on the observation-minus-background statistics in clear-sky areas without correlation between channels.
To increase the independence between the 1D-Var pseudo-observations and the first guess of the OSSE mesoscale DA, forecasts from the global spectral model (GSM; Japan Meteorological Agency 2019) of the JMA are used as the first guess of the 1D-Var. The GSM has 100 model layers, a model top of 0.01 hPa, and a horizontal grid spacing of ~ 20 km. The background error covariance is based on GSM prediction statistics. RTTOV v12 (Saunders et al. 2018) runs in the observation operator to estimate clear-sky BT from temperature and specific humidity in 1D-Var.
In DA, the T and RH pseudo-observations are rejected when the diagonal part of the 1D-Var averaging kernel, which describes how the retrieval changes with respect to changes in the true atmospheric state (Maddy et al. 2009), for the pseudo-observation is smaller than 0.03. This indicates that these T and RH pseudo-observations are derived using only few BT pseudo-observation channels in the 1D-Var, for example, in the presence of clouds. The observation error used in DA is based on the standard deviation statistics of the retrieval pseudo-observations from ERA5 and varies from 0.5 K to 1.3 K for T (Fig. 1 black-filled circles) and from 10 % to 15 % for RH (Fig. 1 gray-filled circles).
2.3 Processing of pseudo-observations in DA
In DA, pseudo-observations are horizontally thinned to ~ 45 km, as is done for the radiance observations of Himawari-8 in the operational system. In the vertical direction, the pseudo-observations are used at the model layer of the GSM nearest to each of the 13 altitudes (1000, 920, 850, 700, 500, 400, 300, 250, 200, 150, 100, 70, and 50 hPa) for T and the seven altitudes up to 300 hPa for RH. In the time direction, pseudoobservations are assimilated on an hourly basis. As done in the study by Okamoto et al. (2020), we applied quality control (QC) on the pseudo-observations as that of the conventional observations in MA (Japan Meteorological Agency 2019; Onogi 1998).
The pseudo-observations are not explicitly perturbed, considering that they include ERA5 analysis errors and representation errors due to differences between ERA5 and the DA system of the JMA. However, this might overestimate observation accuracy, as discussed in the research conducted by Okamoto et al. (2020) and Wang et al. (2021a), with Okamoto et al. (2020) noting that a trial with perturbed pseudo-observations resulted in smaller but positive impacts. Future work should evaluate these impacts by carefully estimating the GeoHSS observation error, including measurement errors.
2.4 Experimental scenarios
The following experiments were conducted in this work.
-
• CNT: no pseudo-observation assimilation
-
• 1DVar: assimilation of the 1D-Var retrieval pseudoobservations
Similar to the approach adopted by
Okamoto et al. (2020), an experimental system was used in this study to generate the lateral boundary conditions (LBCs) based on the operational global DA system of the JMA as of 2018 (
Japan Meteorological Agency 2019). The following two global experiments were conducted in this study:
-
• global CNT: generating LBCs for CNT. No pseudoobservation was assimilated.
-
• global BT: generating LBCs for 1DVar. This global experiment assimilated hourly BT GeoHSS pseudoobservations simulated from ERA5 using RTTOV v12 (Okamoto et al. 2020).
3. OSSE results
This section focuses on the three aforementioned periods (Section 1) and investigates the impact of GeoHSS on them.
3.1 Heavy rainfall event of July 2018
This section investigates the event of July 2018, in which heavy rainfall occurred over a wide area, primarily in western Japan. Tokyo Climate Center (2018), the JMA (Japan Meteorological Agency 2018a), and Tsuguti et al. (2019) conducted detailed analyses of the meteorological conditions at the time of this event (the JMA surface weather chart for this period is available at the JMA website, https://www.data.jma.go.jp/fcd/yoho/data/hibiten/2018/1807.pdf). A DA cycle was run from 0000 UTC July 1 to 2100 UTC July 7, 2018, to study the impact of the GeoHSS pseudoobservations on the forecast.
a. Distribution of pseudo-observation data
There were only few pseudo-observations above 200 hPa (Fig. 2a black bars) as few channels were sensitive to these altitudes. In this study, the lower limit of the wavenumber observed by the GeoHSS was 700 cm−1 for the creation of BT observations for 1D-Var based on the spectral characteristics of the IRSs as described in Section 2.2. If the spectral band could be extended to the lower-wavenumber side, it should enhance the sensitivity at the upper levels. The 1D-Var retrieval pseudo-observations increased from 200 hPa to 300 hPa as the number of sensitive channels increased.

Below 300 hPa, the QC-passed data decreased at the lower levels as the area under clouds increased. Specifically, the clouds were widely distributed from southeastern China to the East China Sea, where the convection is active, and around Honshu, primarily in western Japan, where the Baiu front is stagnant; these areas have few pseudo-observations (Fig. 2b). However, areas with pseudo-observations occur even at the lower levels from northeast China to the Yellow Sea, around Primorsky Krai and Hokkaido, and over the ocean far southeast of Japan (Fig. 2c).
Below 850 hPa, the use of channels sensitive to water vapor decreased, and the number of RH 1D-Var retrieval pseudo-observations was small (gray bars in Fig. 2a). It is critical to develop a method for effectively extracting information on water vapor at the lower levels as this might significantly affect severe weather events.
Taking into account the GeoHSS spectral characteristics and retrieving process, the number of the 1D-Var pseudo-observations was smaller than that of the vertical profile ones in the study by Okamoto et al. (2020) above 200 hPa for T and below 850 hPa for RH. However, for 250–500 hPa, the cloud detection assumed in the 1D-Var pseudo-observations allowed more data than that assumed in the vertical profile ones, which excluded all data below the level with an ERA5 cloud fraction exceeding 0.03 in each vertical column (Okamoto et al. 2020).
b. Difference from ERA5
The ERA5 data time series was a consistent time evolution of the meteorological field that provided the GeoHSS pseudo-observations. We used ERA5 as a reference and compared the deviation of 1DVar from the reference with CNT. This would help us understand the distribution characteristics of the atmospheric information added by the GeoHSS and the extent to which the impact of the added information persists. The deviation from ERA5 was evaluated using the root-mean-square difference (RMSD).
Figure 3 presents the difference between the deviation of 1DVar and CNT for RH at 500 hPa. 1DVar decreased the deviation across the domain at the initial forecast time (FT; Fig. 3a) due to the assimilation of pseudo-observations. However, the distribution was nonuniform. A significant decrease in RMSD occurred over areas corresponding well to where the pseudoobservation data were assimilated (Fig. 2b for T). The impact extended along the atmospheric flow through the DA cycle to areas where there were few pseudoobservations due to the clouds, which was noticeable from the east coast of China to the northern East China Sea.
As the FT progressed, the effect of the GeoHSS gradually decreased. However, this effect persisted over a wide range even at an FT of 21 h (hereafter denoted as FT = 21; Fig. 3b). It is unlikely that the pseudo-observation data directly affected precipitation areas with clouds. This suggests that their impact reached these areas primarily through time evolution.
c. Verification against radiosonde observations
In terms of verification against radiosonde T observations, 1DVar (Fig. 4a) exhibited persistent improvement from the CNT, especially at the upper levels (200–300 hPa) of the atmosphere. Furthermore, 1DVar significantly decreased the root-mean-square error (RMSE) over the middle (400–500 hPa) levels at short forecast ranges. The impact tended to weaken as the FT progressed, but significant improvements were still observed beyond FT = 24 at the upper and lower levels. The decrease in RH RMSE was centered around 300 hPa in 1DVar (Fig. 4b), although the impact was smaller than that on T (Fig. 4a). At FT = 0, the increase in RH RMSE was statistically significant at 1000, 300, and 250 hPa. The reason for the degradation was unclear, although a decrease in the number of RH 1D-Var pseudo-observations at the lower and upper levels might have contributed to it. The degradation was not noticeable in the July 2017 and July 2020 statistics (not shown), indicating that this result was not necessarily robust. As discussed in Section 3.1a, the number of RH 1D-Var retrieval pseudo-observations decreased at the lower levels. Correspondingly, the impact of the 1D-Var pseudo-observations on T RMSE (Fig. 4a) was smaller than that of the vertical profile pseudo-observations as in the study by Okamoto et al. (2020), particularly at the lower levels at shorter FTs (not shown).

The impact of the GeoHSS extended to wind components that were not directly assimilated as the pseudoobservations, indicating that the improvements in T and RH were propagated through the DA cycle and forecast. A significant improvement in U and V occurred at the upper levels (200–300 hPa; Figs. 4c, d). Figure 5a presents the substantial improvement rate of 1DVar from CNT from northeastern China through the Korean Peninsula reaching to the northern coast of western Japan (solid black ellipse) in U at 250 hPa, where 1DVar exhibited a sustained improvement (Fig. 4c). The mean wind field during the experiment (Fig. 5b) corresponded to the jet stream path (solid black ellipse), indicating that the regional and global GeoHSS assimilations improved the large-scale structure of the upper-level wind field, including LBC.

Persistent improvement in V was observed for 1DVar (Fig. 4d) at the lower levels (700–925 hPa). The spatial distribution at 850 hPa for 1DVar exhibited improvements (Fig. 5c solid black rectangles) corresponding to the flow over northeastern China influenced by a mountain range, the flow from the South China Sea into the East China Sea, and the flow from the limb of the Pacific High toward the southern coast of Japan (Fig. 5d solid black rectangles). Specifically, the latter two flows can influence heavy rainfall in western Japan, which is the focus of this study.
Thus, in this study, the overall accuracy of the meteorological field was improved by adding the ERA5 information to the JMA system, indicating that it is appropriate to use ERA5 as the pseudo-true atmospheric profile for the RA-OSSE. Okamoto et al. (2020) observed the same improvement as in this study by assimilating GeoHSS pseudo-observations from the verification using only forecasts initiated at 0000 UTC July 2–7, 2018 (six forecasts). Compared with the verification in the study by Okamoto et al. (2020), the verification in this study using a larger number of statistical samples showed significant improvements for RH and upper-level wind components in addition to T over a broader range. An additional experiment without the regional assimilation of pseudo-observations but with the use of LBCs from the global BT exhibited the same trend of improvement.
d. Verification of precipitation forecast
(1) Statistical verification
The impact also extended to the precipitation forecast, reflecting the improved meteorological field shown in the radiosonde verification. Verification of the precipitation accumulated over 3 h against the analyzed radar/rain gauge precipitation indicated that the threat score (TS; Fig. 6a) for 1DVar (red) was higher than that for CNT (blue) at all thresholds (black), with significance at most thresholds. The bias score (BI; Fig. 6b) also tended to approach 1 at many thresholds, mitigating excess precipitation in CNT.
The experiment without the regional assimilation of pseudo-observations showed a similar improvement compared with 1DVar as observed in the verification against radiosonde observations (not shown). The verification of Okamoto et al. (2020) with six forecasts also showed the impact of GeoHSS pseudo-observations similar to this study.
(2) Time evolution of verification score
The improvement from CNT in the TS and BI of 1DVar (Figs. 7a, b) was primarily distributed at longer FTs (solid black ellipses). The assimilation of GeoHSS pseudo-observations increased the forecast lead time. As presented in Fig. 3, the impact from distant clear-sky locations propagates through the DA cycle and forecast, spreading to the surrounding area and reaching the precipitation area, which may have improved precipitation at longer FTs. A sensitivity experiment demonstrated that reducing the pseudo-observation frequency from 1 to 3 h degraded the TS in the longer FTs (not shown), indicating that the repeated pseudoobservation assimilation at a high frequency of 1 h enhanced the propagation of information from the pseudo-observations without dissipation in the DA cycle and forecast.
e. Prediction of heavy rainfall in the Chugoku region
In this experimental period, the TS of 1DVar showed that forecasts have a long lead time, particularly at lower thresholds, persisting throughout the DA cycle (Fig. 8a), indicating that the forcing of convection from a large-scale environment is vital in precipitation. During this period, the Baiu front stalled near the main island of Japan, resulting in heavy rainfall over a wide area, particularly in western Japan. The observation (Fig. 9a) of the precipitation accumulated over 3 h at 2100 UTC July 6, 2018 (Fig. 8a solid white rectangle) indicated that the rainfall intensified in the Chugoku region (Fig. 9a solid black ellipse). In this section, the forecast initiated at 0000 UTC July 6 (Fig. 8a solid yellow rectangle) was investigated near FT = 21 (light blue arrow), where high TS persisted at the threshold of 30 mm (3 h)−1 in 1DVar.

The intense rainfall in Chugoku is not predicted in the 21-h forecast from CNT (Fig. 9c). However, 1DVar (Fig. 9b) exhibited an improvement compared with CNT, intensifying precipitation over the Chugoku region, although the peak location was shifted to the north. The experiment without the regional assimilation of pseudo-observations also showed intense rainfall over the Chugoku region, although the intense precipitation area was slightly smaller, and the peak was shifted to the northeast (not shown) compared with the observation (Fig. 9a).
1DVar predicted that a low-pressure area passed through the northern part of Kyushu and reached the western part of the Seto Inland Sea near Hiroshima at FT = 18 (Fig. 10b solid black ellipse), which was not predicted by CNT (FT = 18). The short-range forecast from CNT (FT = 3) initiated at 1500 UTC July 6 (Fig. 10a) showed an overall increase in pressure but also gave the low-pressure area over the western Seto Inland Sea (solid black ellipse), indicating the reliability of the low-pressure area in 1DVar (FT = 18). This low-pressure area could enhance the precipitation over the Chugoku region (Fig. 9b).

The JMA surface weather chart (available at the same JMA website as mentioned in Section 3.1) at 0000 UTC 7 July 2018 indicated that a surface pressure trough extended to the southwest along the front from a low-pressure system located at the eastern Sea of Japan. This trough reached the Chugoku region where the front curved in a smoothed kink shape. The JMA global analysis at 925 hPa at 1800 UTC 6 July 2018 (e.g., Fig. A2.2 of Tokyo Climate Center 2018) revealed cyclonic circulation around the Chugoku region. These indicated that the localized low-pressure area can intensify the lower-level moist air flow into the Chugoku region from the southeast. Shimpo et al. (2019) also pointed out the important contribution of the meso-scale low-pressure system on the Baiu front that enhanced moisture inflow from the south to the torrential rainfall over the Chugoku region.
Contrarily, the CNT (FT = 18) predicted a low-pressure system over the central East China Sea (Figs. 10a, b white arrows), whereas 1DVar weakened it (Fig. 10b). The short-range forecast of CNT (FT = 3) did not show a corresponding low-pressure system (Fig. 10a), indicating that its CNT (FT = 18) forecast reliability was low.
Considering the difference in the water vapor flux at 850 hPa between 1DVar and CNT, 1DVar at FT = 18 enhanced the flux from the southwest near Hiroshima (Fig. 10c black arrow) and that entered western Japan from the ocean southeast of Kyushu (Fig. 10c solid black ellipse). These correspond to the passage of the low-pressure area described above, enhancing the precipitation in 1DVar.
These phenomena associated with the small low-pressure area over the Baiu front occurred in the lower-level cloud areas, where GeoHSS pseudo-observation data were not assimilated, indicating the impact propagation discussed in Section 3.1d (2).
3.2 The July 2017 northern Kyushu heavy rainfall event
This section presents the results of the application of the OSSE on the event of torrential rain in northern Kyushu in July 2017. MRI (Meteorological Research Institute 2017), JMA (Japan Meteorological Agency 2018b), and Kawano and Kawamura (2020) present detailed analyses of the atmospheric condition during this heavy rainfall event (the JMA surface weather chart for this period is available at the JMA website, https://www.data.jma.go.jp/fcd/yoho/data/hibiten/2017/1707.pdf).
The DA cycle was run from 0000 UTC July 1 to 2100 UTC July 7, 2017. The TS of 1DVar during this period (Fig. 8b) was lower than that in July 2018 (Fig. 8a). Furthermore, the forecast accuracy varied depending on the events, and the persistence of high TS over DA cycles and FTs was short. This period included events in which the precipitation phenomena were not determined only by forcing from large-scale environments and contributions from localized environments were crucial. We investigated the impact of the GeoHSS pseudo-observations, focusing on its dependence on the scale of precipitation forcing.
a. Statistical verification
Verification against radiosonde observations showed a similar overall decrease in RMSE for 1DVar as observed in July 2018 (Fig. 4) but with a more widespread improvement in July 2017 (not shown). As for precipitation, 1DVar outperformed CNT in TS at all thresholds (Fig. 11a). The improvement was primarily at longer FTs (not shown), as observed in July 2018 (Fig. 7a). However, as shown by the solid red rectangles in Fig. 8b, the high TS persisted for thresholds above 10 mm (3 h)−1 after FT = 24 mostly in the event of Typhoon Nanmadol (Fig. 8b light blue rectangle), which crossed western Japan and then moved off the Tokai coast on July 4. Thus, this event primarily contributed to the forecast characteristics over this range. BI was above 1 in July 2018 (Fig. 6b), whereas it was below 1 in July 2017 (Fig. 11b), indicating an overall underestimation of precipitation. 1DVar slightly mitigated the underestimation of CNT at many thresholds (Fig. 11b). The improvement was primarily at longer FTs as in TS (not shown).

1DVar showed improvement from CNT in the 30-h forecast (Fig. 8b light blue arrows) of precipitation due to the Baiu front, affected by the approach of Typhoon Nanmadol at 0600 UTC July 4 (Fig. 12a solid black ellipse) discussed in Section 3.2a. In 1DVar, the 500-hPa trough (not shown) deepened over the Sea of Japan and accelerated its eastward propagation compared with CNT, extending the low-pressure area northeast of the typhoon (Fig. 12d solid black ellipse). As a result, compared with CNT (Fig. 12b), the 1DVar forecast (Fig. 12c) enhanced precipitation over land in Hokuriku, whereas it weakened the precipitation band extending from northern Niigata to the Noto Peninsula, consistent with the observation (Fig. 12a). The impact was more noticeable than in an experiment using the vertical profile pseudo-observations (Okamoto et al. 2020), which had less data at ~ 500 hPa as discussed in Section 3.1a, suggesting that it is important to effectively use data at upper cloud altitudes (not shown).

In this case, the forecast lead time of precipitation was significantly limited, particularly at higher thresholds (Fig. 8b solid white rectangles), indicating that the forcing from large-scale environments alone was not necessarily associated with the precipitation phenomena. Figure 13 presents the two shortest-range forecasts (FT = 3, 6; Fig. 8b dashed yellow rectangle) of the precipitation accumulated over 3 h from 1DVar and CNT valid at 0600 UTC July 5, 2017, the time of torrential rainfall in northern Kyushu. The observation (Fig. 13a) showed intense rain concentrated in a small area near Asakura. The spatial scale of the intense precipitation area was small, indicating that detailed topographic effects contribute to precipitation concentration and persistence (Takemi 2018; Meteorological Research Institute 2017; Kawano and Kawamura 2020).
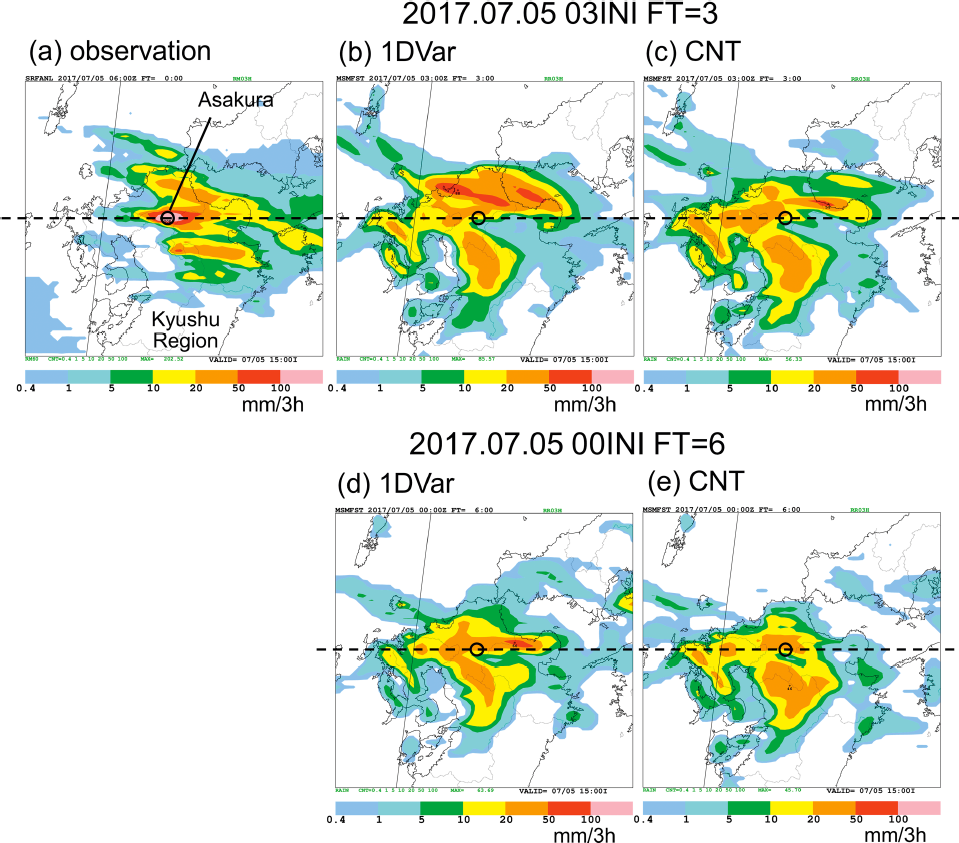
Both 1DVar and CNT (Figs. 13b–e) predicted the precipitation intensification over northern Kyushu consistent with the observation. However, the precipitation concentration area was displaced from the observation, and its peak intensity was weak in all forecasts. Furthermore, the forecast variation was large, depending on the initial times. As the small-scale precipitation areas and topography could only be simulated by fine grid spacing, the NWP model with a 5-km grid spacing used in this study had difficulty in predicting the concentration and long duration of this localized precipitation.
During this heavy rainfall event, the atmospheric environment was characterized by strong cold air at the upper level, forming persistent strong stratiform instability (Meteorological Research Institute 2017; Japan Meteorological Agency 2018b). The analysis (FT = 0) of 400 hPa T for CNT (Fig. 14c) revealed that a cold airmass of ~−18 °C approached the northern Kyushu region (solid black ellipse). Longer-range forecasts gave weaker cold air, with delayed eastward propagation. However, 1DVar (Fig. 14a) strengthened the predicted cold air from a longer range than CNT (Fig. 14b), bringing it closer to the analysis (Fig. 14c).

MRI (Meteorological Research Institute 2017) and JMA (Japan Meteorological Agency 2018b) highlighted that the warm moisture flowed from the southwest at the lower levels toward Kyushu, which is another vital factor for this heavy rainfall event. In water vapor flux at 950 hPa, the analysis (FT = 0) of CNT (Fig. 14f) showed warm moisture flow from the southwest toward northern Kyushu (solid black ellipse). Longer-range forecasts gave weaker warm moisture flow concentrations and intensity. On the other hand, 1DVar (Fig. 14d) strengthened the warm moisture flow compared with CNT (Fig. 14e) around FT = 12–18 and brought longer-range forecasts closer to the analysis (solid black ellipses).
For this case study, the assimilation of GeoHSS pseudo-observations improved large-scale environments, such as the upper-level cold air and low-level water vapor flux, extending the forecast lead times. However, the localized heavy rainfall was insufficiently reproduced only with the assimilation of the GeoHSS pseudo-observations, probably due to the limited resolution of the OSSE in this study.
3.3 July 2020 heavy rainfall event
This section applies the OSSE to the period of heavy rainfall in Kyushu in July 2020 (Tokyo Climate Center 2020; Hirockawa et al. 2020; Araki et al. 2021). The DA cycle was run for 0000 UTC June 30–2100 UTC July 7, 2020. In this period, the TS and its persistence (Fig. 8c) were between those in July 2018 (Fig. 8a) and July 2017 (Fig. 8b). Two terms of high TS persisted for several days (Fig. 8c solid black ellipses), corresponding to when the Baiu front covered a wide area of Japan and stagnated (the JMA surface weather chart for this period is available at the JMA website, https://www.data.jma.go.jp/fcd/yoho/data/hibiten/2020/2007.pdf).
In the verification against radiosonde observations for this period (not shown), 1DVar improved from CNT, as observed in July 2018 and July 2017. 1DVar also outperformed CNT overall in the verification of precipitation forecasts (not shown), and the improvement primarily distributed at longer FTs, as observed in July 2018 and July 2017.
Figure 15 presents 6–12-h forecasts (yellow rectangle in Fig. 8c) of 3-h accumulated precipitation valid at 0000 UTC July 4, 2020 (Fig. 8c light blue rectangle). A precipitation band extended from the central Kyushu region to the Shikoku region, and a precipitation concentration area was observed in the Kumamoto Prefecture (left panels in Fig. 15). In CNT (Fig. 15b), the precipitation band and concentration area were displaced to the north. 1DVar (Fig. 15a) mitigated the northward shift in CNT and predicted a precipitation area closer to the observation, which was consistent further up to the forecast of FT = 21 (not shown). A similar impact persisted over successive forecast updates, indicating the impact propagation through the DA cycle.

A closer examination of the forecast (not shown) indicated that 1DVar weakened a small low-pressure system moving eastward over the Baiu front passing through northern Kyushu compared with CNT. Consequently, the low-level warm moisture flow near the low toward the north from the southwest of the precipitation area weakened. Thus, the convergence line of the low-level wind, which was formed between the flow due to the low and the flow of warm moisture from the southwest, shifted to the south. Araki et al. (2021) pointed out that this convergence line was an important factor for the heavy rainfall in Kumamoto. This effect might have shifted the precipitation band and concentration locations to the south in 1DVar (Fig. 15a) compared with CNT (Fig. 15b).
The event without regional assimilation of pseudoobservations also improved the precipitation location (not shown) compared with CNT. However, the forecast varied, depending on the initial values, and 1DVar exhibited better consistency with the observation.
In another event of precipitation forecast with a long lead time (solid white rectangle in Fig. 8c), an improvement of 1DVar from CNT was observed in the Kyushu and Chugoku regions around 1800 UTC July 6, 2020, which was also related to a small low over the Baiu front and may be due to its accelerated eastward propagation near the Tsushima Strait.
4. Summary
This study investigated the impact of the GeoHSS in a regional NWP system for the period of heavy rainfall events during the Baiu season in 2017, 2018, and 2020. The RA-OSSE technique was employed using ERA5 as the pseudo-true atmospheric profile.
OSSE was conducted using pseudo-observations from 1D-Var retrieval as a realistic impact evaluation. The pseudo-observation considered the measurement process of BT, the amount of atmospheric information due to the spectral band of the GeoHSS and selection of channels used (including maximizing information content and rejecting cloud-affected channels), and the retrieval process.
Compared with the vertical profile pseudo-observations presented by Okamoto et al. (2020), the number of 1D-Var retrieval pseudo-observations herein was smaller at and above 200 hPa for T and below 850 hPa for RH due to the limited number of sensitive channels based on the IRS spectral characteristics and limited capability of 1D-Var processing. However, the number of 1D-Var retrieval pseudo-observations increased for the 250–500-hPa range with a wider coverage due to the difference in handling cloud-affected data.
The verification against radiosonde observations showed an improvement in T and RH over several altitudes and FTs. The wind components, not directly assimilated as pseudo-observations, were also impacted through the DA cycle and forecast. In the verification of precipitation forecasts, the impact was stronger at longer FTs, extending the forecast lead time.
The impact was also confirmed in several heavy rainfall events. The assimilation of pseudo-observations with a wide coverage had an impact at relatively long FTs (up to ~ 30 h), indicating the improvement of several atmospheric fields through the DA cycle. Many improvements were associated with lows over the Baiu front due to improvement in large-scale environments, including the low-level warm moisture flow and upper-level trough. There were events with similar impacts that continued for a series of forecasts in the DA cycle update. However, there was one event wherein small-scale phenomena, such as localized precipitation concentration and its persistence, were insufficiently predicted even at short forecast ranges, in experiments with or without pseudo-observations.
In the radiosonde verification, a decrease in the accuracy of the experiment using 1D-Var pseudo-observations from the experiment using the vertical profile ones in the study by Okamoto et al. (2020) was observed at shorter FTs at the lower levels, where the RH pseudo-observations of 1D-Var decreased. It is critical to develop an effective method for extracting information from the lower atmosphere in retrieval and DA processes. Regarding the upper-level environments, the impact on the 500-hPa trough in the July 2017 typhoon event was larger for the 1D-Var pseudo-observations than for the vertical profile ones, where the cloud detection assumed in the 1D-Var pseudo-observations allowed more data at ~ 500 hPa. Effective use of the GeoHSS data in cloud areas should become a critical issue.
In this study, we assumed the assimilation of GeoHSS data as 1D-Var retrievals. Further enhancement of the retrieval algorithm and direct assimilation of BT are possible. The impact that can be achieved by GeoHSS assimilation depends on how effectively the atmospheric information can be extracted. This study focused on the Baiu season, during which the Baiu front is stagnant and GeoHSS observations are unlikely to be assimilated around the precipitation area, particularly at the middle and lower levels. Thus, the impact was primarily through the DA cycle and forecast. In the event where no clouds occur upstream of the precipitation area, a smaller scale and more direct impact on precipitation can be obtained. In this study, the ERA5 resolution (~ 31 km) and thinning spacing of the pseudo-observations (~ 45 km) are coarse compared with the expected resolution of a real GeoHSS measurement (~ 4 km), which limits the evaluation of the direct impact from these highresolution data. However, the inner-model resolution of the 4D-Var was limited (~ 15 km) in this study, which required thinning data accounting for the correlation of the representation errors (Janjić et al. 2018). An impact that takes advantage of these data can be obtained by using a high-resolution DA and forecast system that properly handles correlated observation errors. Research on these issues is a future task.


