Abstract
To determine the complex refractive indices of aerosol particles in the atmospheric boundary layer, simultaneous measurements of scattering coefficients at 450, 550, and 700 nm wavelengths, absorption coefficient at 565 nm, and aerosol particle number size distributions were performed during a voyage of the icebreaker Shirase from Tokyo to the offing of the Philippines over the northwestern Pacific in November 2010. Three sets of Ångström exponents were calculated using the three observed scattering coefficients. Using the observed number size distributions, three sets of Ångström exponents were reproduced by assuming their complex refractive indices. Appropriate complex refractive indices for aerosol particles in the atmospheric boundary layer can be obtained when the difference between the observed and reproduced Ångström exponents is minimal. Absorbing substances were assumed to be present in the fine particles. For polluted air masses, if the refractive index for aerosol particles was uniform regardless of the particle size, the estimated Ångström exponents were consistent with the observed values. The refractive index must be the normal dispersion, which increases with a decrease in wavelength. For pristine air masses, the refractive index was estimated to be higher for coarse particles than for fine particles. This could be explained by preferential condensation of organic compounds onto coarse particles, which is observed to alter the number size distribution over Chichi-jima of the Ogasawara Islands in the northwestern Pacific in August 2014 and February 2015. This study is the first to report that the increase in the refractive index of coarse particles is likely caused by the optical properties of volatile organic compounds and/or secondary organic aerosols condensed on coarse particles.
1. Introduction
New aerosol particles are generally formed by the nucleation of aerosol particles with diameter D < 0.01 µm (Kulmala et al. 2004). Number size distributions in the Aitken (0.01 < D < 0.1 µm) and accumulation (0.1 < D < 1 µm) modes change when vapor compounds condense onto pre-existing aerosol particles or evaporate from the particles to the gas phase, and when particles coagulate (Heintzenberg et al. 2003; Kulmala et al. 2004; O'Dowd et al. 2010; Dall'Osto et al. 2012). The chemical composition of coarse particles (D > 1 µm) generally differs from that of fine particles (D < 1 µm) (Hinds 1999; Heintzenberg et al. 2003). Matsumoto et al. (1998) investigated the seasonal characteristics of the chemical composition of aerosol particles on Haha-jima (26°38′N, 140°10′E) of the Ogasawara Islands in the northwestern Pacific and determined that sea salt and non-sea salt sulfates (nss–SO42−) were the primary chemical species in coarse and fine particles, respectively. This is supported by the results of other studies (Campuzano-Jost et al. 2003; Heintzenberg et al. 2003).
Dimethylsulfide (DMS) is produced by marine phytoplankton and emitted from the ocean to the atmosphere. Its oxidation products in the atmosphere are then converted to sulfuric acid (H2SO4), making DMS the most important precursor of nss–SO42− in aerosol particles over the ocean (Savoie and Prospero 1982; Bates et al. 1992; Koga and Tanaka 1999; Read et al. 2008; Mahajan et al. 2015). However, the observed H2SO4 mixing ratios are insufficient for binary nucleation of H2SO4 and H2O (Weber et al. 1999). Using binary and ternary (H2O–H2SO4–NH3) nucleation theories, Pirjola et al. (2000) analyzed the possibility of particle formation in the atmospheric boundary layer and found that the formation of new particles is difficult under typical atmospheric conditions. Hence, they proposed the existence of condensable species other than H2SO4.
Novakov and Penner (1993) found that natural organic compounds exist in aerosol particles with 0.05 < D < 0.2 µm. In addition, O'Dowd et al. (2004) suggested that the organic fraction of the mass concentration of fine particles over the North Atlantic Ocean is related to biological activity. Oxidation products of volatile organic compounds (VOC) emitted by phytoplankton (e.g., biogenic amines, isoprene, and monoterpenes) can form secondary organic aerosols (SOA) (Facchini et al. 2008; Gantt et al. 2009; Shaw et al. 2010; Bikkina et al. 2014). The enrichment of water-soluble organic carbon (WSOC) in aerosol particles can be explained by the production and condensation of SOA in pristine air masses (Ceburnis et al. 2008; Miyazaki et al. 2010; Decesari et al. 2011). The presence of WSOC probably affects the optical properties of aerosol particles.
Atmospheric aerosol particles scatter and absorb incident sunlight (IPCC 2013). The optical properties of aerosols are expressed as the scattering coefficient σscat and absorption coefficient σabs (Seinfeld and Pandis 1998; Hinds 1999). Single-scattering albedo (SSA), defined as the ratio of σscat to σext (σscat + σabs), is an important factor in determining warming or cooling in the atmosphere-surface system (Srivastava et al. 2020). Incident sunlight is scattered mainly by sulfates (SO42−) in aerosol particles (Shiobara et al. 2007; Ohta et al. 2013). Aerosols, including elemental carbon and soil, absorb sunlight (IPCC 2013). Elemental carbon is emitted from anthropogenic sources into the atmosphere (Bond and Bergstrom 2006; Bond et al. 2013). The scattering and absorption coefficients of individual aerosol particles are associated with the complex refractive index m (n, k) = n − ki of the chemical composition of the aerosol particle. The real part, n, of m (n, k), represents the phase velocity of the electromagnetic wave propagating through the medium. The imaginary part, k, represents the attenuation rate of the amplitude of the propagating electromagnetic wave. The optical properties of aerosol particles are determined by their size-dependent chemical composition and number size distribution. The value of m (n, k) depends not only on the medium but also on the wavelength of the electromagnetic wave (Bohren and Huffman 1998).
Koga (2021) reported aerosol optical properties in the atmospheric boundary layer over the northwestern Pacific and Southern Ocean during the 52nd Japanese Antarctic Research Expedition (JARE52) voyage from November 11, 2010, to March 17, 2011. The present study focuses on the m (n, k) of aerosol particles in polluted and pristine air masses over the northwestern Pacific. The purpose of this study is to estimate the m (n, k) of aerosol particles in two types of air masses using observed aerosol scattering and absorption coefficients and number size distributions. This study also reports that the estimated high n value of the coarse particles in pristine air masses is likely caused by the optical properties of SOA condensed on coarse particles.
Results reinforcing this idea were obtained from observations of aerosol number size distributions using an activated carbon fiber on Chichi-jima (27°04′N, 142°13′E) of the Ogasawara Islands in the northwestern Pacific in 2014 and 2015. These observations were designed to elucidate why aerosol number size distributions differ between polluted and pristine air masses. When condensable species are added to the atmosphere, the formation of new particles and change in number concentration occur mainly in the fine particle range. However, the results of observations on Chichi-jima suggest that some volatile substances condense onto coarse particles in pristine air masses.
The estimation of the m (n, k) of aerosol particles during the JARE52 voyage and the observations on Chichi-jima provide some insight into the optical properties of the coarse particles.
2. Observations
To be able to determine the appropriate m (n, k) for aerosol particles, the present study used the optical properties and number size distributions obtained during the JARE52 voyage. To elucidate the difference in the number size distribution between polluted and pristine air masses, observations were conducted on Chichi-jima. Details of these observations are described below.
2.1 Northwestern Pacific
Figure 1 shows the JARE52 voyage track of the icebreaker Shirase from Tokyo, Japan (35°39′N, 139°46′E) to the Philippines (12°14′N, 129°16′E) in November 2010. Solid curves represent backward trajectories for the preceding 3 d of air parcels at a 500 m altitude. Open circles on the track indicate the vessel positions every 6 h. These trajectories were computed using the hybrid single-particle Lagrangian integrated trajectory (HYSPLIT) model (Stein et al. 2015; Rolph et al. 2017) based on the vertical velocity data fields from the NCEP/NCAR reanalysis data.
The aerosol scattering coefficients (
 , m−1) were measured by a 3563-model integrating nephelometer at three wavelengths: 450, 550, and 700 nm (3563-IN, TSI Inc. Shoreview, MN). The
measurements were repeated at intervals of 1 min during the voyage. The aerosol absorption coefficients (σ PSAP, m−1) were measured at intervals of 1 min using a particle soot absorption photometer (PSAP; Radiance Research, Seattle, WA).
, m−1) were measured by a 3563-model integrating nephelometer at three wavelengths: 450, 550, and 700 nm (3563-IN, TSI Inc. Shoreview, MN). The
measurements were repeated at intervals of 1 min during the voyage. The aerosol absorption coefficients (σ PSAP, m−1) were measured at intervals of 1 min using a particle soot absorption photometer (PSAP; Radiance Research, Seattle, WA).
The 3563-IN and PSAP methods have errors due to the measurement principle. Correction factors (Cλ) are linear functions of Ångström exponents (AE) calculated using uncorrected
values of two specific wavelengths (Anderson and Ogren 1998). In the present study, the Cλ values, which were within the ranges estimated by Anderson and Ogren (1998), were applied to obtain the corrected
 values for the uncorrected
values (Table 1). Using the
of two wavelengths, for example, a value of AE between 450 nm and 550 nm is defined as:
values for the uncorrected
values (Table 1). Using the
of two wavelengths, for example, a value of AE between 450 nm and 550 nm is defined as:

In the PSAP, scattering compounds on the filter could lead to the overestimation of the absorption co-efficients. To volatilize the scattering compounds, the sample air was maintained at 300 °C. The airflow rate measured using the built-in pump and in the sample spot area has uncertainties (Bond et al. 1999). The correction factors for these uncertainties were applied to obtain corrected σa values for the σ PSAP values, which led to the decrease of approximately 9.7 % of the σ psap values (Koga 2021). The wavelength of 565 nm of light emitted from an LED in the PSAP was different from the wavelength of 550 nm emitted from a quartz-halogen lamp in the 3563-IN. However, the difference between σts550 and σts565 was negligible. Thus, the values of σts550 and σa were immediately used to determine SSA. The measurements and correction methods for
and σa are reported in Koga (2021).
The number size distributions of aerosol particles with D > 0.3 µm were measured using an optical particle counter (OPC, KC–01D, RION Co., LTD). The light source of the OPC is a semiconductor laser that emits light at a wavelength of 780 nm. Measurements were repeated every 1 min and categorized into five classes: D > 0.3 µm, D > 0.5 µm, D > 1 µm, D > 2 µm, and D > 5 µm. The OPC was calibrated by the manufacturer using polystyrene latex (PSL) particles with m (1.595, 0). The coefficients of variation (σ/x, that is, sample standard deviation/arithmetic mean) were calculated using a 15-min moving average in the number concentrations of D > 0.3 µm. When the coefficients of variation were > 0.25 at a certain time, the values of all classes at that time were excluded.
Figure 2 displays the
, σa, and AE from Tokyo to the offing of the Philippines, which corresponds to part of the latitudinal distributions of aerosol optical properties from Tokyo to Fremantle (32°03'S, 115°45′E) in Australia, as shown in Koga (2021). The backward trajectories suggest that the air masses from 35.5°N to 28.1°N contained anthropogenic pollution from East Asia. Meanwhile, from 25.3°N to 12.2°N were pristine air masses from the central North Pacific unaffected by anthropogenic pollution (Fig. 1). Figure 3 shows the time series of number size distributions in four classes reported by the OPC from 30.5°N and 137.5°E to the offing of the Philippines. Relatively stable values were found from 30.5°N to 29.5°N in the polluted air masses, and from 17.5°N to 16.0°N and 14.5°N to 13.5°N in the pristine air masses. The complex refractive indices of aerosol particles were estimated for these latitudinal ranges.

Figure 4 shows the number size distributions averaged from 30.5°N to 29.5°N and from 17.5°N to 16.0°N. The averages and one standard deviation of σλ,
, σa, and SSA for three latitudinal ranges are listed in Table 1. The standard deviation values of SSA were calculated using the law of propagation of errors. The AE values were calculated from the averages of
. The r values are correlation coefficients between σts450 and σts550, σts450 and σts700, and σts550 and σts700.
2.2 Chichi-jima of the Ogasawara Islands
Chichi-jima is located approximately 1000 km south of Tokyo, Japan and is an ideal site for monitoring both polluted air masses from East Asia during winter and pristine air masses from the central North Pacific during summer (Koga et al. 2008), which correspond to the first and second types during the JARE52 voyage, respectively (Koga 2021). The island is located downwind of polluted air masses and upwind of pristine air masses relative to the JARE52 voyage track.
Observations were conducted at the Ogasawara downrange station (27°04′N, 142°13'E, 230 m above the sea level) of the Japan Aerospace Exploration Agency. The number size distribution with D > 0.3 µm was measured using an optical particle sizer (OPS, Model3330, TSI Inc., Shoreview, MN). Measurements were repeated every 1 min. To remove aerosol particles with D > 10 µm, a PM10 impactor was attached to an air inlet port with a 4.25 cm inside diameter on the wall of a facility for switchboard equipment. A stainless steel sampling probe was inserted into the inlet pipe and aligned parallel to the gas streamlines made with an air pump. Aerosol sampling was done isokinetically. The inside diameter of the sampling probe was 1.47 cm at the upper end, decreasing gradually to a minimum of approximately 0.64 cm (1/4 inch) at a 7 cm distance.
The amount of VOCs condensed onto aerosols can be evaluated from the difference in the number size distributions between VOC-removed and untreated air samples. Kynol (novoloid)-based activated carbon fabric (ACC507-20, Gunei Chemical Industry Co., Ltd., Gunma, Japan) was inserted into a 50 cm stainless steel tube with an outside diameter of 1.27 cm (1/2 inch). The inside diameter of this tube was approximately 0.64 cm (1/4 inch) because Kynol fabric was placed along the inner wall. The inside diameter was the same as the fit diameter of the conductive tubing for the piping to avoid steps in the flow path. Kynol fabric can adsorb non-polar substances such as organic compounds (nominal toluene adsorption, 30–80 w%) but it cannot or poorly adsorbs polar substances such as water vapor (Sullivan et al. 2007). Kynol fabrics are superior to granular activated charcoal in terms of adsorption rate and amount. The stainless steel tube with the Kynol fabric was connected to the upper stream of the OPS to remove VOCs from the air samples.
In August 2014, two OPSs were simultaneously used to measure number size distributions, but the Kynol tube was connected to only one of these. The flow splitter (Model 3708, TSI Inc.) was used to divide air samples into two flow paths. After the measurement started, the values obtained by the two OPSs became almost identical within 2 h because Kynol fabrics were saturated with VOCs. Judging from this result, particle loss by the Kynol tube is negligible. The saturated Kynol was regenerated as a result of VOC desorption by heating the tube for 30 min at 100 °C with an airflow rate of 20 L min−1. In February 2015, only one OPS was available, and therefore measurements were taken alternately by connecting and disconnecting the Kynol tube.
Figure 5 shows the number and surface area size distributions in the pristine air masses in summer and polluted air masses in winter, obtained using the OPS. The dew point temperatures in the ambient atmosphere were 27 °C on August 22, 2014, and 12 °C on February 18, 2015. The inlet temperature recorded by the OPS, 38 °C in August and 33 °C in February, was consistently higher than the dew point temperature. The relative humidity inside the OPS was estimated to be 54 % in August and 29 % in February. The number size distributions were obtained under dry conditions.

The distinct maxima of the number concentrations were always approximately 2–3 µm in diameter during summer. When the Kynol tube was used, the number concentrations of coarse particles always showed a sharp decrease from the original concentrations. In contrast, the number concentrations in winter decreased with increasing diameter, with an inflection point of approximately 1–2 µm in diameter. The number size distributions, however, hardly changed despite the use of a Kynol tube.
3. Methods
Three sets of AE were calculated using the three observed
. Using the observed number size distributions, the values of
, σa, and AE were reproduced by assuming complex refractive indices. The procedure for reproducing the values of
and σa is shown below. Appropriate complex refractive indices for aerosol particles in the atmospheric boundary layer can be obtained when the sum of the three sets of differences between the observed and reproduced AE is minimal.
3.1 Refractive index correction of the particle sizing in the OPC
The particle sizing diameters are based on the threshold voltage from the photodetector receiving light scattered by the PSL particles. In the ambient atmosphere, m (n, k) for aerosol particles is different from that for PSL particles. The particle sizing diameters must be corrected according to the values of m (n, k) to obtain realistic values for the number size distributions.
The photodetector in the OPC was placed at an angle ψ of 70° to the irradiated optical axis. The scattered light was focused by the collecting aperture with a semi-angle β of 27°. The angular distribution of light scattered by a single particle with diameter D was calculated from 43° (θ = ψ − β) to 97° (θ = ψ + β) at intervals of 1° using the geometry of the collecting aperture by Hodkinson and Greenfield (1965). The range of particle diameters covered by the calculation was from 0.05 µm to 25 um, dividing into 1000 increments on a logarithmic scale. For each particle diameter, the total intensity of light received by the photodetector was calculated as the sum of the scattered light intensity per 1° from 43° to 97°. The same procedure was repeated for n from 1.30 to 1.70 in increments of 0.01. As a result, the particle sizing diameters of the 41 sets were obtained as a function of n at a wavelength of 780 nm from the laser light in the OPC.
3.2 Expansion of number size distribution
For the size range between log D and log D + d log D, the number size distribution n (log D) can be expressed by a power-law function of size as follows:
where N is the number concentration, D is the particle diameter, c is a proportionality constant, a factor that determines the number concentration, and b is the slope of the number size distribution on a log–log plot.
The values from N4 to N8 in Fig. 6 averaged from 30.5°N to 29.5°N in the polluted air masses and were originally obtained using the OPC. The boundaries from D4 to D8 corresponded to the original boundaries for m (1.595, 0) of the PSL particles. The values of Ni represent the number concentration at the midpoint between Di and Di+1. Equation (2) is available between Di and Di+1, where bi and ci are defined in the same diameter range.
The observed number size distribution from D4 to D8 alone was insufficient to reproduce
and σa. Therefore, for particles with D < D4, the widths from D1 to D2, D2 to D3, and D3 to D4 were assumed to be the same as the width l from D4 to D5. To obtain the upper limit D9, the width L from D7 to D8 was applied to that from D8 to D9. The slope of the red line between N2 at D3 and N4 was assumed to be the same as that between N4 and N5. The N1 value was the same as the N3 value.
All Ni were multiplied by an adjustable factor df to reproduce the same values as the observed σts550 and σa values. This probably corresponded to the correction for the uncertainty in the airflow rate of the internal pump of the OPC. The values from N4 to N8 in Fig. 6 are original values from the OPC in the case of df = 1. The value of df had no effect on the value of AE. The N3 value at the midpoint between D3 and D4 was further multiplied by an adjustable factor sf to obtain AE values consistent with the observed values because the AE values depend on the slope of the number size distribution.
The values of N1 and N2 were automatically determined using this operation. For example, in the cases of sf = 1.0 and 0.3, the number size distributions are shown by the red and blue lines in Fig. 6, respectively. Henceforth, the number size distribution consisting of black and blue solid lines will be referred to as a column model. The values of Di were obtained as the particle sizing corrected by m (n, 0). The k values were determined such that the estimated σa values were consistent with the observed σa values.
To confirm the reliability of m (n, k) estimated using the column model, the
and σa values were reproduced using the regression curves fitted to the column model. The regression curves can be described as the sum of two log-normal distributions (Jaenicke 1993; Seinfeld and Pandis 1998):
where Nj is the number concentration, σj is the standard deviation of the lognormal distribution, and Dj is the mean diameter. Henceforth, the number size distribution consisting of the regression curves will be referred to as a log-normal model.
Clarke et al. (2004) and Koga et al. (2008) reported that most of black carbon was present in fine particles with D < 1 µm. Therefore, the light-absorbing component was only present in the fine particles with D < the corrected D6 (Fig. 6) in the column model and in the first log-normal distribution (j = 1 in Eq. 3) in the log-normal model.
3.3 Estimations of
, σa, and m (n, k)
The scattering coefficient
in the particle size range of Mie scattering can be expressed by a power-law function of the wavelength (Seinfeld and Pandis 1998):
where
(m,x) is the scattering efficiency of a particle with m (n, k), x is the size parameter defined by the ratio of the particle diameter D to the wavelength of light (λ), n (log D) is the number size distribution, and AE was calculated from Eq. (1). A similar expression can be written for σa in terms of the absorption efficiency, Qa (m, x), of the particle with m (n, k). The values of n (log D) can be obtained from Eqs. (2) or (3).
The values of
(m, x) at the three wavelengths, 450, 550, and 700 nm, and Qa (m, x) at a wavelength of 550 nm were calculated for each particle diameter divided into 1000 increments from 0.05 µm to 25 µm on a logarithmic scale. The values of n range from 1.30 to 1.70 in increments of 0.01. Q terms were computed from Mie theory using MieCalc software by Bernhard Michel.
The values of AE observed by 3563-IN were expressed as the oAE1 between 450 nm and 550 nm, oAE2 between 450 nm and 700 nm, and oAE3 between 550 nm and 700 nm. The values of AE from
estimated using Eq. (4) were expressed as eAE1 between 450 nm and 550 nm, eAE2 between 450 nm and 700 nm, and eAE3 between 550 nm and 700 nm, respectively. In the estimations of eAEi, the values of k were assumed to be constant regardless of the wavelength of light. The appropriate m (n, k) for aerosol particles can be obtained when the following Eq. (5) is minimized:
4. Results
4.1 Complex refractive indices of aerosol particles in polluted air masses
The
values observed at each wavelength from 30.5°N to 29.5°N were reproduced using the corrected number size distribution of the column model. Here, k = 0 in the calculation of
using Eqs. (2) and (4) was assumed to simplify the determination of an appropriate n value. Values of p are shown as a function of m (n, 0) in Fig. 7. The horizontal axis is the n value at a wavelength of 450 nm.
The three observed
values had very good correlations one another (Table 1). The estimated changes of
due to a difference of 0.01 in the n value were approximately equal to standard errors derived from the observed
values. The errors in the appropriate n values estimated below would be less than ± 0.01.
Figure 7a shows the p values when the n value is constant, independent of the wavelength of light. Even for the same material, the n value generally depends on the wavelength of light and increases with decreasing wavelength. The p values for this case are shown in Fig. 7b. The mutual difference in n values among the three wavelengths was assumed to be 0.01 due to the normal dispersion. Figure 7c shows the p values when the n value at 450 nm is 0.01 higher than that at 550 nm and 700 nm. The case of anomalous dispersion, in which n values decrease with decreasing wavelength, is shown in Fig. 7d. The n values at 450 nm were assumed to be 0.02 lower than at 700 nm. In all cases, the n values were assumed to be uniform from D1 to the midpoint between D8 and D9 (Fig. 6). The minimum p value is shown in Fig. 7d.
The effect of the light-absorbing component was not considered to reproduce the
values at each wavelength. In the number size distribution under sf = 0.475, with the particle sizing of m (1.56, 0) in Fig. 7b, the p value was 2.84 × 10³ in the assumption of the normal dispersion. If the k value was uniform for particles with D < D6 = 1.17 µm, as corrected by m (1.56, 0.0168) (Table 2), the
and σa values estimated at sf = 0.475 and df = 0.603 were approximately equal to the observed values (Tables 1, 3). The p value in the case of the normal dispersion was minimal at 3.34 × 10⁻³, compared with the other cases with k–value assumptions in Figs. 7a, 7c, and 7d.

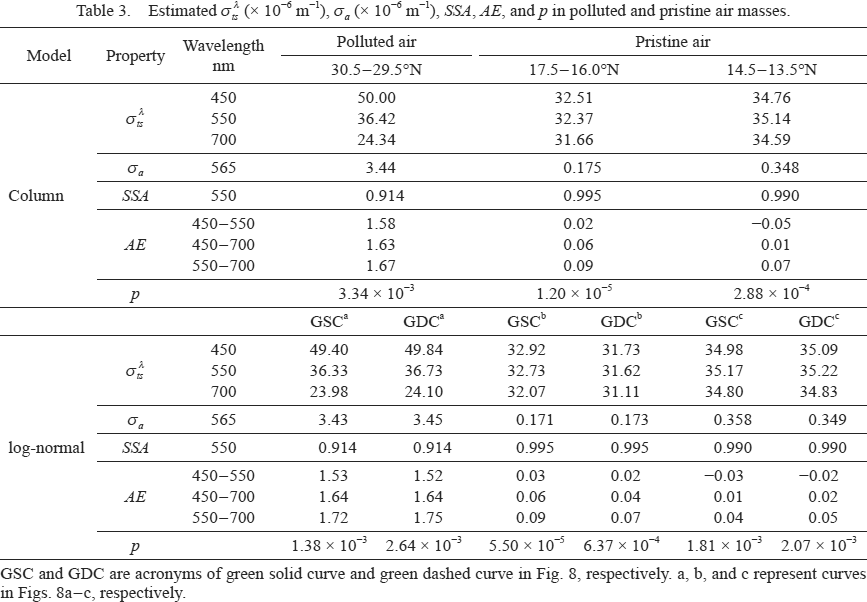
The column model in Fig. 8a consists of black solid and dashed lines under sf = 0.475 with particle sizing for m (1.55, 0). The green solid and dashed curves are the regression curves obtained by fitting the log-normal models for the column models that exclude and include the black dashed line, respectively. The number concentrations for m (1.53–1.57, 0) were within the range of the standard deviation of its averaged number concentrations (1.55, 0). Therefore, the green solid and dashed curves were used to estimate
and σa values at wavelengths of 450, 550, and 700 nm without considering the wavelength dependence of particle sizing for m (n, k). Using Eqs. (3) and (4), and the assumption of the normal dispersion for the green solid and dashed curves, the estimated
and σa values were almost identical to the observed values, although the k values were higher than those in the column model (Tables 1–3). The estimated σa values were highest when 0.2 < D < 0.5 µm (Fig. 9a). The number size distribution of particles with D < 0.2 µm was different among the models (Fig. 8a). Consequently, the k value increased with decreasing number concentration of particles with D around 0.2 µm (Table 2).

The observed
and oAEi from 17.5°N to 16.0°N are listed in Table 1. The oAEi values showed the relationship 0 < oAE1 < oAE2 < oAE3. The
values at each wavelength were estimated using Eqs. (2) and (4). Assuming that the n value was uniform from D1 to the midpoint between D8 and D9 in the column model (Fig. 6), the values of eAEi were always estimated to be < 0 independent of the n value. This result differed from that for oAEi.
In general, the number size distributions have an inflection point at around 1 µm in diameter. The refractive index n1–6 values for particles from D1 to D6 may be different from the n6–9 values for particles from D6 to D9. Therefore, eAE i values were calculated for combinations of different values in n1–6 and n6–9 at 0.05 intervals of 1.35 to 1.65. Two cases, n1–6 > n6–9 and n1–6 < n6–9, were considered in the estimation of the eAEi values. No light-absorbing component, that is, k = 0, was assumed to simplify the determination of n value combinations.
In the case of n1–6 > n6–9, the eAEi values were estimated to be < 0 using n1–6 in particles with D < D6 corrected by n1–6, or eAE1 > eAE2 > eAE3 using n1–6 in particles with D < D6 corrected by n6–9. These results differed from the relationship among oAEi.
In the case of n1–6 < n6–9, the eAEi values were always estimated to be eAE1 < eAE2 < eAE3, except for n1–6 = 1.35. The p values were always small when using n1–6 in particles with D < D6 corrected by n6–9, in comparison with using n1–6 in particles with D < D6 corrected by n1–6. The appropriate combinations of (n1–6, n6–9) were (1.45, 1.60) and (1.50, 1.65). Furthermore, p values in the ranges of n1–6 = 1.45–1.50 and n6–9 = 1.60–1.65 were calculated at intervals of 0.01 to determine the most suitable combination of n1–6 and n6–9. The p value was minimal in the case of D6 = 0.981 µm corrected by n6–9 = 1.62. By considering the k value in particles with D < D6, the final appropriate values of n1–6, n6–9, and k were estimated to be 1.47, 1.62, and 0.0030, respectively, at all three wavelengths (Table 2). The normal dispersion did not contribute to the convergence of p values. The estimated
and σa values were the same as the observed values (Tables 1, 3). In this case, sf and df were 2.75 and 0.884, respectively.
The observed
, σa, and oAEi from 14.5°N to 13.5°N are listed in Table 1. The values of n1–6 = 1.47 and n6–9 = 1.62 for aerosol particles from 17.5°N to 16.0°N were applied to reproduce the values of
and σa from 14.5°N to 13.5°N. The values of p at other n values were higher than the p value in (n1–6, n6–9) = (1.47, 1.62). The minimum p value was 6.50 × 10⁻⁶ in k = 0 and sf = 2.5. However, D6 must be 1.038 µm (Fig. 10). The p value was sensitive to the position of D6 because n values differ across D6. Assuming that the k value was 0.0055 for particles with D < D6 (Table 2) and df of 0.828, the observed
and σa values were successfully reproduced by the column model (Tables 1, 3).

The observed
and σa values from 17.5°N to 16.0°N and from 14.5°N to 13.5°N were also reproduced using the green solid and dashed curves obtained by fitting the log-normal models for the column models (Figs. 8b, c). The
and σa values are estimated using Eqs. (3) and (4) were almost the same as the observed values (Tables 1, 3). The
values from 2 to 3 µm were slightly higher from 14.5°N to 13.5°N than 17.5°N to 16.0°N (Figs. 9b, c). In the column model, the values of σa were zero for coarse particles. In the log-normal model, however, the estimated σa values were in a comparatively wide size range. Therefore, the k values in the log-normal model were lower than those in the column model (Table 2).
5. Discussion
5.1 Polluted air masses
At a wavelength of 589 nm, the complex refractive indices are m (1.521, 0) for (NH4)2SO4 and m (1.544, 0) for NaCl (Seinfeld and Pandis 1998). The estimated n = 1.55 at a wavelength of 550 nm was close to these n values. Non-sea salt sulfates and sea salt are the primary chemical species in fine and coarse particles, respectively (Matsumoto et al. 1998; Campuzano-Jost et al. 2003; Heintzenberg et al. 2003).
Pollutants in the winter season are associated with black carbon from domestic coal burning (Dehkhoda et al. 2020). Using the shipboard measurements, Shiobara et al. (2007) estimated m (1.52–1.59, 0.002) in polluted air masses from the Asian continent over the western regions of the Ryukyu Islands of Japan. In the present study, the estimated n = 1.55 was within the range of Shiobara et al. (2007). Yabuki et al. (2003) estimated a maximum of k = 0.0114 in anthropogenic aerosols from 33.5°N to 30°N over the western North Pacific. Using sun photometer measurements, Bi et al. (2016) estimated n = 1.521 ± 0.025 and k = 0.00364 ± 0.0014 at a wavelength of 550 nm in the transported anthropogenic dust over East Asia. They also estimated that the refractive index at wavelengths ranging from 440 nm to 675 nm increased with an increase in wavelength. However, this was inconsistent with the normal dispersion estimated in the present study. Notably, these results are averages of aerosol optical properties from the surface to the top of the atmosphere. The k values estimated in the present study were larger than those reported in previous studies due to differences in size distribution assumptions for light–absorbing components (Table 2).
5.2 Pristine air masses
The complex refractive indices at 589 nm for NH4HSO4 and H2SO4 are m (1.473, 0) and m (1.426, 0), respectively (Seinfeld and Pandis 1998). The estimated n value for fine particles was close to the real part of m (n, k) for NH4HSO4. Shiobara et al. (2007) estimated m (1.38–1.40, < 0.001) in pristine air masses from the central North Pacific. Yabuki et al. (2003) estimated m (1.35–1.37, < 0.0014) in marine aerosols from 28°N to 3°N. In the present study, the estimated n and k values were higher than those reported by Shiobara et al. (2007) and Yabuki et al. (2003). This is because they did not consider the size dependence of m (n, k) when estimating the scattering and absorption coefficients. Virkkula et al. (2006) found that the n value increased with increasing particle diameter in the atmospheric boundary layer at the Finnish Antarctic Research Station. In the present study, the value of n = 1.47 estimated for fine particles was close to that estimated by Virkkula et al. (2006), while n = 1.62 for coarse particles was even higher than n = 1.544 for NaCl as the primary chemical species. This suggests that coarse particles are composed of sea salt and materials with n > 1.544. Water vapor was excluded as a candidate because m (1.333, 0) (Seinfeld and Pandis 1998).
The uptake and volatilization rates of gas-phase species by aerosol particles depend on the aerosol surface area per unit volume of air (Jacob 2000). In the VOC-removed air samples on Chichi-jima, the total surface area of the particles was smaller in August 2014 than in February 2015 (Fig. 5). However, in August 2014, the surface area with D > 1.1 µm was approximately 3 times greater than that of 0.3 < D < 1.1 µm. The surface area of the pre-existing particles in the VOC-removed air samples was maximum at approximately D = 3 µm. In addition, the effective diffusion rates for biogenic secondary organic materials (SOM) were at least 1000 times greater than those of anthropogenic SOM (Liu et al. 2016). Thus, VOCs appear to preferentially condense onto coarse particles. In the VOC-removed air sample from February 2015, the surface area of D > 1.1 was about 0.7 times smaller than that of 0.3 < D < 1.1 µm. In addition, the atmospheric VOC mixing ratios likely decreased due to low biological activity. For these reasons, the differences in the number size distributions between VOC-removed and untreated air samples would be more conspicuous in summer than in winter.
5.3 VOCs onto coarse particles in pristine air masses
Colomb et al. (2009) measured DMS, isoprene, carbonyls, and organohalogens over the Southern Indian Ocean. DMS was the most abundant VOC, with a mixing ratio ranging from 50 pptv to 885 pptv. The simultaneous enhancement of DMS, methyl bromide, dibromomethane, and methyl iodine was associated with high biological activity. They also showed that isoprene, terpenes, acetone, and acetaldehyde were biologically produced in the ocean. According to Rinaldi et al. (2010), increased VOC emissions by marine biota during the warm season result in relatively high WSOC concentrations in aerosol particles. Thus, atmospheric VOC mixing ratios are likely to be substantially higher in summer than in winter. This suggests that the volume of VOCs condensed on individual particles is larger in summer than in winter.
Most SOA masses consist of oligomeric compounds produced through gas-phase reactions between organic compounds and oxidants, such as O3, OH, and NOX (Denkenberger et al. 2007; Heaton et al. 2007). Kim et al. (2012) performed chamber experiments to investigate the refractive indices of SOA generated from the photooxidation of limonene and α–pinene with different HC/NOx ratios (ppbC ppb−1). At a wavelength of 532 nm ranging from 1.34 to 1.56 for limonene and from 1.36 to 1.52 for α–pinene, the refractive indices increased with decreasing HC/NOx. Varma et al. (2013) reported the refractive indices for SOA from the reaction between β-pinene and NO3. The refractive index was 1.61 ± 0.03 at wavelengths of 655–687 nm, under the condition of approximately 2 ppbC ppb−1, which was lower than the lower limit of the experimental conditions in Kim et al. (2012). The results of Kim et al. (2012) and Varma et al. (2013) suggest that high refractive indices are associated with either a high proportion of organic nitrates or the possibility of oligomerization in SOA. The increase in H:C ratios was measured in the SOA formed by the photooxidation of limonene and α–pinene; as the particles grow, and the oxidation progresses. The H:C ratio showed the best correlation with the refractive index. These results are consistent with oligomerization reactions (Kim et al. 2014). Hall and Johnston (2012) obtained MS/MS product ion spectra for many oligomers in SOAs produced by α–pinene ozonolysis. They reported that a gas-phase monomer collided with the particle surface and rapidly formed an oligomer.
Over the northwestern Pacific, WSOC mass concentrations were higher in coarse particles than in fine particles under marine background conditions (Matsumoto et al. 1998; Miyazaki et al. 2010). VOCs incorporated into aerosol particles could produce WSOC through oxidation processes. The considerably high refractive index of coarse particles in pristine air masses appears to be associated with the optical properties of VOCs and/or SOAs condensed onto coarse particles.
6. Summary and conclusions
Scattering substances in aerosol particles disperse sunlight, whereas light-absorbing substances absorb sunlight. These optical properties depend on the m (n, k) of the materials contained in aerosol particles. In addition to the aerosol scattering and absorption coefficients, to elucidate the difference in the number size distribution between polluted and pristine air masses, the number size distributions of aerosol particles were measured on Chichi-jima of the Ogasawara Islands and the JARE52 voyage track of the icebreaker Shirase from Tokyo to the offing of the Philippines in the atmospheric boundary layer over the northwestern Pacific.
Scattering and absorption coefficients were reproduced from the observed number size distribution and the assumption of m (n, k). The following requirements were needed for the estimated values to be in harmony with the observed values: In polluted air masses from 30.5°N to 29.5°N, a refractive index of 1.55 for aerosol particles at a wavelength of 550 nm was estimated to be uniform regardless of the number size distribution, which was close to the values for (NH4)2SO4 and NaCl. If k = 0 for coarse particles, the k values in the fine particles were 0.0168–0.0188. In addition, the refractive index, n, exhibits normal dispersion. In the pristine air masses from 17.5°N to 16.0°N and 14.5°N to 13.5°N, the refractive indices were estimated to be 1.47 for fine particles and 1.62 for coarse particles. The k values for fine particles were 0.0006–0.0030 from 17.5°N to 16.0°N and 0.0015–0.0055 from 14.5°N to 13.5°N. The refractive index of the fine particles was close to that of NH4HSO4 while the refractive index of the coarse particles was even higher than the 1.544 of NaCl.
Based on the differences in number size distribution between the VOC-removed and untreated air samples observed on Chichi-jima, VOCs appear to preferentially condense onto coarse particles. Previous laboratory experiment studies have suggested that high refractive indices are associated with the oligomerization of SOA. The results of the present study indicate that the m (n, k) of coarse particles in real air masses was most likely affected by organic compounds originating from biological activity.
Coarse particles probably act as the sink for VOCs and/or SOA, and the reaction media of reactive species; they could also affect the production of cloud droplets, chemical lifetimes of reactive species, and radiative effects of aerosol particles. Therefore, in the marine atmosphere, further investigation should be conducted on the relationship between optical properties and organic compounds in coarse particles.
Acknowledgments
I am indebted to M. Wada, M. Shiobara, and K. Hara for their valuable advice and thoughtful support. T. Kinase created and operated the sample-air heating system. This research focuses on the advanced preparation and operation of devices by T. Kinase and T. Murayama. I am grateful to M. Kawai for providing me with materials required to correct the PSAP values. I would also like to thank K. Matsumoto and F. Ito for their valuable comments. Special thanks to T. Yoshiyama of Tokyo-bika Co. Ltd. at the Ogasawara downrange station of the Japan aerospace exploration agency for his assistance with observations. I wish to express my gratitude to Bernhard Michel for providing the MieCalc software. This study was part of the Science Program of the Japanese Antarctic Research Expedition (JARE) and was supported by the National Institute of Polar Research (NIPR) under MEXT (Grant number AP11, Chief scientist, M. Hayashi). It was also supported by the NIPR through General Collaboration Project No. 2–16. I would like to thank Editage (https://www.editage.com) for their assistance with English language editing.
Data Availability Statement
The data analysis files are available in J-STAGE Data. https://doi.org/10.34474/data.jmsj.24438793
References
- Anderson, T. L., and J. A. Ogren, 1998: Determining aerosol radiative properties using the TSI 3563 integrating nephelometer. Aerosol Sci. Technol., 29, 57–69.
- Bates, T. S., J. A. Calhoun, and P. K. Quinn, 1992: Variations in the methanesulfonate to sulfate molar ratio in submicrometer marine aerosol particles over the south Pacific Ocean. J. Geophys. Res., 97, 9859–9865.
- Bi, J., J. Huang, B. Holben, and G. Zhang, 2016: Comparison of key absorption and optical properties between pure and transported anthropogenic dust over East and Central Asia. Atmos. Chem. Phys., 16, 15501–15516.
- Bikkina, S., K. Kawamura, Y. Miyazaki, and P. Fu, 2014: High abundances of oxalic, azelaic, and glyoxylic acids and methylgyoxal in the open ocean with high biological activity: Implication for secondary OA formation from isoprene. Geophys. Res. Lett., 41, 3649–3657.
- Bohren, C. F., and D. R. Huffman, 1998: Absorption and Scattering of Light by Small Particles. John Wiley & Sons, New York, USA, 544 pp.
- Bond, T. C., and R. W. Bergstrom, 2006: Light absorption by carbonaceous particles: An investigative review. Aerosol Sci. Technol., 40, 27–67.
- Bond, T. C., T. L. Anderson, and D. Campbell, 1999: Calibration and intercomparison of filter-based measurements of visible light absorption by aerosols. Aerosol Sci. Technol., 30, 582–600.
- Bond, T. C., S. J. Doherty, D. W. Fahey, P. M. Forster, T. Berntsen, B. J. DeAngelo, M. G. Flanner, S. Ghan, B. Kärcher, D. Koch, S. Kinne, Y. Kondo, P. K. Quinn, M. C. Sarofim, M. G. Schultz, M. Schulz, C. Venkataraman, H. Zhang, S. Zhang, N. Bellouin, S. K. Guttikunda, P. K. Hopke, M. Z. Jacobson, J. W. Kaiser, Z. Klimont, U. Lohmann, J. P. Schwarz, D. Shindell, T. Storelvmo, S. G. Warren, and C. S. Zender, 2013: Bounding the role of black carbon in the climate system: A scientific assessment. J. Geophys. Res.: Atmos., 118, 5380–5552.
- Campuzano-Jost, P., C. D. Clark, H. Maring, D. S. Covert, S. Howell, V. Kapustin, K. A. Clarke, E. S. Saltzman, and A. J. Hynes, 2003: Near–real–time measurement of sea–salt aerosol during the SEAS campaign: Comparison of emission-based sodium detection with an aerosol volatility technique. J. Atmos. Oceanic Technol., 20, 1421–1430.
- Ceburnis, D., C. D. O'Dowd, G. S. Jennings, M. C. Facchini, L. Emblico, S. Decesari, S. Fuzzi, and J. Sakalys, 2008: Marine aerosol chemistry gradients: Elucidating primary and secondary processes and fluxes. Geophys. Res. Lett., 35, L07804, doi: 10.1029/2008GL033462.
- Clarke, A. D., Y. Shinozuka, V. N. Kapustin, S. Howell, B. Huebert, S. Doherty, T. Anderson, D. Covert, J. Anderson, X. Hua, K. G. Moore II, C. McNaughton, G. Carmichael, and R. Weber, 2004: Size distributions and mixtures of dust and black carbon aerosol in Asian outflow: Physiochemistry and optical properties. J. Geophys. Res., 109, D15S09, doi: 10.1029/2003JD004378.
- Colomb, A., V. Gros, S. Alvain, R. Sarda-Esteve, B. Bonsang, C. Moulin, T. Klüpfel, and J. Williams, 2009: Variation of atmospheric volatile organic compounds over the Southern Indian Ocean (30–49°S). Environ. Chem., 6, 70–82.
- Dall'Osto, M., D. Ceburnis, C. Monahan, D. R. Worsnop, J. Bialek, M. Kulmala, T. Kurtén, M. Ehn, J. Wenger, J. Sodeau, R. Healy, and C. O'Dowd, 2012: Nitrogenated and aliphatic organic vapors as possible drivers for marine secondary organic aerosol growth. J. Geophys. Res., 117, D12311, doi: 10.1029/2012JD017522.
- Decesari, S., E. Finessi, M. Rinaldi, M. Paglione, S. Fuzzi, E. G. Stephanou, T. Tziaras, A. Spyros, D. Ceburnis, C. O'Dowd, M. Dall'Osto, R. M. Harrison, J. Allan, H. Coe, and M. C. Facchini, 2011: Primary and secondary marine organic aerosols over the North Atlantic Ocean during the MAP experiment. J. Geophys. Res., 116, D22210, doi: 10.1029/2011JD016204.
- Dehkhoda, N., Y. Noh, and S. Joo, 2020: Long–term variation of black carbon absorption aerosol optical depth from AERONET data over East Asia. Remote Sens., 12, 3551, doi: 10.3390/rs12213551.
- Denkenberger, K. A., R. C. Moffet, J. C. Holecek, T. P. Rebotier, and K. A. Prather, 2007: Real-time, single-particle measurements of oligomers in aged ambient aerosol particles. Environ. Sci. Technol., 41, 5439–5446.
- Facchini, M. C., S. Decesari, M. Rinaldi, C. Carbone, E. Finessi, M. Mircea, S. Fuzzi, F. Moretti, E. Tagliavini, D. Ceburnis, and C. D. O'Dowd, 2008: Important source of marine secondary organic aerosol from biogenic amines. Environ. Sci. Technol., 42, 9116–9121.
- Gantt, B., N. Meskhidze, and D. Kamykowski, 2009: A new physically-based quantification of marine isoprene and primary organic aerosol emissions. Atmos. Chem. Phys., 9, 4915–4927.
- Hall, W. A, and M. V. Johnston, 2012: Oligomer formation pathways in secondary organic aerosol from MS and MS/MS measurements with high mass accuracy and resolving power. J. Amer. Soc. Mass Spectrom., 23, 1097–1108.
- Heaton, K. J., M. A. Dreyfus, S. Wang, and M. V. Johnston, 2007: Oligomers in the early stage of biogenic secondary organic aerosol formation and growth. Environ. Sci. Technol., 41, 6129–6136.
- Heintzenberg, J., F. Raes, S. E. Schwartz, I. Ackermann, P. Artaxo, T. S. Bates, C. Benkovitz, K. Bigg, T. Bond, J.-L. Brenguier, F. L. Eisele, J. Feichter, A. I. Flossman, S. Fuzzi, H.-F. Graf, J. M. Hales, H. Herrmann, T. Hoffmann, B. Huebert, R. B. Husar, R. Jaenicke, B. Kärcher, Y. Kaufman, G. S. Kent, M. Kulmala, C. Leck, C. Liousse, U. Lohmann, B. Marticorena, P. McMurry, K. Noone, C. O'Dowd, J. E. Penner, A. Pszenny, J.-P. Putaud, P. K. Quinn, U. Schurath, J. H. Seinfeld, H. Sievering, J. Snider, I. Sokolik, F. Stratmann, R. van Dingenen, D. Westphal, A. S. Wexler, A. Wiedensohler, D. M. Winker, and J. Wilson, 2003: Tropospheric aerosols. Atmospheric Chemistry in a Changing World. Brasseur, G. P., R. G. Prinn, and A. A. P. Pszenny (eds.), Global Change - The IGBP Series, Springer-Verlag, Berlin, Germany, 125–156.
- Hinds, W. C., 1999: Aerosol Technology: Properties, Behavior, and Measurement of Airborne Particles. John Wiley & Sons, New York, USA, 504 pp.
- Hodkinson, J. R., and J. R. Greenfield, 1965: Response calculations for light-scattering aerosol counters and photometers. Appl. Opt., 4, 1463–1474.
- IPCC, 2013: Climate Change 2013. The Physical Science Basis. Contribution of Working Group I to the Fifth Assessment Report of the Intergovernmental Panel on Climate Change. Stocker, T. F., D. Qin, G.-K. Plattner, M. Tignor, S. K. Allen, J. Boschung, A. Nauels, Y. Xia, V. Bex, and P. M. Midgley (eds.), Cambridge University Press, Cambridge, UK and New York, USA, 1535pp.
- Jacob, D. J., 2000: Heterogeneous chemistry and tropospheric ozone. Atmos. Environ., 34, 2131–2159.
- Jaenicke, R., 1993: Tropospheric aerosols. Aerosol–Cloud–Climate Interactions. Hobbs, P. V. (ed.), Academic Press, San Diego, CA., 1–31.
- Kim, H., B. Barkey, and S. E. Paulson, 2012: Real refractive indices and formation yields of secondary organic aerosol generated from photooxidation of limonene and α-pinene: The effect of the HC/NO(×) ratio. J. Phys. Chem., 116, 6059–6067.
- Kim, H., S. Liu, L. M. Russell, and S. E. Paulson, 2014: Dependence of real refractive indices on O:C, H:C and mass fragments of secondary organic aerosol generated from ozonolysis and photooxidation of limonene and α-pinene. Aerosol Sci. Technol., 48, 498–507.
- Koga, S., 2021: Optical properties of aerosol particles in the atmospheric boundary layer in regions with and without sea ice. Polar Sci., 29, 100704, doi: 10.1016/j.polar.2021.100704.
- Koga, S., and H. Tanaka, 1999: Modeling the methanesul-fonate to non-sea-salt sulfate molar ratio and dimeth-ylsulfide oxidation in the atmosphere. J. Geophys. Res., 104, 13735–13747.
- Koga, S., T. Maeda, and N. Kaneyasu, 2008: Source contributions to black carbon mass fractions in aerosol particles over the northwestern Pacific. Atmos. Environ., 42, 800–814.
- Kulmala, M., H. Vehkamäki, T. Petäjä, M. Dal Maso, A. Lauri, V.-M. Kerminen, W. Birmili, and P. H. Mc-Murry, 2004: Formation and growth rates of ultrafine atmospheric particles: A review of observations. J. Aerosol Sci., 35, 143–176.
- Liu, P., Y. J. Li, Y. Wang, M. K. Gilles, R. A. Zaveri, A. K. Bertram, and S. T. Martin, 2016: Lability of secondary organic particulate matter. Proc. Natl. Acad. Sci. U.S.A. (PNAS), 113, 12643–12648.
- Mahajan, A. S., S. Fadnavis, M. A. Thomas, L. Pozzoli, S. Gupta, S. J. Royer, A. Saiz-Lopez, and R. Simó, 2015: Quantifying the impacts of an updated global dimethyl sulfide climatology on cloud microphysics and aerosol radiative forcing. J. Geophys. Res.: Atmos., 120, 2524–2536.
- Matsumoto, K., I. Nagao, H. Tanaka, H. Miyaji, T. Iida, and Y. Ikebe, 1998: Seasonal characteristics of organic and inorganic species and their size distributions in atmospheric aerosols over the northwest Pacific Ocean. Atmos. Environ., 32, 1931–1946.
- Miyazaki, Y., K. Kawamura, and M. Sawano, 2010: Size distributions and chemical characterization of water-soluble organic aerosols over the western North Pacific in summer. J. Geophys. Res., 115, D23210, doi: 10.1029/2010JD014439.
- Novakov, T., and J. E. Penner, 1993: Large contribution of organic aerosols to cloud-condensation-nuclei concentrations. Nature, 365, 823–826.
- O'Dowd, C. D., M. C. Facchini, F. Cavalli, D. Ceburnis, M. Mircea, S. Decesari, S. Fuzzi, Y. J. Yoon, and J.-P. Putaud, 2004: Biogenically driven organic contribution to marine aerosol. Nature, 431, 676–680.
- O'Dowd, C., C. Monahan, and M. Dall'Osto, 2010: On the occurrence of open ocean particle production and growth events. Geophys. Res. Lett., 37, L19805, doi: 10.1029/2010GL044679.
- Ohta, S., N. Murao, and S. Yamagata, 2013: Optical and chemical properties of atmospheric aerosols at Amami Oshima and Fukue Islands in Japan in spring, 2001. J. Meteor. Soc. Japan, 91, 63–73.
- Pirjola, L., C. D. O'Dowd, I. M. Brooks, and M. Kulmala, 2000: Can new particle formation occur in the clean marine boundary layer? J. Geophys. Res., 105, 26531–26546.
- Read, K. A., A. C. Lewis, S. Bauguitte, A. M. Rankin, R. A. Salmon, E. W. Wolff, A. Saiz-Lopez, W. J. Bloss, D. E. Heard, J. D. Lee, and J. M. C. Plane, 2008: DMS and MSA measurements in the Antarctic boundary layer: Impact of BrO on MSA production. Atmos. Chem. Phys., 8, 2985–2997.
- Rinaldi, M., S. Decesari, E. Finessi, L. Giulianelli, C. Carbone, S. Fuzzi, C. D. O'Dowd, D. Ceburnis, and M. C. Facchini, 2010: Primary and secondary organic marine aerosol and oceanic biological activity: Recent results and new perspectives for future studies. Adv. Meteor., 2010, 310682, doi: 10.1155/2010/310682.
- Rolph, G., A. Stein, and B. Stunder, 2017: Real-time Environmental Applications and Display sYstem: READY. Environ. Modell. Software, 95, 210–228.
- Savoie, D. L., and J. M. Prospero, 1982: Particle size distribution of nitrate and sulfate in the marine atmosphere. Geophys. Res. Lett., 9, 1207–1210.
- Seinfeld, J. H., and S. N. Pandis, 1998: Atmospheric Chemistry and Physics: From Air Pollution to Climate Change. Wiley, New York, 1326 pp
- Shaw, S. L., B. Gantt, and N. Meskhidze, 2010: Production and emissions of marine isoprene monoterpenes: A review. Adv. Meteor., 2010, 408696, doi: 10.1155/2010/408696.
- Shiobara, M., K. Hara, M. Yabuki, and H. Kobayashi, 2007: Optical and chemical properties of marine boundary–layer aerosol around Japan determined from shipboard measurements in 2002. Atmos. Environ., 41, 4638–4652.
- Srivastava, A. K., B. J. Mehrotra, A. Singh, V. Singh, D. S. Bisht, S. Tiwari, and M. K. Srivastava, 2020: Implications of different aerosol species to direct radiative forcing and atmospheric heating rate. Atmos. Environ., 241, 117820, doi: 10.1016/j.atmosenv.2020.117820.
- Stein, A. F., R. R. Draxler, G. D. Rolph, B. J. B. Stunder, M. D. Cohen, and F. Ngan, 2015: NOAA's HYSPLIT atmospheric transport and dispersion modeling system. Bull. Amer. Meteor. Soc., 96, 2059–2077.
- Sullivan, P. D., B. R. Stone, Z. Hashisho, and M. J. Rood, 2007: Water adsorption with hysteresis effect onto microporous activated carbon fabrics. Adsorption, 13, 173–189.
- Varma, R. M., S. M. Ball, T. Brauers, H.-P. Dorn, U. Heitmann, R. L. Jones, U. Platt, D. Pohler, A. A. Ruth, A. J. L. Shillings, J. Thieser, A. Wahner, and D. S. Venables, 2013: Light extinction by secondary organic aerosol: An intercomparison of three broadband cavity spectrometers. Atmos. Meas. Tech., 6, 3115–3130.
- Virkkula, A., I. K. Koponen, K. Teinilä, R. Hillamo, V.-M. Kerminen, and M. Kulmala, 2006: Effective real refractive index of dry aerosols in the Antarctic boundary layer. Geophys. Res. Lett., 33, L06805, doi: 10.1029/2005GL024602.
- Weber, R. J., P. H. McMurry, R. L. Mauldin III, D. J. Tanner, F. L. Eisele, A. D. Clark, and V. N. Kapustin, 1999: New particle formation in the remote troposphere: A comparison of observations at various sites. Geophys. Res. Lett., 26, 307–310.
- Yabuki, M., M. Shiobara, H. Kobayashi, M. Hayashi, K. Hara, K. Osada, H. Kuze, and N. Takeuchi, 2003: Optical properties of aerosols in the marine boundary layer during a cruise from Tokyo, Japan to Fremantle, Australia. J. Meteor. Soc. Japan, 81, 151–162.


