Article
Roles of August Kuroshio SST Anomaly in Precipitation Variation during September over Central China

2024 Volume 102 Issue 1 Pages 111-123

Details
2024 Volume 102 Issue 1 Pages 111-123
Sea surface temperature anomaly (SSTA) in the Kuroshio region near the East China Sea (K-ECS) during August has been found to be closely related to the September precipitation anomaly over Central China (CC) in this study. The significant causality is identified from SSTA in K-ECS to anomalous rainfall over CC. When a negative SSTA occurs in K-ECS during August, its cooling effect on the overlying atmosphere lasting from August to September promotes the formation of anomalous anticyclonic circulation below 600 hPa above K-ECS and the southeast of China by weakening the local convection. The southerly in the west of this anomalous circulation transports more water vapor into CC. Eventually, the convergence of moisture provides favorable conditions for the generation of precipitation here. The responsive characteristics of the anomalous atmospheric circulation during September to a negative SSTA in K-ECS in August can be confirmed through numerical experiments. The above important long-term relationship suggests that SSTA in K-ECS during August could serve as a valuable predictor for September precipitation over CC.
Precipitation is one of the most important meteorological variables in the study of climate change. It can induce severe meteorological disasters and further impact human life, socioeconomy and ecological environment (Niu and Li 2008; Barriopedro et al. 2012; Yang et al. 2012; Zhang et al. 2012, 2019; Zhang et al. 2014; Zhou et al. 2018). Autumn (SON: from September to November) is the key period for crop maturity, harvest and sowing winter wheat in China. The severe rainfall and drought in this season frequently cause enormous damage to agricultural production (Barriopedro et al. 2012; Zhang et al. 2012; Zhang et al. 2014; Zhou et al. 2018). Therefore, considerable attentions have been drawn to the causes of autumn precipitation.
El Niño–Southern Oscillation (ENSO), the strongest signal of interannual variations in the air-sea coupled system, has been extensively revealed by previous studies to induce autumn precipitation anomalies in China. The eastern-Pacific and central-Pacific types of El Niño change the transport path of tropospheric moisture and the location of anomalous water vapor divergence by affecting the Hadley circulation and the western North Pacific Subtropical High (WNPSH), which further result in opposite precipitation anomalies in the southern China (Zhang et al. 2013; Gu et al. 2014; Zhang et al. 2014; Hu et al. 2018b; Yuan and Wang 2019). Additionally, the effects of La Niña on the subtropical and even midlatitude atmospheric circulations can lead to anomalous precipitation in the south and north of China, respectively (Feng and Wang 2018; Yuan and Wang 2019). Moreover, as the high-degree synergic air-sea interactions, both ENSO and Indian Ocean Dipole can cooperatively impact boreal autumn rainfall in eastern China by altering atmospheric circulation over the western North Pacific (WNP) and the East Asian jet stream (Xiao et al. 2015; Xu et al. 2016; Li and Zhao 2019). For the specific extreme event, apart from the involvement of ENSO, the long-lasting Madden-Julian Oscillation also plays an important role in autumn precipitation in China (Qi et al. 2021).
In addition to the influence of tropical sea surface temperature (SST) anomalies (SSTAs), numerous studies have focused on the role of mid-high latitude signals. From the upstream of China, the sea ice anomaly in Barents-Kara Seas yielding an eastward Rossby wave train and the North Atlantic Oscillation stimulating a downstream Atlantic-Eurasian teleconnection can induce autumn rainfall in the central-eastern China (Xu et al. 2013; Shen et al. 2019). As an important circulation system over China, the East-Asian trough, modulated by the phase of Pacific Decadal Oscillation or Asian-Pacific Oscillation, is one of the main factors affecting autumn precipitation north of the Yangtze River (Qin et al. 2018; Wang et al. 2019; Lin et al. 2021). Besides, as a downstream signal, the generation of autumn tropical cyclones over WNP is accompanied by abundant moisture transport, which further enhances convective precipitation in southern China (Wu et al. 2005; Hong et al. 2016; Hu et al. 2018a).
Most studies on autumn precipitation in China have concerned the entire season, but there are some differences in precipitation in different months of autumn. The spatial distribution of rainfall in September is distinct from that in the remaining two months in autumn (Fig. 1). Comparatively, the standard deviation of accumulated precipitation over Central China is significantly larger in September. Apart from precipitation, the atmospheric circulation regime in September is also different from that in the other two months, which is characterized by the abrupt southward migration of the East Asian jet and WNPSH after September (Yeh et al. 1958; Liu et al. 2022). The distinctiveness of September atmospheric variables in autumn suggests that the anomalous precipitation in this month is worth studying separately. Given the noticeable variability (Fig. 1e), the present study aims to explore the mechanism of the precipitation anomaly over Central China during September.
Kuroshio is an important western boundary current in the Pacific Ocean, characterized by a high ocean current velocity and a prominent ocean temperature front. Regarding anomalous precipitation in China, extensive researches have focused on the impacts of SST near the Kuroshio region. Meiyu in China (known as Baiu in Japan and Changma in Korea) is a typical episode of the East Asian rainy season (Liu et al. 2020). The variations of anomalous atmospheric circulation, influenced by the SST in the Kuroshio region near the East China Sea (ECS) through changing air temperature and humidity, can modulate the Meiyu rainfall (Matsumura and Horinouchi 2023; Gan et al. 2019; Xu et al. 2018; Sasaki and Yamada 2018; Minobe and Takebayashi 2015; Sasaki et al. 2012). In warm season, the SSTA along the Kuroshio region (such as the region near the East China Sea and Kuroshio Extension) could lead to the geopotential height anomalies through altering lower atmospheric temperature, which affects the variations of WNPSH and thus results in the anomalous precipitation over the eastern China (Guan et al. 2019; Geng et al. 2022; Wang et al. 2023). Additionally, the Kuroshio thermal effect adjacent to the ECS can result in anomalous planetary boundary layer height gradient through altering vertical mixing, which leads to plentiful vertical moisture transport and further enhances rainfall in southern China during winter (Bai et al. 2020, 2023). In addition to the synchronous impact, several studies have indicated the importance of spring Kuroshio SST on summer precipitation in eastern China, in which the teleconnection pattern acts as a bridge to establish the connection between the two variables (Fang et al. 2018; Ying et al. 2017).
Considering the essential influence of Kuroshio SST near the ECS on anomalous precipitation in China, it is natural to wonder whether the September rainfall anomaly over Central China can be affected by the Kuroshio SST. If so, what physical mechanisms are included in this process? To answer these questions, the remainder of this paper is organized as follows. In Section 2, data and methods are briefly introduced. The possible physical mechanisms of the precipitation over Central China in September are analyzed in Section 3. Finally, the summary and discussions are given in Section 4.
In this study, the dataset of gridded monthly precipitation (Version 2.0), with a horizontal resolution of 0.5° × 0.5°, is kindly provided by the National Meteorological Information Center (NMIC) of the China Meteorological Administration (CMA). It is based on precipitation data from 2472 weather stations in China. The monthly SST at a 0.25° resolution, obtained from the Optimum Interpolation SST Version 2.1 (OISST; Reynolds et al. 2007; Huang et al. 2021), is employed for exploring the effect of anomalous oceanic signals. To analyze atmospheric dynamics, the monthly atmospheric variables, including geopotential height, specific humidity, horizontal wind and vertical velocity, are taken from the fifth-generation European Center for Medium-Range Weather Forecasts (ECMWF) reanalysis of the global climate (ERA5; Hersbach et al. 2019) on a 0.25° grid. To ensure the consistency of analysis, the time period of all variables has been selected from 1982 to 2021. Their anomalies are formed by removing the long-term mean seasonal cycle and linear fit.
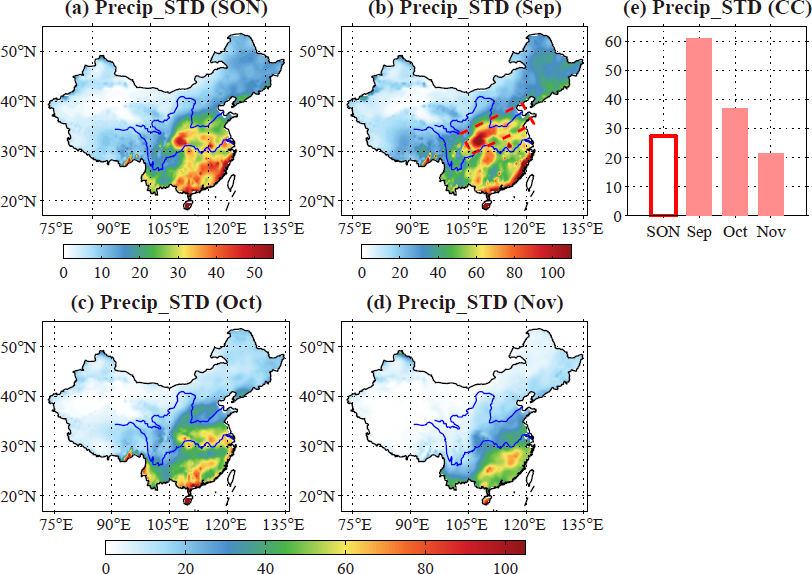
(a) Standard deviation of accumulative precipitation in China during autumn (SON). (b) to (d) Same as (a), but for accumulative precipitation in September, October and November, respectively. The dashed red box in (b) represents the Central China (CC) domain. (e) Standard deviation of accumulative precipitation averaged in CC during autumn and each month in this season.
Given that the statistical relationship cannot reflect the causal relationship, a causality analysis method based on Liang-Kleeman information flow theory (Liang 2014, 2015) is used to unravel the causality between time series, which is applicable to both linear and nonlinear systems (Stips et al. 2016; Bai et al. 2018; Xiao et al. 2020). For two time series X1 and X2, the rate of information flowing from X2 to X1 can be estimated by
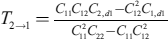 , where Cij is the sample covariance between Xi and Xj, and Ci,dj represents the sample covariance between Xi and
 using Euler forward scheme). When the absolute value of T2→1 is significantly greater than 0, X2 is the cause of X1. Here, the significant test of T2→1 is conducted by the Monte Carlo test approach, in which the 300 random series are generated to obtain the 95 % confidence interval (CI). If the absolute value of T2→1 is beyond CI, the causal relationship is significant at 95 % confidence level (The 95 % CI is almost unchanged when using more than 300 random series). Moreover, a negative value of T2→1 means that X2 tends to stabilize X1, while the positive one implies that X2 makes X1 more uncertain or more unpredictable.
Furthermore, to examine the influence of Kuroshio SSTA on atmospheric circulation, the atmospheric general circulation model (AGCM) experiments have been conducted by the Community Atmospheric Model version 6.0 (CAM 6.0; Danabasoglu et al. 2020) with a horizontal resolution of 1.9° × 2.5° and 32 vertical levels. The design of numerical experiment will be demonstrated in Section 3.
As a persistent medium of air-sea coupled system, SST could be one of the factors affecting precipitation over Central China in September. To verify the relationship, we calculate the correlation coefficient between SSTA and precipitation anomaly averaged in Central China. The results show that the accumulative precipitation here in September has a significant relationship with SSTA in the Kuroshio region near the ECS (K-ECS: 125–137°E, 20–34°N; red box in Fig. 2a) during August. When there is a negative SSTA in K-ECS during August, the accumulative precipitation over Central China increases in September. The correlation results between the time series of September precipitation anomaly averaged in Central China and the August SSTA in K-ECS (Fig. 2a), as well as those between the time series of August SSTA averaged in K-ECS and the September precipitation anomaly over Central China (Fig. 2b), both reflect the significant negative correlation relationship. And the correlation coefficient between these two standardized time series is −0.47 exceeding the 95 % confidence level according to the two-tailed Student's t test (Fig. 2e). Furthermore, to examine the causality between above two variables, the flow of information from August SSTA to September precipitation anomaly has been shown in Figs. 2c and 2d. The significant information flow rate indicates that SSTA in K-ECS during August is a causal factor resulting in the precipitation anomaly over Central China in September.

(a) The correlation coefficient between the distribution of August SSTA and the time series of accumulative precipitation anomaly averaged in CC during September. The dashed red box represents the Kuroshio region near the East China Sea [K-ECS: 125–137°E, 20–34°N] region. (b) Same as (a), but between the September accumulative precipitation anomaly in China and the time series of August SSTA averaged in K-ECS. The dashed red box represents CC domain. Yellow dots in (a) and (b) indicate significance at the 95 % confidence level according to the two-tailed Student's t test. (c) Information flow from August SSTA in the Northwest Pacific Ocean to the time series (TS) of accumulative precipitation anomaly averaged in CC during September (units: nats month−1). (d) Same as (c), but from the time series of August SSTA averaged in K-ECS to the September accumulative precipitation anomaly in China. Yellow dots in (c) and (d) same as (a) and (b), but according to the Monte Carlo test. (e) The standardized time series of August SSTA averaged in K-ECS (blue line) and accumulative precipitation anomaly averaged in CC during September (green bars). Gray dots are their scatterplot, in which magenta dots denote the opposite of their values. The linear regression of both variables is calculated (red line), and the value on the top right panel indicates the correlation coefficient of these two time series (two asterisks represent the value exceeding the 95 % confidence level). Black dashed lines denote the zero line.
To explore the anomalous variations of September precipitation over Central China, Fig. 3a displays the anomalous water vapor flux and its divergence integrated from 1000 hPa to 200 hPa in September regressed onto the standardized time series of accumulative precipitation anomaly averaged over Central China during the same period. Apparently, the increased precipitation over Central China is accompanied by an anomalous anticyclonic circulation over southeastern China and K-ECS during September. Under the action of this anomalous atmospheric circulation, abundant moisture is transported to Central China by the southerly, which leads to the convergence of water vapor and further creates a favorable condition for the generation of precipitation here. Due to the influence of intensive meridional water vapor flux below the middle troposphere, the moisture convergence over Central China, predominantly composed of meridional components, is mainly concentrated below 600 hPa (Figs. 3b, c).

(a) Regression of anomalous water vapor flux (WVF; vectors; units: 10−3 g s−1) and its divergence (shaded; units: 10−10 g m−1 s−1) integrated from 1000 hPa to 200 hPa onto the standardized time series of accumulative precipitation anomaly averaged in CC during September. (b) Same as (a), but for the vertical variations of anomalous water vapor flux divergence (WFVD) averaged in CC domain (black line; units: 10−10 g m−1 s−1). Blue and red lines denote its meridional and zonal components, respectively. Solid points indicate significance at the 90 % confidence level according to the two-tailed Student's t test. (c) Same as (a), but for latitude-pressure cross section of meridional water vapor flux anomaly (units: 10−3 g s−1) averaged between 106°E and 122°E. Yellow dots in (a) and (c) and blue vectors in (a) indicate significance at the 90 % confidence level according to the two-tailed Student's t test.
As one of the factors causing the anomalous precipitation over Central China in September, August SSTA in K-ECS may establish a connection with precipitation by altering atmospheric circulation. To clarify the specific mechanism of such a time lag, Figs. 4 and 5 show the variations of circulation and surface heat flux regressed onto the standardized time series of SSTA during August in K-ECS. Hereafter, the time series of SSTA is multiplied by a minus sign to visually represent the relationship between it and atmospheric variables. In August, there is an anomalous cyclonic circulation over K-ECS (Fig. 4a), corresponding to the active local convection. Thus, the cloud cover increases over K-ECS (Fig. 4a), which reduces the downward solar radiation here (positive downwards; Fig. 4c). This anomalous atmospheric circulation leads to negative SSTA (Fig. 5a). Concurrent with the negative SSTA in K-ECS, a positive surface turbulent heat flux anomaly (sum of surface latent and sensible heat flux) is observed here (Fig. 4e), which indicates a cooling effect of the ocean on the overlying atmosphere. And due to the temporal persistence of SST (Figs. 5a, b), this cooling effect lasts until September (Fig. 4f), which weakens the local convection over K-ECS. Correspondingly, there is an anomalous descending motion above it in September (Fig. 5c), which corresponds to the anomalous divergence and the formation of anticyclonic circulation anomaly at the low troposphere (Fig. 5d). Thus, in September, the cloud cover decreases over K-ECS (Fig. 4b), and the downward solar radiation increases here (Fig. 4d). Due to the cooling effect of the ocean and its absorption of solar radiation, although the negative SSTA over K-ECS can persist until September, its amplitude is weakened (Fig. 5b), which also reflects the feedback of SSTA to the anomalous anticyclonic circulation. Hence, compared with the situations in September (not shown), the statistical correlation and causal relationships between August SSTA in K-ECS and precipitation anomaly over Central China are more significant.

Regression of anomalous (a) total cloud cover (TCC; shaded; dimensionless), geopotential height (contours; units: gpm; spaced at 2-gpm interval) at 1000 hPa, (c) surface net solar radiation (SSR; positive downwards; units: W m−2) and (e) surface turbulent heat flux (STHF; positive downwards; units: W m−2) during August onto the standardized time series of August SSTA averaged in K-ECS. (b), (d), (f) Same as (a), (c), (e), but for anomalous variables in September. In (b), the contour interval is 1-gpm. Yellow dots in (a) to (f) indicate significance at a 90 % confidence level according to the two-tailed Student's t test.

(a) Regression of the distribution of August SSTA (units: K) onto the standardized time series of August SSTA averaged in K-ECS (dashed red box). (b) to (d) Same as (a), but for (b) SSTA distribution (units: K), (c) anomalous vertical velocity (positive downwards; units: 10−2 Pa s−1) at 600 hPa, (d) anomalous horizontal divergence of wind velocity (shaded; units: 10−6 s−1) and geopotential height (contours; units: gpm; spaced at 1-gpm interval) at 1000 hPa during September. Yellow dots in (a) to (d) indicate significance at a 90 % confidence level according to the two-tailed Student's t test.
Compared with the geopotential height anomaly related to September precipitation over Central China (Fig. 6a), the anomalous geopotential height affected by August SSTA in K-ECS is primarily below 600 hPa over K-ECS and the southeast of China (Fig. 6b). To further confirm the influence of August SSTA in K-ECS on atmospheric circulation in September, the AGCM experiments has been designed. The global climatological SST with an annual cycle has been chosen as the forcing condition in the control run. The negative SST perturbations in K-ECS have been superimposed onto the SST field of control runs. The resulting combined SST is then used to force the sensitivity run. Each experiment has been integrated for 30 years. The differences of the last 20 years between the sensitivity and control runs have been analyzed to verify the atmospheric response to August SSTA in K-ECS. As shown in Figs. 6c and 6d, there is an anticyclonic circulation over K-ECS and the southeast of China, which is similar to that obtained from re-analysis data (Fig. 6b) except that its coverage area is mainly concentrated in the west of 125°E. Due to the anomalous anticyclonic circulation in numerical experiments being biased westward (Figs. 6b–d), there is a westward bias in the position of anomalous northward transport of water vapor (Figs. 6d, e). Hence, the region of anomalous water vapor convergence in AGCM experiments (blue line in Fig. 6f) differs from that in reanalysis results (red line in Fig. 6f). In the model, the convergence of water vapor is mainly located in the west of Central China (Fig. 6d and blue line in Fig. 6f), which corresponds to the area with increased precipitation (not shown). Although there are some deviations between reanalysis and model results in the spatial patterns of water vapor and precipitation fields over Central China, the AGCM experiments can capture the features of atmospheric circulation as shown in reanalysis results, which proves the interpretability of August SSTA in K-ECS for the anomalous atmospheric circulation transporting moist air to Central China during September.

Regressed longitude-pressure cross sections of anomalous geopotential height (units: gpm) averaged between 23°N and 29°N onto the standardized time series of (a) accumulative precipitation anomaly averaged in CC during September and (b) August SSTA averaged in K-ECS. (c) Same as (a), but for the averaged results of AGCM experiments over the last 20 years caused by the negative SST perturbations in K-ECS. (d) Anomalous WVFD (shaded; units: 10−10 g m−1 s−1) integrated from 1000 hPa to 600 hPa, WVF (vectors; units: 10−3 g s−1) and geopotential height (contours; units: gpm; spaced at 1-gpm interval) at 850 hPa of the averaged results of AGCM experiments over the last 20 years. The displayed WVF and geopotential height are significant at a 90 % confidence level. (e) Same as (c), but for anomalous meridional WVF (shaded; units: 10−3 g s−1) and the reanalysis results regressed onto the standardized time series of August SSTA averaged in K-ECS (contours; cyan contours: positive values; magenta contours: negative values). Yellow dots in (a) to (e) indicate significance at a 90 % confidence level according to the two-tailed Student's t test. (f) The zonal variations of anomalous WVFD averaged in the meridional range of CC domain (units: 10−10 g m−1 s−1; red line: the regressed results onto the standardized time series of August SSTA averaged in K-ECS; blue line: the averaged results of AGCM experiments over the last 20 years). Black dashed line in (f) denote the zero line.
By comparison, the anomalous atmospheric circulation related to September precipitation over Central China extends from the lowest pressure level (1000 hPa) to the upper troposphere (200 hPa), which exhibits the quasi-barotropic structure (Fig. 6a). However, only the portion below 600 hPa is affected by August SSTA in K-ECS (Figs. 6b, c). Considering that the meridional water vapor transport connected to precipitation is mainly below 600 hPa (Fig. 3c), the reasons for the circulation changes in the upper troposphere have not been discussed here.
In this study, we have found that there is a significant negative correlation between August SSTA in K-ECS and the anomalous precipitation over Central China during September. And the causality analysis based on Liang–Kleeman information flow theory (Liang 2014, 2015) has indicated that the former is a cause leading to the September precipitation anomaly over Central China. The variations of atmospheric circulation related to both variables have been analyzed to understand the influential mechanism. Due to the temporal persistence of SST, the cooling effect of negative SSTA in K-ECS on the overlying atmosphere lasts from August to September, which weakens local convection and subsequently alters the wind divergence. And the anticyclonic circulation anomaly is formed above it. As the western part of the anomalous anticyclonic circulation, the southerly carries out abundant water vapor to Central China, which provides the favorable condition for generating precipitation here. The anomalous circulation caused by SSTA in K-ECS is chiefly concentrated below 600 hPa over K-ECS and southeast China, which is demonstrated by the results of AGCM experiments. The anomalous thermal forcing in K-ECS could establish a close causal relationship with precipitation over Central China during September by affecting atmospheric circulation, which implies that the August SSTA in K-ECS can be potentially effective as a predictability source for September precipitation over Central China.
The oceanic temperature front in the subtropical North Pacific Ocean usually impacts the variations of westerly and storm track (Chen et al. 2019; Hu et al. 2022, 2023) by changing the atmospheric baroclinicity. Considering that there is also a strong oceanic temperature front in K-ECS, in future studies, it is necessary to explore the roles played by the Kuroshio SST front in ECS in altering the atmospheric circulation and its impact on precipitation over China.
Besides, as a crucial anticyclonic circulation system in the mid-lower troposphere over the WNP during warm season, WNPSH is closely related to the precipitation over eastern China. As the upstream of WNPSH, the mid-latitude Silk Road wave train is proved to affect the position and intensity of WNPSH (Chen and Huang 2012; Guan et al. 2019; Wang et al. 2023). In general, the influences of the zonal wave trains propagate along the Asian subtropical westerly jet. The behavior of the Silk Road pattern could be modulated by the meridional position of the Asian subtropical westerly jet (Hong and Lu 2016; Li and Lu 2017; Hong et al. 2018), which is usually associated with the thermal and orographic forcing of the Tibetan Plateau (Schiemann et al. 2009; Molnar et al. 2010; Park et al. 2012; Kong and Chiang 2020). Taken together, these studies suggest that the Tibetan Plateau forcings might influence the variations of WNPSH through altering the Asian subtropical westerly jet that modulates the Silk Road pattern. In addition, the heat source over the Tibetan Plateau favors the eastward extension of South Asia high (Wan et al. 2017; Lu et al. 2018; Ge et al. 2019), which promotes the westward movement of intensified WNPSH by changing the local atmospheric vorticity (Chen and Zhai 2016; Guan et al. 2018; Ge et al. 2019; Wei et al. 2019). Based on the above studies, it is indicated the important roles of the Tibetan Plateau forcings in the precipitation over eastern China. In this study, Central China is located in the middle and lower reaches of the Yangtze River, which is a part of eastern China. Hence, in future studies, it would be necessary to explore whether the precipitation here is affected by the forcings of Tibetan Plateau. If it is indeed influenced, it will be worthwhile to analyze the relative importance of Tibetan Plateau forcings, SSTA in K-ECS and Kuroshio SST front in ECS.
In this study, there are some deviations between reanalysis and model results in the spatial patterns of water vapor and precipitation fields. To improve these differences, the regional climate model (RCM) is perhaps a good option for the refined simulations. However, the response of large-scale atmospheric circulation might be limited by the scope of RCM. Using the atmospheric circulation fields obtained from global models to drive the refined RCM may be a viable approach. Considering the periodicity and difficulty of conducting related experiments by using RCM, we will attempt to design AGCM experiments based on refined RCM for the further explorations.
Precipitation provided by NMIC of CMA is downloaded from http://data.cma.cn/data/cdcdetail/dataCode/A.0012.0001.html. Atmospheric variables from ERA5 are openly available at https://www.ecmwf.int/en/forecasts/datasets/reanalysis-datasets/era5. OISST data is derived from https://www.ncei.noaa.gov/data/sea-surface-temperature-optimum-interpolation/v2.1/access/avhrr/.
The authors are grateful to the Editor and anonymous reviewers, whose comments and suggestions have greatly improved the manuscript, and are thankful to the public platforms for providing the data listed in Section 2. This study was supported by the National Natural Science Foundation of China (U2242206 and 42106036).