Abstract
Various cloud systems responsible for snowfall along the western coast of Japan are formed over the Sea of Japan. In the present study, stratiform snow clouds associated with a mid-level trough were investigated using an instrumented aircraft and dual Doppler radars. The snow clouds exhibited a double-layer structure with thermo-dynamically and kinematically different characteristics. The top height and base height of the clouds were 4.5 km and 0.9 km at temperatures of −29 °C and −5 °C, respectively. The layer below 2 km mean sea level (MSL) had turbulent air, which reflected its convectively unstable stratification. The maximum updraft exceeded 4 m s−1 at approximately 1 km MSL, and the maximum cloud water content was 0.6 g m−3. The layer above 2 km was less turbulent and characterized by a weak updraft of < 2 m s−1 and maximum cloud water content of 0.1 g m−3. These values were considerably lower than those in the lower layer. The weak updraft was likely caused by an approaching mid-level trough. Ice crystal and precipitation particle concentrations, measured using two-dimensional cloud and precipitation optical array probes, respectively, were almost constant with height and measured several tens of particles L−1 and several particles L−1, respectively. Precipitation particles grew by the seeder-feeder mechanism in the two-layer stratiform snow cloud. In the upper layer (2–4.5 km), precipitation particles increased in size by vapor deposition and showed a remarkable broadening of size distributions toward large sizes. In the lower layer (0.9–2 km MSL), the precipitation particles grew further via accretion of supercooled cloud droplets and produced denser particles like graupel with no substantial change in the size distribution. Below 0.9 km MSL, particle concentrations decreased at all sizes due to sublimation and melting.
1. Introduction
In winter, different cloud systems responsible for snowfall along the western coast of Japan form over the Sea of Japan. These cloud systems are formed by a combination of two driving forces. First, heat and moisture are supplied from the warm sea surface to the airmass overlying it, which forms a convectively mixed layer and convective clouds in the latter. The second factor is the lifting of an airmass caused by synoptic and/or meso-scale disturbances, which primarily forms stratiform clouds. Heat and moisture supply typically forms isolated convective snow clouds, longitudinal-mode (L-mode) snow bands with an orientation parallel to the boundary layer flow, and transverse-mode (T-mode) snow bands with an orientation almost perpendicular to the boundary layer flow that appears during cold airmass outbreaks. In contrast, the stratiform clouds formed via an uplifting airmass are associated with a warm front and/or mid-level trough.
In the winter, stratocumulus clouds in the convectively mixed layer and shallow, elevated stratiform clouds associated with a mid-level (700–500 hPa) trough may couple, resulting in precipitation over the Sea of Japan. These cloud systems are considered an intermediate type, and both driving forces appear to equally contribute to their formation.
The occurrence frequencies of snow clouds and their contributions to the total wintertime precipitation were investigated by Sakakibara et al. (1988) and Mizuno (2005). Over the sea off the west coast of the Tohoku district in Japan, snow clouds associated with the Japan-Sea polar-air mass convergence zone (JPCZ; Asai 1988) cause no substantial snowfall (Endoh et al. 1984). In this region, the occurrence frequencies of convective clouds (isolated, L-mode, and T-mode snow clouds) that are formed by heat and moisture fluxes are the highest and contribute to approximately 80 % of the total cloud occurrence. However, the contributions of stratiform clouds associated with synoptic-scale lows and meso-scale mid-level troughs comprise 40 % of the total precipitation (Mizuno 2005).
Microphysical and kinematic structures of the convective snow clouds were investigated by Murakami et al. (1994, 1996), Yamada et al. (1994, 1996, 2010), Fujiyoshi et al. (1998), Yoshimoto et al. (2000), Ohigashi and Tsuboki (2005), and reviewed by Murakami (2019). However, studies on the micro- and meso-scale structures of snow clouds associated with mid-level troughs are few.
In the present study, we aimed to investigate the thermodynamical, kinematical, and microphysical structures and the precipitation mechanisms of snow clouds that are formed in association with the mid-level trough over the Sea of Japan based on synchronous observations using an instrumented aircraft and dual Doppler radars.
2. Observation facilities
To investigate micro- and meso-scale structures of snow clouds and their precipitation mechanisms and to evaluate the feasibility of snow cloud modification by cloud seeding, the Cooperative Japan Sea Snow Cloud Project (Meteorological Research Institute 2005) was conducted over the coastal region facing the Sea of Japan in Tohoku district for five consecutive winters from 1989 to 1993. In its 1993 field campaign, the main observation facilities included an instrumented aircraft (Wyoming King Air) and dual Doppler radars. The aircraft was based at the Sendai Airport and flew over the observation area (shown by the rectangle in Fig. 1); this provided us with microphysical, thermo-dynamic, and kinematic data for snow clouds and the surrounding regions. The aircraft was equipped with a Rosemount total air temperature (TAT) sensor and a reverse-flow TAT sensor for temperature measurements and a Cambridge chilled-mirror type hygrometer to record the dewpoint temperature. The microphysical measurements were made using Particle Measuring Systems probes. These included a forward scattering spectrometer probe (FSSP) which can measure cloud droplets in the range of 2–47 μm with 3 μm intervals, two-dimensional cloud particle optical array probe (OAP-2D-C) with a range of 25–800 μm and intervals of 25 μm, two-dimensional precipitation particle optical array probe (OAP-2D-P) with a range of 200–6400 μm and intervals of 200 μm, and one-dimensional cloud particle optical array probe (OAP-1D-C) with a range of 12.5–187.5 μm and intervals of 12.5 μm. The cloud liquid water content was measured using Johnson-Williams and King hot-wire probes. In addition, the cloud liquid water content was calculated from the droplet size distribution measured by FSSP. Honeywell LASEREF inertial reference systems were used to obtain the aircraft position as well as the three components of the wind velocity in combination with the true air speed, attack angle, side slip angle, and roll angle measured with the Rosemount gust probe. A detailed description of the instrumentation is provided by Murakami et al. (2003).
Dual-Doppler radar observations were made using two x-band Doppler radars of the Meteorological Research Institute and the National Research Institute for Earth Science and Disaster Prevention. These radars were positioned along the coast at an interval of 30 km. Both radars have a wavelength of 3 cm and a detection range of 64 km. Please refer to Murakami et al. (2003) for details regarding radar observations. Aircraft measurements were conducted within Region 1 in the dual Doppler radar analysis area (see Fig. 4).
In addition, radiosondes were launched every three hours at Sakata. Vertically integrated supercooled cloud water measurements using a dual-frequency microwave radiometer (Radiometrics, WVR-1100) and surface precipitation microphysics measurements were also made at Sakata.
3. Synoptic and meso-scale situations
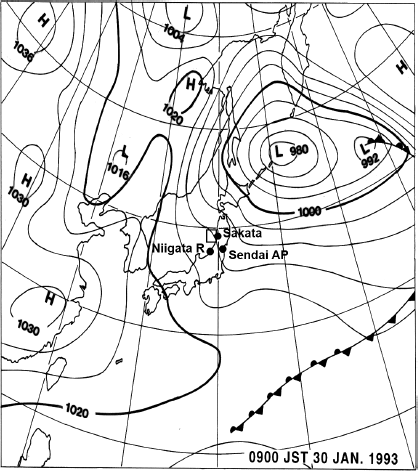
Aircraft observations of snow clouds associated with the mid-level trough were made in the daytime on January 30, 1993. Figure 1 shows the surface weather map at 0900 JST (Japan Standard Time = UTC + 9 h), three hours before the aircraft observation. A low located over the sea east of Hokkaido (at approximately 46°N/152°E) and a high over the continent (at approximately 29°N/128°E) produced a weak winter monsoon pressure pattern of west-high and east-low around the Japan Islands. As shown in the 700 hPa weather maps (Fig. 2), a developing mid-level trough with a cold airmass passed across the northern part of Japan during the daytime and was analyzed as a low over the ocean off the east coast of Japan in the surface weather map at 2100 JST on the same day. This mid-level trough existed between 700 hPa and 500 hPa levels. The visible imagery of the Geostationary Meteorological Satellite shows that this mid-level trough was accompanied by a cloud system with a horizontal scale of a few hundred kilometers (Fig. 3).


The weather radar at Niigata, operated by the Japan Meteorological Agency, showed that precipitation echoes corresponding to the cloud system passed across the southern part of the Tohoku district between 0900 JST and 1500 JST on January 30, 1993, moving from west to east at a speed of 70 km h−1. Precipitation echoes were generally stratiform. The echoes did not show any rapid development or decay and were considered in a quasi-steady state (not shown). Figure 4 shows the radar reflectivity and system relative horizontal wind that was derived through dual Doppler radar analysis at 0.3, 1.2, 2.1, and 2.7 km levels. Dual Doppler wind synthesis was performed using a method similar to Ray et al. (1980) (Yamada et al. 2010). Precipitation echoes took on a stratiform on the whole although weak band-like structures of 100 km length in the direction of NE to SW were partly embedded in them. Moreover, a rapid increase in radar reflectivity was observed below 2 km. The upper cloud moved with wind from the south relative to the lower cloud, and the clouds moved separately. The clouds shown in the southeast half of Fig. 4 represent the characteristics of the clouds observed in the first vertical cross-section measurements, and the clouds observed in the second ones have the characteristics of the clouds shown in the northwest half.
Due to the smallness of the observation area and the high speed of the echo movement, it is difficult to make measurements at several levels using the air relative pointer system in the same vertical cross-section perpendicular to the band-like structures, which move at mean wind speed. Therefore, aircraft measurements were made at different levels on a path fixed to the ground. The length of each flight leg was approximately 20–30 km. Assuming a quasi-steady state, mean vertical profiles of microphysical, thermodynamic, and kinematic variables were constructed using the measurements at several levels. Dual-Doppler radar observations were made simultaneously with the aircraft observations.
Aircraft measurements of vertical cross-sections were taken during 1240–1310 JST and 1322–1403 JST. The two measurements show a similar vertical structure of microphysical and kinematic variables although the air temperature in the layer between 700 hPa and 500 hPa decreased by 1–2 °C during aircraft observations due to the approach of the mid-level trough with cold air. The vertical distributions of microphysical, thermodynamic, and kinematic variables obtained from the second measurements provided us with a more complete data set, and they are described in Section 4. The differences in the vertical structures obtained from the two measurements, which were likely caused by the enhanced vertical circulation associated with the mid-level trough, are briefly discussed in Section 5.
4. Microstructures of stratiform snow clouds
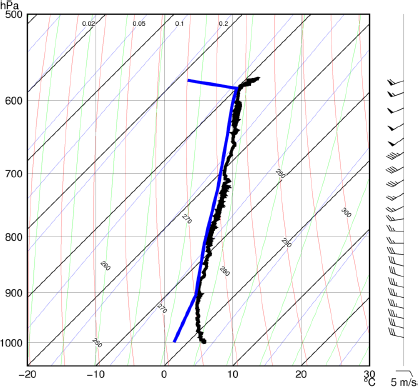
Aircraft sounding taken during 1322–1403 JST is shown in Fig. 5; the top and base heights of the clouds were 4.5 km and 0.9 km with temperatures of −29 °C and −5 °C, respectively. The air below the cloud base was considerably dry, and the difference between air temperature and dew point temperature reached 5 °C. Air temperatures near the sea surface ranged between 1 °C and 3 °C, whereas the sea surface temperatures ranged between 10 °C and 12 °C (not shown). A strong wind shear was observed between the middle and upper layers of the clouds. The horizontal winds were roughly WNW at 15 m s−1 below 2 km and WSW at 25 m s−1 above 2 km.
The vertical profile of the equivalent potential temperature Θe indicated the presence of a convectively unstable stratification below 2 km MSL and a weakly stable stratification above 2 km (Fig. 6). Furthermore, Θe showed a large amplitude of fluctuations near the cloud top and the sea surface. The fluctuations near the cloud top appear to have been caused by a large difference in Θe between just below and above the cloud top and a horizontal irregularity of cloud top heights. By contrast, the fluctuations of Θe near the sea surface were caused by thermals and evaporative cooling.

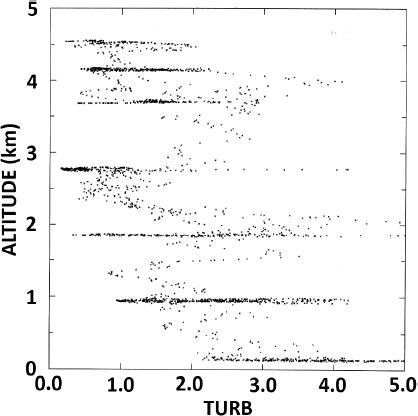
The maximum value of the one-second averaged vertical wind speed below 2 km MSL was higher compared to that above 2 km; however, this data was scattered to some extent. The updraft velocity had a peak at approximately 1 km MSL, where it exceeded 4 m s−1. The mean vertical wind speeds for each level flight are indicated using large solid dots in Fig. 7. The speed was negligibly small near the sea surface, at 2 km MSL, and at the cloud top. In contrast, it showed high speeds, on the order of 10 cm s−1 between the sea surface and 2 km MSL as well as between 2 km MSL and the cloud top. The energy extinction coefficient TURB, which is an index of turbulence strength, reflects the vertical profile of wind speeds; it was high below 2 km MSL and low above 2 km MSL (Fig. 8). TURB is a dimensionless number derived using a pitot static gust probe (MacCready 1964).

These observational results indicate the presence of a double-layer structure of the snow clouds in terms of thermodynamics and kinematics. The lower layer below 2 km MSL was formed of convective clouds and was more turbulent, whereas the upper layer was formed of stratiform clouds and was less turbulent.
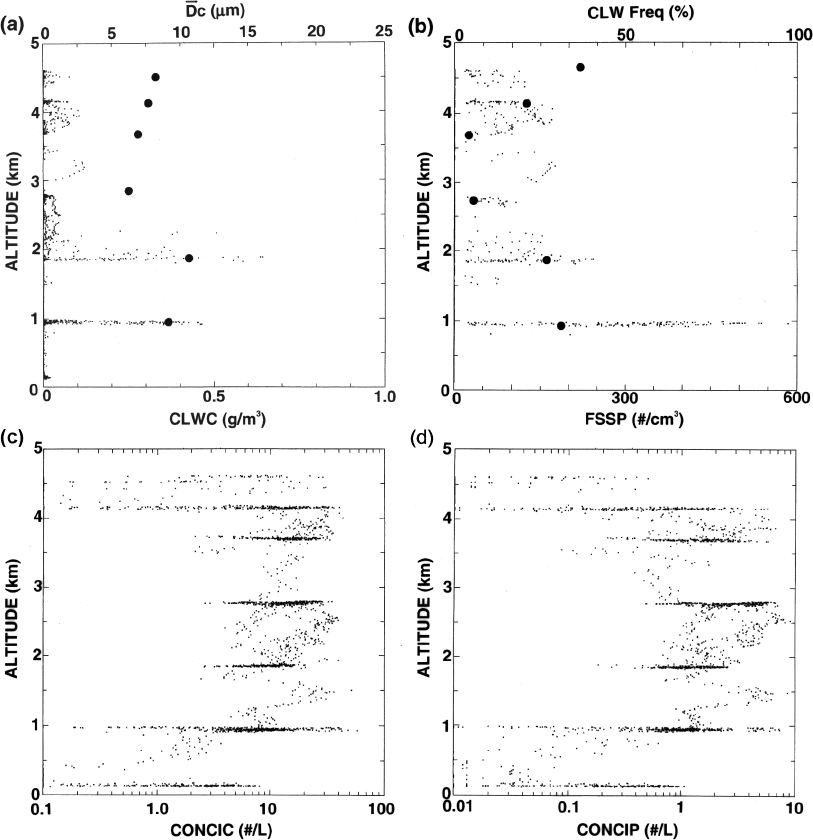
The vertical profiles of different microphysical properties are shown in Fig. 9. Cloud water content had a maximum value of 0.6 g m−3 at 2 km MSL, whereas it was less than 0.1 g m−3 above this level. The mean diameters of cloud droplets increased with height in both the upper and lower layers, reflecting their condensation and collision–coalescence growths. However, the mean diameters showed a discontinuity at approximately 2 km MSL; the mean diameters ranged from 10 μm to 12 μm in the lower layer and from 5 μm to 8 μm in the upper layer. These micro-physical trends strongly suggest that the airflows forming the upper and lower clouds are separated. Thus, the microphysical structures of the snow clouds also represent this double-layer structure.
The number concentration of cloud droplets decreased with height; it was 500–600 cm−3 near the base but less than 100 cm−3 in the upper layer. The ratio of the supercooled cloud droplet regions to the total area of the cloud was 25–30 % and 30–35 % in the lower layer and cloud top, respectively. Few supercooled cloud droplet regions were found in the middle and lower parts of the upper layer, where the number concentrations of ice crystals and snow particles were high and vertical wind velocities were considerably low.
The number concentration of ice crystals (measured with a 2D-C probe) remained almost constant in the cloud with changing altitude, and it was approximately several tens of particles L−1. However, the concentration rapidly decreased with decreasing altitude owing to sublimation/evaporation and melting of ice crystals below the cloud base. A similar decrease in the number concentration with decreasing altitude was observed for snow particles.
The number concentration of snow particles (measured using a 2D-P probe) did not change with height in the cloud and was several particles L−1; however, a low concentration of snow particles was observed immediately below the cloud top. In this layer, the snow particles did not have sufficient time to grow beyond the detection limit of the 2D-P probe (200 μm) after the initiation of ice crystals near the cloud top.
These observations about the microphysical structures can be explained using the concept of balance between the consumption of excess water vapor and cloud droplets for solid particle growth and their production resulting from updrafts as follows. Supercooled cloud droplets existed near the cloud top despite the weak updraft. This is because of the small sizes of ice and snow crystals near the cloud top, resulting in their small total surface area for consuming excess water vapor and low sweep volume for consuming supercooled cloud droplets. In contrast, below 2 km MSL, supercooled cloud droplets existed along with moderate concentrations (several tens L−1) of ice and snow crystals. This is because the production of excess water vapor and cloud droplets resulting from strong updrafts overcame the consumption of water vapor and cloud droplets by the ice and snow crystals.
5. Discussion
5.1 Effect of approaching mid-level trough
The aircraft observation revealed that the potential temperature between 3.5 km and 4.5 km decreased by 1–2 K due to the approach of the mid-level trough with cold air (Fig. 10). A considerable difference was observed in the vertical profile of supercooled cloud droplets between the first (1240–1310 JST) and second (1322–1403 JST) vertical cross-section measurements. Few supercooled cloud droplets were observed above 2 km MSL during the first vertical cross-section measurement (Fig. 11). Before the mid-level trough with cold air approached and enhanced the updraft, the stratification in the upper cloud was more stable. Moreover, updraft velocities throughout the entire cloud layer, especially in the upper cloud, were low when compared to those recorded during the second measurement. These low updraft velocities did not allow supercooled cloud droplets to survive. Vertical distributions of other variables obtained were similar in both measurements although the second measurement showed slightly stronger precipitation.
Mean size distributions, which were measured using 2D-C and 2D-P probes at heights of 4.5, 3.7, 2.8, 1.9, 1.0, and 0.15 km, are shown in Fig. 12. In the upper layer (1.9–4.5 km MSL), the number concentrations of large particles increased remarkably with decreasing height. As seen from the sample images of ice crystals and snow particles (Fig. 13), hexagonal plates, columns, and dendrites were dominant in this layer, which suggests that vapor deposition was the dominant mechanism for the growth of precipitation particles.
Size distributions at heights of 1.0 km and 1.9 km did not show any large difference although concentrations of larger particles slightly increased with decreasing height. Round-shaped, graupel-like particles were observed at 1.0 km, as seen in the 2D-C and 2D-P images. These particles appear to have grown through the accretion of cloud droplets.
The number concentrations of particles of all sizes decreased below 1.0 km. An intense sublimation/evaporation in dry air (relative humidity was approximately 70 %) below the cloud base and melting near the sea surface likely caused the decrease in particle concentrations at all sizes.
The following four observations indicate that precipitation particles generated in the upper and stratiform clouds further grew in the lower and stratocumulus clouds via the seeder-feeder mechanism.
-
(1) The vertical profiles of Θe, vertical velocity, and horizontal wind indicate that the snow clouds were made of a thermodynamically and kinematically different two-layer structure.
-
(2) The vertical profiles of 2DC and 2DP concentrations showed an almost constant concentration of precipitation particles throughout the layer and no substantial gap in the concentration between the two layers. The cloud top temperatures of the upper and lower clouds were −29 °C and −12 °C, respectively. Therefore, it was expected that the number concentration of ice crystals formed in the lower cloud would be one or more orders of magnitude smaller than that in the upper cloud based on the temperature dependence of the number concentration of ice nuclei as suggested by laboratory experiment (Meyers et al. 1992) and field observation results (DeMott et al. 2010). In addition, aircraft observation results (Cooper et al. 1986) suggest maximum concentrations of snow particles in clouds as a function of cloud top temperature. However, observation results showed that there was no substantial difference in the number concentrations of ice crystals and snow particles between the upper and lower clouds. This signifies that precipitation particles that formed in the upper cloud fell into the lower cloud. The gradual decrease in their number concentrations from 3 km to 1 km altitudes may be caused by an increase in their terminal fall velocities owing to aggregation and riming growth (the number concentrations of snow particles decrease as the fall velocity increases under the assumption of constant number fluxes of falling snow particles).
-
(3) The substantial concentrations of supercooled cloud droplets were observed in the lower cloud. The cloud base temperature (pressure) and cloud top temperature (pressure) of the lower cloud were −5 °C (910 hPa) and −12 °C (800 hPa), respectively, and the amount of adiabatic condensates near the cloud top was estimated to be approximately 1 g m−3. However, the measured amount of cloud water was less than 0.6 g m−3, which was much lower than the amount of adiabatic condensates. Additionally, many densely rimed snow particles and graupel-like particles were observed in the lower cloud. Thus, it is strongly suggested that snow particles formed in the upper cloud grew further in the lower cloud mainly through the riming process.
-
(4) The rapid increase in the radar reflectivity and a lack of significant change in particle size distributions strongly suggest that precipitation particles increased in their bulk density by accretional growth and precipitation was enhanced in the lower cloud.
6. Conclusions
In the present study, stratiform snow clouds over the Sea of Japan were investigated using an instrumented aircraft and dual Doppler radars. The snow clouds were associated with mid-level troughs and had a top height (temperature) of 4.5 km (−29 °C) and a base height (temperature) of 0.9 km (−5 °C).
The stratiform snow clouds consisted of two layers that had different thermodynamic and kinematic characteristics. The air was turbulent below 2 km MSL, reflecting its convectively unstable stratification, and the maximum updraft exceeded 4 m s−1 at approximately 1 km MSL. The convective activities produced a maximum cloud water content of 0.6 g m−3 at approximately 2 km MSL. By comparison, above 2 km, the air was less turbulent, and the maximum updraft was less than 2 m s−1. This layer was characterized by a weak updraft that was likely caused by an approaching mid-level trough. Cloud water contents were at most 0.1 g m−3, which were much less than that in the lower layer. Concentrations of ice crystals and precipitation particles, measured using 2D-C and 2D-P probes, respectively, were almost constant with height and were, respectively, several tens of particles L−1 and several particles L−1. A few exceptions were extremely low ice crystal concentrations below the cloud base and low precipitation particle concentrations near the cloud top and below the cloud base.
In the upper layer (2–4.5 km), precipitation particles grew by vapor deposition and showed a remarkable broadening of size distributions. In the layer between 0.9 km and 2 km MSL, the dominant mechanism of precipitation growth was the accretion of supercooled cloud droplets; this produced densely rimed particles like graupel. However, the change in the size distribution was not significant. Below 0.9 km MSL, particle concentrations decreased at all sizes due to sublimation and melting. These observation results indicate that precipitation particles generated in upper and stratiform clouds grew further by the seeder-feeder mechanism in lower and stratocumulus clouds.
Data Availability Statement
The aircraft observation data analyzed in this study are available from the corresponding author upon reasonable request.
Acknowledgments
This study is a part of the “Study of Precipitation Formation in Snow Clouds and Feasibility of Snow Cloud Modification by Seeding,” which was financially supported by the Science and Technology Agency of Japan. The authors acknowledge the University of Wyoming flight crew and Diamond Air Service for their support during the aircraft observation. The authors are also grateful to the then-second laboratory of the Typhoon Department of the Meteorological Research Institute for their support of radar observation. Special thanks go to the principal investigator of the project, Dr. Takayo Matsuo, for his constant support and encouragement.
References
- Asai, T., 1988: Mesoscale features of heavy snowfalls in Japan Sea coastal regions of Japan. Tenki, 35, 156–161 (in Japanese).
- Cooper, W. A., 1986: Ice initiation in natural clouds. Precipitation enhancement: A scientific challenge. Meteor. Monogr., 43, 29–32.
- DeMott, P. J., A. J. Prenni, X. Liu, S. M. Kreidenweis, M. D. Petters, C. H. Twohy, M. S. Richardson, T. Eidhammer, and D. C. Rogers, 2010: Predicting global atmospheric ice nuclei distributions and their impacts on climate. Proc. Natl. Acad. Sci. U.S.A. (PNAS), 107, 11217–11222.
- Endoh, T., K. Hozumi, and C. Magono, 1984: Formation mechanism of a notable cloud system that causes heavy snowfall and a tentative prediction of its behavior. Nat. Disaster Sci., 6, 31–42.
- Fujiyoshi, Y., N. Yoshimoto, and T. Takeda, 1998: A dual-Doppler radar study of longitudinal-mode snowbands. Part I: A three-dimensional kinematic structure of meso-γ-scale convective cloud systems within a longitudinal-mode snowband. Mon. Wea. Rev., 126, 72–91.
- MacCready, P. B., 1964: Standardization of gustiness values from aircraft. J. Appl. Meteor., 3, 439–449.
- Meteorological Research Institute, 2005: Study of precipitation mechanisms in snow clouds over the Sea of Japan and feasibility of their modification by seeding. Tech. Rep. Meteor. Res. Inst., 48, 233 pp (in Japanese). [Available at https://www.mri-jma.go.jp/Publish/Technical/DATA/VOL_48/48.pdf.]
- Meyers, M. P., P. J. DeMott, and W. R. Cotton, 1992: New primary ice-nucleation parameterizations in an explicit cloud model. J. Appl. Meteor., 31, 708–721.
- Mizuno, H., 2005: Statistics of radar echoes from snow clouds. Study of precipitation mechanisms in snow clouds over the Sea of Japan and feasibility of their modification by seeding. Tech. Rep. Meteor. Res. Inst., 48, 14–18 (in Japanese).
- Murakami, M., 2019: Inner structures of snow clouds over the Sea of Japan observed by instrumented aircraft: A review. J. Meteor. Soc. Japan, 97, 5–38.
- Murakami, M., T. Matsuo, H. Mizuno, and Y. Yamada, 1994: Mesoscale and microscale structures of snow clouds over the Sea of Japan. Part I: Evolution of microphysical structures in short-lived convective snow clouds. J. Meteor. Soc. Japan, 72, 671–694.
- Murakami, M., Y. Yamada, T. Matsuo, K. Iwanami, J. Marwitz, and G. Gordon, 1996: Mesoscale and microscale structures of shallow snow bands over the Sea of Japan. Preprints of the 12th Intl. conf. on Cloud and Precipitation, Zurich, Switzerland, 562–565.
- Murakami, M., Y. Yamada, T. Matsuo, K. Iwanami, J. D. Marwitz, and G. Gordon, 2003: The precipitation process in convective cells embedded in deep snow bands over the Sea of Japan. J. Meteor. Soc. Japan, 81, 515–531.
- Ohigashi, T., and K. Tsuboki, 2005: Structure and maintenance process of stationary double snowbands along the coastal region. J. Meteor. Soc. Japan, 83, 331–349.
- Ray, P. S., C. L. Ziegler, W. Bumgarner, and R. J. Serafin, 1980: Single- and multiple-Doppler radar observations of tornadic storms. Mon. Wea. Rev., 108, 1607–1625.
- Sakakibara, H., M. Ishihara, and Z. Yanagisawa, 1988: Classification of mesoscale snowfall systems observed in western Hokuriku during a heavy snowfall period in January 1984. J. Meteor. Soc. Japan, 66, 193–199.
- Yamada, Y., T. Matsuo, M. Murakami, H. Mizuno, and K. Iwanami, 1994: Mesoscale and microscale structures of snow clouds over the Sea of Japan. Part II: Time change in airflow structures in isolated snow clouds derived from dual-Döppler radar observations—A case study—. J. Meteor. Soc. Japan, 72, 695–708.
- Yamada, Y., M. Murakami, H. Mizuno, T. Matsuo, Y. Fujiyoshi, and K. Iwanami, 1996: Mesoscale and microscale structures of snow clouds over the Sea of Japan. Part III: Two types of circulations in snow bands associated with a wind-speed-increase zone preceding cold-air outbreaks. J. Meteor. Soc. Japan, 74, 593–615.
- Yamada, Y., M. Murakami, H. Mizuno, M. Maki, S. Nakai, and K. Iwanami, 2010: Kinematic and thermodynamical structures of longitudinal-mode snow bands over the Sea of Japan during cold-air outbreaks. Part I: Snow bands in large vertical shear environment in the band-transverse direction. J. Meteor. Soc. Japan, 88, 673–718.
- Yoshimoto, N., Y. Fujiyoshi, and T. Takeda, 2000: A dual-Doppler radar study of longitudinal-mode snowbands. Part II: Influence of the kinematics of a longitudinal-mode snowband on the development of an adjacent snowband. J. Meteor. Soc. Japan, 78, 381–403.