Article
Simultaneous Observation of Near-Inertial Frequency Gravity Waves by a Long-Duration Balloon and the PANSY Radar in the Antarctic

2024 Volume 102 Issue 6 Pages 655-664

Details
2024 Volume 102 Issue 6 Pages 655-664
Simultaneous observations using a long-duration balloon and the PANSY radar, a large-scale atmospheric radar, were performed at Syowa Station in the Antarctic, from January to February 2022. They captured near-inertial frequency gravity waves (NIGWs) in the lower stratosphere. The analysis using both datasets and the latest reanalysis ERA5 revealed that two NIGW packets with an upward group velocity and short vertical wavelengths of less than 3 km propagated northeastward and eastward above Syowa Station. Although the NIGWs over Syowa Station were qualitatively represented by ERA5, their amplitudes were underestimated. In addition, the latter NIGW packet was observed by the long-duration balloon, but not represented by ERA5. It could be because the vertical wavelength of NIGW became shorter than the lower limit of vertical wavelength explicitly represented in ERA5 by entering the high static stability region around the balloon, or due to explicit and implicit diffusion and/or misrepresentation of the position of the NIGW packet in the model. This result implies the difficulty to explicitly represent the behavior of NIGWs with short vertical wavelengths even in the high-resolution simulation.
In recent years, the horizontal and vertical resolution of operational analysis and reanalysis data has been increasing year by year, and it has become to resolve some gravity waves. The spatial distribution of gravity wave activity in these data is qualitatively consistent with both satellite and balloon observations (Hoffmann et al. 2017; Jewtoukoff et al. 2015). The importance of these data in gravity wave research is increasing. On the other hand, it has been reported that the amplitude and momentum flux of gravity waves in these data are underestimated compared to observations (Hoffmann et al. 2017; Jewtoukoff et al. 2015; Wicker et al. 2023).
The long-duration balloon (i.e., super-pressure balloon) has attracted attention as a means of observing gravity waves because it can resolve the entire frequency band of gravity waves and estimate their momentum flux (Alexander et al. 2010; Baldwin et al. 2019). The Vorcore/Concordiasi campaign, which was the long-duration balloon observations performed in 2005/2010 over Antarctica (Hertzog et al. 2007; Rabier et al. 2010), observed the horizontal distribution of momentum flux due to gravity waves and revealed that a small percentage of large-amplitude gravity waves are responsible for the large part of momentum transport (i.e., intermittency) (Hertzog et al. 2008, 2012).
The PANSY radar, installed at Syowa Station in the Antarctic one year after the Concordiasi campaign, can resolve gravity waves in the entire frequency band and estimate their momentum flux (Sato et al. 2014), as well as the long-duration balloon. The PANSY radar started continuous observations in the troposphere and lower stratosphere since 2012 and revealed many facts, including the dominance of near-inertial frequency gravity waves (NIGWs), the generation of gravity waves with downward group velocity by the polar-night jet, that by spontaneous adjustment associated with the tropopause jet, and the difference in intermittency of gravity waves between the troposphere and stratosphere (Shibuya et al. 2015; Minamihara et al. 2016, 2018, 2020).
On the other hand, these two instruments, which can resolve the entire frequency band of gravity waves and estimate their momentum flux, have never been used in conjunction, not only in the Antarctic but also in any other regions. Therefore, we established the LOng-Duration balloon Experiment of gravity WAVE over Antarctica (LODEWAVE) project to collaboratively observe gravity waves in the Antarctic region using the long-duration balloon and PANSY radar (Tomikawa et al. 2023). We performed the first campaign observation using the long-duration balloon in January and February 2022 at Syowa Station, Antarctica. It successfully captured NIGWs simultaneously by the long-duration balloon and PANSY radar in the lower stratosphere at an altitude of 18–19 km. In this paper, the characteristics of the captured NIGWs are clarified and compared with the latest reanalysis ERA5.
The paper is organized as follows. The data used in this study are described in Section 2. Section 3 gives details of the NIGWs observed by the long-duration balloon and PANSY radar. Section 4 discusses why the NIGWs observed by the LODEWAVE balloon were not represented in ERA5. Section 5 gives the conclusion.
Figure 1 shows the overall configuration of LODEWAVE observation system. The fully inflated super-pressure balloon (model: NPB02) used for this observation has a volume of 183 m3, a height of 4.8 m, and a width of 8.1 m. To prevent the helium gas filled inside the balloon from leaking and to ensure a long duration flight, the super-pressure balloon has a double-layer structure with a polyethylene balloon on the outside and a rubber balloon on the inside (Saito et al. 2020). Furthermore, by covering the balloon with a diamond-shaped net, high pressure resistance is achieved to withstand diurnal changes of differential pressure (Saito et al. 2014, 2021, 2023a). The observation instrument is equipped with a temperature sensor, three pressure sensors, and a GPS sensor to measure atmospheric temperature, pressure, and horizontal winds at the balloon’s position every 30 seconds, respectively (Tomikawa et al. 2023). The measured data is transmitted to the ground every 7.5 minutes via Iridium SBD (short burst data) (Kaho et al. 2022). The balloon’s flight altitude was assumed to be 18–19 km (65–70 hPa), within the altitude range observable by the PANSY radar and with a low possibility of encountering other flying objects. The performed three flights are referred to as LODEWAVE 3, 2, and 1 in the order they were conducted (i.e., note that the numbers and the order are reversed) (Saito et al. 2023b).

Overall configuration of LODEWAVE observation system.
The PANSY radar is a mesosphere–stratosphere–troposphere (MST) radar installed at Syowa Station (69.0°S, 39.6°E) in 2011. It can observe three-dimensional winds in the troposphere and lower stratosphere with high temporal and vertical resolutions (Sato et al. 2014). Five beams are used in PANSY radar observations, which are pointing to the vertical and to the north, east, south, and west at the same zenith angle of 10°. Vertical winds are estimated directly from the vertical beam, and zonal and meridional winds are obtained from the line-of-sight velocity of the east–west and north–south beams, respectively. The accuracy of wind velocity is approximately 0.1 m s−1 for vertical winds and 0.5 m s−1 for zonal and meridional winds. The range resolution along the beam direction is 150 m. The original time resolution of tropospheric and stratospheric observations is approximately 200 s. In this study, we used 3-dimensional winds estimated from echo spectra incoherently integrated over 30 min since the 30-min integrated data can extend the upper limit of the observation altitude range by 3–5 km.
2.3 ERA5 reanalysisERA5 is the latest atmospheric reanalysis dataset provided by the European Centre for Medium-Range Weather Forecasts (ECMWF) (Hersbach et al. 2020). Hourly data are provided on 137 model levels vertically from the surface up to the pressure level of 0.01 hPa (∼ 80 km altitude). The altitude interval in the lower stratosphere (from 15 km to 20 km), which was the focus of this study, is 300–400 m. The latitude and longitude mesh is 0.25° × 0.25°. For comparison with the LODEWAVE data, the ERA5 data were linearly (i.e., linearly in the log pressure in the vertical) interpolated onto the balloon’s position and time. Data from the grid point (69.0°S, 39.5°E) closest to Syowa Station were used for comparison with the PANSY radar data.
Three LODEWAVE balloons were launched at Syowa Station in January and February 2022. Their trajectories and altitudes are shown in Fig. 2. The launch dates of LODEWAVE 1, 2, and 3 were February 6, February 4, and January 6, respectively. Their flight duration was 1–3 days. The altitude of LODEWAVE 3 temporarily descended on January 8 because the LODEWAVE 3 balloon was in a zero-pressure state due to the decrease in internal helium gas and solar radiation. It then returned to a super-pressure state again as solar radiation increased, but began to descend again as solar radiation decreased, finally descending to the Antarctic continent (Saito et al. 2023b). In this paper, we used data from LODEWAVE 3, which had the longest flight duration and captured the NIGWs.

(a) Trajectories and (b) time variations of altitude of LODEWAVE 1, 2, and 3. The bottom axis in (b) represents the elapsed day since the date of balloon launch.
The flight trajectory of LODEWAVE 3 (Fig. 2a) shows a counterclockwise trochoidal motion with an eastward drift. This suggests that the counterclockwise rotation is superimposed on the background westerly wind. Figure 3 shows the time variations of zonal and meridional winds observed by LODEWAVE 3. Only data above 18.2 km altitude, which was under the super-pressure state, are plotted. Both zonal and meridional winds oscillate with an amplitude of about 4 m s−1 to 5 m s−1 and a period of 10–12 hours throughout almost the entire period. The phase of the zonal wind preceded that of the meridional wind by about 90 degrees, resulting in a counterclockwise rotational motion. Such trochoidal flight trajectory has been observed in past long-duration balloon observations and is thought to be due to NIGWs or inertial oscillations (Hertzog et al. 2002; Conway et al. 2019).

Time variations of (black) zonal and (red) meridional winds along trajectories of LODEWAVE 3. Solid and dashed lines represent LODEWAVE and ERA5 data, respectively.
Figure 4 shows the time variations of zonal and meridional winds obtained by LODEWAVE 3 and PANSY radar at an altitude of 18.5 km. It is found that the amplitude and phase of the oscillation of both winds are in good agreement between LODEWAVE 3 and PANSY radar from 15:00 UT on January 6 to 03:00 UT on January 7, during which the oscillation period is 9–11 hours. After that, although both of zonal and meridional winds from LODEWAVE 3 and PANSY radar exhibit similar oscillations, the phase rotation of wind fluctuations from the PANSY radar is faster in time, resulting in a wave period of 8–10 hours for the PANSY radar wind oscillation and that of 10–12 hours for the LODEWAVE 3 one. LODEWAVE 3 was located at 69.9°S and 44.9°E, about 230 km away from Syowa Station, at 03:00 UT on January 7.

Same as Fig. 3 except that dashed lines represent the PANSY radar data at an altitude of 18.5 km.
Next, we compared LODEWAVE 3 and PANSY radar observations, and reanalysis ERA5. Dashed lines in Fig. 3 show the time variations of zonal and meridional winds of ERA5 interpolated onto the time and position of the LODEWAVE 3 balloon. Compared with LODEWAVE 3, the amplitude of the oscillation for ERA5 is about half of that, although they are nearly in phase from 15:00 UT on January 6 to 00:00 UT on January 7. After that, the phase of the oscillation in ERA5 slightly precedes that of LODEWAVE 3 until 12:00 UT on January 7, but thereafter ERA5 hardly reproduces the oscillation observed by LODEWAVE 3.
Figure 5 shows the time-height sections of zonal and meridional winds from the PANSY radar and ERA5. All the figures captured oscillations whose phase descends with time. The vertical wavelength of the oscillations estimated for the PANSY radar observations before 03:00 UT on January 7 is about 2.4 km (i.e., positive peaks are around 15.2 km and 17.6 km at 00:00 UT on January 7 in Fig. 5a). During the same period, the ERA5 shows the oscillations with a similar vertical wavelength, but their amplitude was about half that of PANSY radar observation. On the other hand, the vertical wavelength of the oscillation observed by the PANSY radar around 00:00 UT on January 8 is about 2.8 km (i.e., positive peaks are around 16.8 km and 19.6 km at 00:00 UT on January 8 in Fig. 5b). The oscillations seen in ERA5 during the same period also had a vertical wavelength similar to that of the PANSY radar observation, but their amplitude is about half that of the PANSY radar observation.

Time-height sections of (a, c) zonal and (b, d) meridional winds from (a, b) the PANSY radar and (c, d) ERA5.
To clarify the characteristics of the observed oscillation, a hodograph is drawn using the (unfiltered) PANSY radar data in Fig. 6a. Although the direction of major axis of the hodograph changes with time, it always shows a counterclockwise rotation with altitude. This suggests that the observed oscillations were inertia-gravity waves with an upward group velocity, but the direction of their horizontal wavenumber vector is not clearly determined. Although the wave period close to 12 hours reminds us of a semidiurnal tide, the short vertical wavelength of the observed oscillations negates that possibility.

Hodographs (a) with height obtained by the PANSY radar and (b) with time at an altitude of about 18.5 km obtained by LODEWAVE 3. LODEWAVE 3 data are filtered by a lowpass filter with a cutoff period of 6 hours. Solid circles represent initial (a) height and (b) time.
A hodograph with time obtained by LODEWAVE 3 is also shown in Fig. 6b. A lowpass filter with a cutoff period of 6 hours is applied to LODEWAVE 3 data to remove the short-period fluctuations. A linear wave theory indicates that inertia-gravity waves in the southern hemisphere show a counterclockwise rotation with time in the hodograph regardless of the direction of the vertical group velocity. This is actually the case. On the other hand, the shape of the hodograph is longer in the meridional direction before 06:00 UT on January 7, but becomes almost circular after that. Thus, it is inferred that the propagation direction of inertia-gravity waves varied during the observation period.
Next, polar projection maps of zonal winds at an altitude of about 18.4 km obtained from ERA5 are shown in Fig. 7. A bandpass filter with a cutoff wave period of 6–24 hours is applied to the data to extract the NIGWs. Red and blue solid lines in Fig. 7 indicate positive and negative phases of the zonal wind anomalies around Syowa Station, respectively. A negative zonal wind anomaly over Syowa Station at 15:00 UT on January 6 (Fig. 7a) was spread from northwest to southeast and moved northeastward with time as shown by blue solid lines (Figs. 7b, c). Its horizontal wavelength is estimated to be about 1000 km. On the other hand, a negative zonal wind anomaly over Syowa Station at 00:00 UT on January 8 (Fig. 7e) moved eastward with time (Figs. 7f, g). Since the areas of positive and negative anomalies over Syowa Station extend about 1000 km in the zonal direction in Figs. 7f and 7h, respectively, its horizontal wavelength is estimated to be about 2000 km. Therefore, the near-inertial frequency oscillations over Syowa Station observed by the PANSY radar from January 6 to 8 were probably caused by two inertia-gravity wave packets with different horizontal wavelengths and different propagation directions.

Polar projection maps of zonal wind, which is filtered by a bandpass filter with cutoff periods of 6 hours and 24 hours, at an approximate altitude of 18.4 km from ERA5 (a–d) from 15:00 UT on January 6 to 00:00 UT on January 7 and (e–h) from 00:00 UT to 09:00 UT on January 8, 2022. Black and red stars denote Syowa Station and LODEWAVE 3, respectively. Red and blue solid lines indicate positive and negative phases of the zonal wind anomalies around Syowa Station, respectively.
The results of Section 3 suggest that the simultaneous observation using the long-duration balloon and PANSY radar captured the same wave packet of NIGWs until 03:00 UT on January 7. On the other hand, while the NIGWs observed over Syowa Station after 12:00 UT on January 7 did not appear to reach the position of LODEWAVE 3 in the ERA5 data, the LODEWAVE 3 data captured near-inertial frequency oscillations. In this section, we discuss why the latter NIGW packet represented by ERA5 near Syowa Station was no longer represented by ERA5 at the position of LODEWAVE 3.
Figure 8 shows the longitude-time section of ERA5 zonal wind at an approximate altitude of 18.4 km and the time variation of LODEWAVE 3 zonal wind. The ERA5 zonal wind disturbance at the longitude of LODEWAVE 3 (solid black line in the left panel of Fig. 8) after 03:00 UT on January 7 is not consistent with that of LODEWAVE 3 as shown in Fig. 3. However, it would be in good agreement with the phase of LODEWAVE 3 zonal wind when the positive and negative phases of ERA5 zonal wind were extended eastward. Therefore, it is considered that the real NIGWs had a large amplitude up to the longitude region where LODEWAVE 3 was located, but it was not represented in ERA5.

(Left) longitude-time section of zonal wind at 69.0°S and an approximate altitude of 18.4 km from ERA5 and (right) time variation of zonal wind obtained by LODEWAVE 3. Solid and dashed lines in the left panel represent the longitudes of LODEWAVE 3 and Syowa Station (39.6°E), respectively.
Figure 9 shows the filtered Brunt-Väisälä frequency squared and zonal wind in the same section as the left panel of Fig. 8. The Brunt-Väisälä frequency squared and zonal wind are filtered by a lowpass filter with a cutoff period of 24 hours and a bandpass filter with a cutoff period of 6–24 hours, respectively. It can be seen that the zonal wind anomaly over Syowa Station is extended eastward and does not enter the region where the Brunt-Väisälä frequency squared exceeds about 4.5 × 10⁻⁴ s−2. The dispersion relation for hydrostatic inertia-gravity waves with vertical wavelengths sufficiently shorter than the scale height is given by
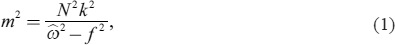 |
(e.g., Fritts and Alexander 2003) where k and m are the horizontal and vertical wavenumbers, respectively, and N, f, and  are Brunt-Väisälä, inertial, and intrinsic frequencies, respectively. From Eq. (1), it is considered that the vertical wavelength is shorter in the region with large Brunt-Väisälä frequency. In general, the wavelength of gravity waves that can be resolved by the model is about 6–8 times the grid spacing, both horizontally and vertically (Skamarock 2004; Skamarock et al. 2019; Klaver et al. 2020). Since the vertical spacing in the lower stratosphere of the model used in ERA5 is 300–400 m, the NIGWs with vertical wavelengths of 2.8 km over Syowa Station was probably near the limit of what could be resolved in ERA5. Since the Brunt-Väisälä frequency squared increased from 4.3 × 10⁻⁴ s−2 over Syowa Station to 4.5 × 10⁻⁴ s−2, the decrease of vertical wavelength is only about 100 m. However, it cannot be ruled out that the shortening of the vertical wavelength in the high Brunt-Väisälä frequency region may have prevented this inertia-gravity wave from being represented explicitly in ERA5. In addition, explicit and implicit diffusion in the model may have caused NIGWs with short vertical wavelengths to decay faster than in the real atmosphere (Polichtchouk et al. 2023). Another possibility, although difficult to verify with the present data because of no observation in the vertical at the balloon’s position, is that the coarse vertical resolution overestimates the vertical wavelength of the NIGW (cf. Yoshida et al. manuscript in revision), resulting in a faster upward group velocity of the NIGW and propagation of the wave packet above the balloon altitude.

Filtered Brunt-Väisälä frequency squared (colors) and zonal wind (contours) from ERA5 in the same section as the left panel of Fig. 8. Brunt-Väisälä frequency squared and zonal wind are filtered by a lowpass filter with a cutoff period of 24 hours and a bandpass filter with a cutoff period of 6–24 hours, respectively. Contour intervals are 1 m s−1. Contour of 0 m s−1 is omitted. Negative values are dashed.
It should also be noted about the effect of data assimilation. Although the PANSY radar data was not assimilated into ERA5, radiosonde data twice a day at Syowa Station were assimilated. Therefore, it is possible that the NIGWs were reproduced only over Syowa Station due to data assimilation. On the other hand, Yamashita et al. (2010) compared satellite observations to operational analysis data with approximately the same resolution and data assimilation system as ERA5 and reported that the effect of data assimilation on gravity waves was small. In addition, since this inertia-gravity wave packet has already appeared upstream (i.e., west) of Syowa Station (Fig. 8), it is unlikely that this inertia-gravity wave is reproduced by the data assimilation.
The first campaign observation of the LODEWAVE project, which aims to observe gravity waves in the Antarctic region using long-duration balloons, was performed at Syowa Station from January to February 2022. Three balloons were launched and one of them captured NIGWs at an altitude of around 18.5 km. Simultaneous PANSY radar observations also captured the same NIGW packets. Analysis of the NIGWs using LODEWAVE and PANSY radar observations, and the latest reanalysis ERA5 datasets revealed that the two different NIGW packets with an upward group velocity and vertical wavelengths of 2.4 km and 2.8 km passed over Syowa Station and propagated northeastward and eastward, respectively, during the observation period.
Comparison of the LODEWAVE and PANSY radar data with ERA5 showed that although ERA5 was able to represent the NIGWs over Syowa Station qualitatively, it underestimated their amplitudes. In addition, ERA5 could not capture the latter NIGW packet at the position of LODEWAVE balloon. It could be because its vertical wavelength became shorter in the high Brunt-Väisälä frequency region and was below the lower limit of vertical wavelengths that can be represented by ERA5, or due to explicit and implicit diffusion and/or misrepresentation of the position of the NIGW packet in the model.
In recent years, the range of resolved gravity waves has expanded as models have become higher resolution. Although it is expected that this will avoid problems associated with gravity wave drag parameterization (Plougonven et al. 2020), this study showed that even the vertical resolution of the latest reanalysis ERA5 is not always enough to explicitly represent NIGWs with short vertical wavelengths and their propagation in this observed event. Although such NIGWs are generally observed near their critical level, an infinitesimal vertical resolution is theoretically required to explicitly represent them near the critical level (Wicker et al. 2023). In the real atmosphere, some kind of damping process will eliminate the need to resolve scales smaller than a certain vertical scale, but its scale has not yet been clarified by observations. In other words, even if much higher vertical resolution is achieved in the future, it will not be easy to explicitly represent the dissipation and momentum deposition of gravity waves near the critical level. It will cause the momentum deposition and drive the meridional circulation at a different place from the real atmosphere. Therefore, both gravity wave drag parameterization and explicit representation of gravity waves will continue to be required.
The LODEWAVE data are available from the corresponding author on reasonable request. The PANSY radar data are available from https://pansy-data.nipr.ac.jp/pansyda/home (accessed on February 14, 2024) upon request. The ERA5 reanalysis data on model levels were provided by the European Centre for Medium-range Weather Forecasts and were available at the Climate Data Store. It is not available now because of the migration of CDS to a new infrastructure (accessed on March 1, 2024).
The LODEWAVE and PANSY radar observations at Syowa Station were conducted by the 63rd Japanese Antarctic Research Expedition (JARE63). It was supported by National Institute of Polar Research under MEXT. This work was supported by JSPS KAKENHI Grant Number 18H01276 and 21H01160. Figures were drawn using Dennou Club Library (DCL).