Abstract
We are conducting a 5-km long-term atmospheric regional reanalysis for Japan with assimilating conventional observations (RRJ-Conv). RRJ-Conv is produced with a one-way double-nesting system consisting of a nonhydrostatic regional model and a local ensemble transform Kalman filter (LETKF), which is driven by the Japanese 55-year reanalysis (JRA-55). The assimilated data are limited to long-term available data, specifically surface in-situ pressure observations, upper-air radiosonde observations, and tropical cyclone center positions.
This paper overviews the performance of RRJ-Conv for 20 years from July 2001 to June 2021, mainly focusing on precipitation and exploring added values to JRA-55. RRJ-Conv is confirmed to maintain long-term consistency of analysis quality. Compared to JRA-55, RRJ-Conv reduces biases in central pressures of tropical cyclones, maintaining position reproducibility. RRJ-Conv represents detailed spatial distributions of monthly precipitation, extreme values for daily precipitation, and their interannual variation more realistically than JRA-55. The improvements to JRA-55 are demonstrated for some extreme events, involving a tropical cyclone, Baiu front and East Asian winter monsoon.
1. Introduction
More than a half century has passed since operational radiosonde upper air observations, in addition to surface in-situ observations, started to cover the globe. Moreover, numerical weather prediction (NWP) systems, including physical-based forecasting models and data assimilation schemes, have gradually and greatly developed for decades, supported by advances in computing technology (Bauer et al. 2015; Benjamin et al. 2018). By utilizing both stored observations and state-of-the-art NWP systems, some NWP centers produce long-term global atmospheric reanalyses (e.g., Kalnay et al. 1996). The Japan Meteorological Agency (JMA), which has produced the Japanese 25-year Reanalysis (JRA-25: Onogi et al. 2007) and the Japanese 55-year Reanalysis, (JRA-55: Kobayashi et al. 2015), is one of these centers. Global reanalyses have greatly contributed to various fields. As proposed by Trenberth and Olson (1988), and Bengtsson and Shukla (1988) the reanalyses are essential for studying and monitoring natural variability and climate change. They are used in developing new NWP systems and postprocesses for routine weather prediction (e.g., Hamill et al. 2006). In addition, there are a number of users of the reanalyses in a wide range of fields, such as agriculture and energy (Gregow et al. 2016). Recently, reanlayses have started to be used for training data-driven weather forecasting models (e.g., Pathak et al. 2022). However, even in the latest global reanalyses, such as the fifth generation of the European Centre for Medium-Range Weather Forecasts atmospheric reanalysis (ERA5, Hersbach et al. 2020), the resolutions are limited to a grid spacing of 30 km or more. These resolutions are insufficient for capturing mesoscale phenomena and complex terrain effects.
Dynamical downscaling is widely applied to solve the resolution problem in global reanalyses. It estimates higher-resolution atmospheric fields with physical consistency, using high-resolution regional models driven by lower-resolution data, such as global reanalyses. However, downscaled fields, even at the synoptic scale, often depart from the lower-resolution driving data, as the integration time is long. At the same time, limiting the integration time does not allow the model to sufficiently spin up fine-scale structures, affecting estimates of precipitation and clouds.
Regional reanalysis addresses the problems in dynamical downscaling by assimilating observations within the regional domain, in addition to using a highresolution model. Recently, several long-term regional reanalysis datasets covering North America (Mesinger et al. 2006), Europe (Bollmeyer et al. 2014; Dahlgren et al. 2016; Jermey and Renshaw 2016), the Arctic (Bromwich et al. 2016), Australia (Su et al. 2019), South Asia (Rani et al. 2021), and East Asia (Yang et al. 2022; Yin et al. 2023) have been generated.
To detect long-term variations from a reanalysis, it is favorable to limit the assimilated observations to the conventional observations that are available throughout the reanalysis period (Kobayashi et al. 2014). Limiting observations may degrade the analyses in the period when other abundant observations, such as satellite observations, are available. However, it keeps the analysis quality consistent over a long period, free from the history of observing system advances. Most of the existing regional reanalyses use satellite observations. There is still no long-term regional reanalysis without assimilating satellite observations covering Japan, where various mesoscale extreme events are accompanied by disturbances, such as tropical cyclones (TCs), the Baiu front and cold-air outbreaks, and are affected by complex terrain.
We developed a 5-km grid long-term regional reanalysis system for Japan with assimilating conventional observations. Fukui et al. (2018) demonstrated the feasibility of regional reanalysis, which assimilates only surface pressure and radiosonde observations and can moderate the above-mentioned problems in dynamical downscaling. They have suggested that regional reanalysis improves the spatiotemporal variation of precipitation compared to downscaling with long model integration and reduces the underestimation of precipitation in downscaling with short model integeration. They have also shown that regional reanalysis can better represent heavy precipitation and topographic effects than can global coarser reanalysis. These results motivate us to produce regional reanalysis data covering several decades to provide climatological mean states and seasonal and interannual variations, as well as past mesoscale extreme events.
The purpose of this study is to conduct a long-term 5-km grid regional reanalysis for Japan with assimilating conventional observations (RRJ-Conv) and to evaluate its performance for the period of 20 years from July 2001 to June 2021 by exploring added values to the driving data of JRA-55. Our main focus is on precipitation. Accurate precipitation estimates are helpful for various applications, such as disaster prevention and water resource management. High-resolution systems, such as RRJ-Conv, are necessary for representing extreme precipitation events caused by mesoscale systems and influenced by complex terrain. Precipitation observations, which are not assimilated in RRJ-Conv, are suitable for evaluating the performance of RRJ-Conv.
The remainder of this paper is organized as follows. In Section 2, we describe the design of the system for RRJ-Conv. The performance of RRJ-Conv is overviewed in terms of synoptic-scale fields and TCs in Section 3. We also evaluate RRJ-Conv, focusing on precipitation, including extreme events over Japan, in Section 4. Conclusions are summarized in Section 5.
2. Regional reanalysis system
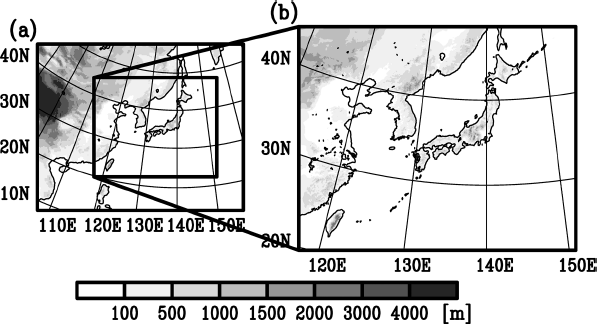
RRJ-Conv is conducted through sequential data assimilation cycles. The system for RRJ-Conv is based on that of Fukui et al. (2018). It is designed to be nested in JRA-55. Employing a one-way double-nesting approach, the outer and inner systems cover East Asia with a grid spacing of 25 km and Japan with a grid spacing of 5 km, respectively (Fig. 1). The time-integration model is JMA nonhydrostatic model (NHM: Saito et al. 2007), which was used for operational regional NWP for Japan at JMA until 2017. The data assimilation scheme is a local ensemble transform Kalman filter (LETKF: Hunt et al. 2007), which is a kind of ensemble Kalman filter (EnKF). The assimilated data are limited to conventional observations, specifically surface in-situ pressure observations, upper-air radiosonde observations, and TC center positions. These data cover more than 60 years. Limiting the assimilated data to conventional observations keeps the reanalysis quality stable over the long term, which is favorable for extracting climate change signals.
To produce a long-term reanalysis dataset, RRJ-Conv is split into streams. Each stream covers one year from July to June of the following year. To spin up mesoscale variability from coarser initial fields, at least 12 hours are needed (Skamarock 2004). In addition, adjusting the perturbations in the outer system requires approximately one week. To have sufficient time for these adjustments, the reanalysis streams are initialized at 12 UTC on 20 June for the 25-km outer reanalysis and at 12 UTC on 29 June for the 5-km inner reanalysis. More details of the time-integration model, data assimilation scheme, assimilated data for RRJ-Conv and evaluation method are described in the following subsections.
2.1 Time-integration model
The time integration, providing first-guess fields and their error covariances for LETKF and precipitation estimation, is performed by using the NHM initialized at the analysis field in the previous cycle without initialization procedure. Both the inner and outer NHMs include the following schemes to represent physical processes. To represent cloud microphysics, a bulk model is employed, prognosing the mixing ratios of cloud water, rain, cloud ice, snow and graupel and the number concentrations of cloud ice, snow and graupel (Ikawa and Saito 1991). Cumulus convections are parameterized with the Kain and Fritsch scheme (Kain 2004). Subgrid-scale turbulence is treated with the Mellor-Yamada-Nakanishi-Niino Level-3 scheme (MYNN3: Nakanishi and Niino 2006). Radiation processes are represented by schemes for clear skies (Yabu et al. 2005) and clouds (Kitagawa 2000). The cloud amount for radiation is diagnosed from subgrid-scale variances estimated with MYNN3 to consider partial condensation (Sommeria and Deardorff 1977). Surface fluxes are estimated by using a bulk method with the coefficients proposed by Beljaars and Holtslag (1991). Land surface processes are treated with a simple slab model consisting of 4 layers to estimate soil temperature with heat conduction equations and 3 layers to estimate soil moisture with the force-restore method.
The model top is set at a height of 22 km with 50 vertical layers in the terrain-following hybrid coordinate system. The 25-km outer model is constrained by global driving data via its lateral boundary conditions and the spectral nudging (von Storch et al. 2000). The nudged components are horizontal wind and potential temperature fields longer than 1200 km in wavelength above a height of 2000 m with a weight of 0.05. In the 5-km inner model, the spectral nudging is not applied. For the lower boundary conditions, the sea surface temperature (SST) is obtained from COBE-SST (Ishii et al. 2005). The model topography is based on Global 30 Arc-Second Elevation data (GTOPO30: Gesch et al. 1999). The surface properties reflect the land uses and coverages of snow and sea ice. The land uses across Japan are determined from the land-use product of the Geospatial Information Authority of Japan. They are updated in 2007, 2011 and 2014, by considering the land-use product versions. Those over the other countries are fixed for the entire period, given from Global Land Cover Characterization from the U.S. Geological Survey, the University of Nebraska-Lincoln and the Joint Research Centre of the European Commission (GLCC: Loveland et al. 2000). The coverages of snow and sea ice are interpolated from JRA-55. Concentrations of greenhouse gases, specifically CO2, CH4, N2O, CFC-11, CFC-12 and HCFC-22, are updated annually, using the same data given in JRA-55.
2.2 Data assimilation
To assimilate observations, we employ LETKF. The forecast error covariances are estimated from the 30 perturbed runs. The first-guess fields are from the single control runs, instead of the ensemble mean of the perturbed runs as in the original LETKF. The ensemble mean fields can be too smooth for the first-guess fields. For example, TCs tend to be shallower and wider in ensemble mean fields, reflecting the differences in TC positions among ensemble members. This modification avoids this problem (Fukui et al. 2018).
Perturbations are given for the initial and lateral boundary conditions. Lateral boundary perturbations play an important role in spreading the ensemble members and reflecting uncertainties in the first-guess fields because long-term simulations with regional models depend on lateral boundary conditions rather than initial conditions. For the 25-km outer perturbed runs, the initial conditions are obtained from the JRA-55 fields on the same date but in different years. The lateral boundary conditions are plus and minus of 15 leading empirical orthogonal function modes of the JRA-55 climatological anomalies over the domain. For the 5-km inner perturbed runs, the initial and lateral boundary conditions are given from the 25-km outer perturbed reanalyses.
The longitudinal and latitudinal TC center positions are directly assimilated in RRJ-Conv. The direct assimilation method, which is easily applied to ensemble Kalman filters, corrects first-guess fields with relatively little disturbance to the dynamical balance (Kunii 2015). The TC center positions in the guess fields are detected as the minimal points around the observed TCs in the mean sea level pressure (MSLP) fields. Considering the difficulty in searching for TC centers with a simple method, the assimilation of TC center positions is performed only for TCs over the sea in both observations and first-guess fields.
The analysis is obtained at the end of 6-hour assimilation window with hourly slots by applying the 4D-EnKF approach. The localization to reduce sampling errors is set in the observation space. The localization scales are set to 200 km in the horizontal direction and 0.4 ln p in the vertical direction for assimilating surface pressure and upper-air observations. For assimilating TC center positions, the horizontal localization scale is set to 400 km and the vertical localization is not set, in considering the TC structure. To avoid filter divergence, the relaxation to prior perturbation method (Zhang et al. 2004) is applied with a relaxation factor of 0.9. The analyzed variables in the LETKF are three-dimensional wind components, temperature, surface pressure and mixing ratios of water species. They are used as initial conditions for the time integration with NHM in the next cycle.
2.3 Assimilated data
The assimilated data in RRJ-Conv are surface in-situ pressure observations, upper-air radiosonde observations, and TC center positions. The surface in-situ pressure observations are data reported from surface land and sea stations and buoys. The radiosonde observations include upper-air zonal and meridional winds, temperature and relative humidity. The TC center position data in terms of latitude and longitude are from the JMA’s best track data. Figure 2 shows the time series of the numbers of assimilated observations passing quality control processes. The numbers are different for the reanalyses at 00 UTC and 12 UTC and at 06 UTC and 18 UTC because the upper-air observations with radiosondes are generally operated every 12 hours. From the viewpoint of a longer time scale, the numbers are stable for the period of 20 years from July 2001 to June 2021.
2.4 Data for evaluation
This section describes the data used for the evaluation of RRJ-Conv. To check the stability and reproducibility of the reanalyses in RRJ-Conv regarding the synoptic-scale fields, we compared RRJ-Conv to JRA-55. In addition, the JMA’s best track data were used to validate TC positions and central pressures in RRJ-Conv. Approximately half of the heavy precipitation events in Japan are associated with TCs (Tsuguti and Kato 2014). Therefore, realistic analysis of TCs is critical for precipitation estimates in RRJ-Conv. Regarding precipitation, we used the JMA’s raingauge observations, which cover the Japanese islands. The sites of the raingauges that we used are shown in Fig. 3. The total number was 711. Note that we excluded the raingauge observations for which the number of the days with missing values in the hourly records was more than 20 % in a month. The JMA’s radar-based precipitation data calibrated with raingauge observations (radar/raingauge-analyzed precipitation data: Nagata 2011) are used only for extreme precipitation cases. This is because the radar-based data capture fine precipitation distributions in space with high accuracy by using both radar and raingauge observations, while they are largely influenced by updates of the radar observing network and estimation algorithm.

3. Synoptic-scale fields
3.1 MSLP
Figure 4 shows the root mean square differences (RMSDs) and biases of RRJ-Conv against JRA-55 for 6-hourly instant fields of MSLP over the RRJ-Conv domain. Here, the RMSDs and biases are calculated as
where A(i), xRRJ(i) and xJRA(i) are the area and MSLPs of RRJ-Conv and JRA-55, respectively, represented at the i-th JRA-55 grid inside the RRJ-Conv domain. The 10-day running means of the RMSDs and biases are stable, although they are relatively larger in summer than in winter. The RMSDs are 0.7 hPa for June–August and 0.9 hPa for December–February throughout the reanalysis period. The variability of MSLP fields around Japan is larger in winter than in summer, which could be a cause of the seasonality of the RMSDs. At longer time scales, the RMSDs and biases do not vary during the 20 years. The results indicate that RRJ-Conv successfully reproduces most of the synoptic fields and maintains stable reanalysis quality over the long term.

Notable, the RMSDs of the instant fields sometimes have large values exceeding 2 hPa. In some cases, the large RMSDs resulted from differences in TC positions and intensities in RRJ-Conv and JRA-55. In other cases, large RMSDs are associated with failure of RRJ-Conv to reproduce rapidly developing extratropical cyclones passing through the Pacific Ocean to the south and east of the main island of Japan. The observations assimilated in RRJ-Conv are relatively sparse over the ocean, which can result in insufficient constraints of the fields. The perturbations given to lateral boundary conditions are not flow-dependent, and no perturbations are given to account for uncertainties in the SST data and the model, which can fail to estimate forecast error covariances. The failures in similar situations can also imply that NHM has some systematic biases in simulating the rapid development of such extratropical cyclones.
3.2 TCs
Figure 5 shows the errors of the TC center positions in RRJ-Conv and JRA-55 against the JMA’s best track data for all the TCs inside the RRJ-Conv domain during the 20 years. RRJ-Conv analyses more TCs with position errors below 50 km than does JRA-55, while the number of TCs with errors greater than 200 km slightly increases. The averaged error of RRJ-Conv is approximately 60 km, which is comparable to that of JRA-55, in which retrieved wind profiles surrounding TCs are assimilated (Kobayashi et al. 2015). One of the factors for maintaining the reproducibility of the TC positions in RRJ-Conv is assimilation of the TC positions. Each assimilation process only corrects the TC position by a small amount but modifies the position relative to the large-scale steering flows. As a result, the impacts of the assimilation of TC positions can increase over time. Another factor is the spectral nudging applied in the outer 25-km NHM-LETKF, which contributes to reducing inconsistency between RRJ-Conv and JRA-55 in large-scale steering flows in the RRJ-Conv system.

Figure 6 shows comparisons between the TC central pressures of the JMA’s best track data and those of RRJ-Conv and JRA-55. JRA-55 overestimates TC central pressures. There are few TCs whose central pressures are less than 960 hPa in JRA-55. RRJ-Conv also overestimates them but tends to estimate TC central pressures closer to the JMA’s best track data than does JRA-55. Figure 7 shows the spatial distributions of biases of TC central pressures. RRJ-Conv has biases comparable to those of JRA-55 along the lateral boundary of RRJ-Conv but improves TC central pressures over the ocean along the southern coast of Japan main islands, even though TC intensity information from the best track data is not assimilated. The 5-km grid model is starting to resolve TC inner core structures (Kanada and Wada 2016). The benefit of the high-resolution model can primarily contribute to the improvement of TC central pressures in RRJ-Conv. RRJ-Conv avoids large TC position errors, resulting in TCs staying under the environments consistent with the reality. This can also support the improvements in TC central pressures. The small improvement along the lateral boundaries exhibits insufficient spin-up for TCs from the boundary data at lower resolution.

4. Evaluation of precipitation
4.1 Monthly precipitation
Figure 8a shows the 20-year mean monthly precipitation averaged over the JMA’s raingauge observation sites plotted in Fig. 3. Both RRJ-Conv and JRA-55 simulate the amounts of monthly precipitation with relative biases less than 15 %. In terms of seasonal variation, the observed monthly precipitation has two peaks in July and September and is minimal in winter. RRJ-Conv successfully simulates the observed seasonal variation, despite certain underestimation of precipitation in June. RRJ-Conv improves the monthly precipitation in September the most and simulates the peak in September, which is poorly represented by JRA-55.

Figure 8b shows the spatial correlations to the observations for the 20-year mean monthly precipitation at the observation sites across Japan. The spatial correlation coefficients of JRA-55 are lower in summer, dropping to 0.4 in August, while they are approximately 0.8 in the other seasons. RRJ-Conv improves the spatial correlations in most of the months, although they are still relatively low in July and August. Figure 8c shows the spatial standard deviations of the 20-year mean monthly precipitation, which measure the amplitude of the spatial variability in the monthly precipitation. Compared with the raingauge observations, JRA-55 underestimates the deviation throughout the year. RRJ-Conv improves the spatial deviations but overestimates the deviations in July and August. The relatively low spatial correlation and large spatial deviations in July and August in RRJ-Conv are caused by the overestimation of convective precipitation over the mountainous region in the central part of Japan, while RRJ-Conv successfully simulates the precipitation pattern in the western part of Japan, which is rather uniform in JRA-55. Apart from this deficiency, RRJ-Conv represents the spatial distributions of the 20-year mean monthly precipitation more realistically in terms of both pattern and amplitude throughout the year than does JRA-55.
In September, RRJ-Conv improves both amount and spatial variation in the monthly precipitation compared with JRA-55 (Fig. 8). Figure 9 shows the spatial distributions of the monthly precipitation in September. Large amounts of precipitation are observed on the Pacific Ocean sides of mountains in the western part of Japan. RRJ-Conv simulates the observed distribution well, while JRA-55 underestimates the enhanced precipitation. The spatial distribution is similar to that of TC-induced precipitation in Japan which has a peak in September, as shown in Kamahori and Arakawa (2018). RRJ-Conv can improve the representation of the TC intensity to JRA-55, as mentioned in Section 3.2. In addition, RRJ-Conv represents fine topographies that lift TC-driven moist flows better than does JRA-55. These factors contribute to the improvement of locally enhanced precipitation. Despite this improvement, RRJ-Conv still tends to underestimate the overall precipitation. One possible cause is the insufficient representation of the TC intensity, as mentioned in Section 3.2.

Figure 10a shows the frequencies of daily precipitation exceeding the thresholds. JRA-55 overestimates the frequencies of weak precipitation, but the frequencies rapidly decrease as the thresholds increase. Figure 10b shows the bias scores, defined as the ratios of the simulated frequencies to the observed frequencies, for daily precipitation exceeding thresholds. The bias scores of JRA-55 are less than 1 for precipitation more than 15 mm day−1 and only approximately 0.2 for precipitation more than 100 mm day−1, although the score is approximately 1.5 for precipitation more than 1 mm day−1. RRJ-Conv represents the observed frequencies much better than JRA-55 for weak and heavy precipitation. Comparing with those of JRA-55, the bias scores of RRJ-Conv fits to 1, exceeding 0.8 even for precipitation more than 120 mm day−1. For thresholds larger than 150 mm day−1, the bias scores decrease rapidly, which may imply a certain limitation of RRJ-Conv, although they are still much better than those of JRA-55.
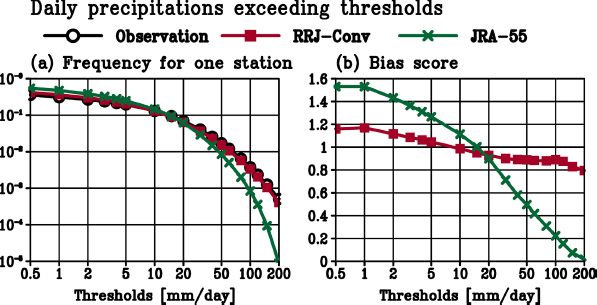
Figure 11 shows the spatial distributions of the frequencies of daily precipitation exceeding 100 mm from July 2001 to June 2021. Daily precipitation exceeding 100 mm is more frequently observed at stations in the south-western part of Japan, particularly in regions along the Pacific Ocean and East China Sea (Fig. 11a). RRJ-Conv simulates the observed features well (Fig. 11b). As displayed in the scatter plots (Fig. 11d), the frequencies in RRJ-Conv fit those observed at all sites, except for Ono-Aida on Yakushima (Fig. 11a). Note that Yakushima is a small and steep island with a diameter of approximately 20 km and an elevation of approximately 2000 m at its peak. As reported by Sasaki et al. (2015), the 5-km grid system is insufficient to resolve the observed local features at Ono-Aida, causing overestimation. When Ono-Aida is excluded, the spatial correlation and regression coefficients of RRJ-Conv to the observations are 0.87 and 0.79, respectively. In contrast, JRA-55 has difficulty representing daily precipitation greater than 100 mm, thereby largely underestimating the frequencies. The spatial correlation and regression coefficients of JRA-55 to the observations, except for Ono-Aida, are 0.71 and 0.16, respectively. The comparisons indicate that RRJ-Conv improves the representation of the spatial distribution of the frequencies of heavy precipitation, such as daily precipitation exceeding 100 mm, compared with JRA-55.

Figure 12 shows the interannual variation in the number of days with precipitation exceeding 100 mm averaged across all the observation sites. RRJ-Conv tends to underestimate the numbers by 11 % but the biases are stable throughout the period, indicating that RRJ-Conv can maintain consistency in reanalysis quality over the time period. In terms of interannual variability, RRJ-Conv simulates the observed variation better than does JRA-55. The correlation and regression coefficients of RRJ-Conv to the observations are 0.94 and 0.96, respectively, while those of JRA-55 are 0.79 and 0.44, respectively. The results suggest that RRJ-Conv successfully represents interannual variability, in addition to climatological means, in heavy precipitation, compared to JRA-55.
a. A Baiu heavy rainfall case
In early July 2018, extremely heavy rainfall was brought by the Baiu front stagnating over the western part of Japan (Shimpo et al. 2019).
Figure 13 shows the 96-hour accumulated precipitation from 12 UTC on 4 July to 12 UTC on 8 July. From the JMA’s radar/raingauge-analyzed precipitation data, precipitation exceeds 300 mm over the western part of Japan and is locally enhanced to more than 500 mm. JRA-55 captures more than 300 mm of precipitation along the western part of Japan but cannot represent large amounts of local precipitation (Fig. 13c). RRJ-Conv can simulate the observed features, including local enhanced precipitation exceeding 500 mm in the precipitation area along the western part of Japan, although heavy precipitation is spuriously simulated or is missed in some areas (Fig. 13b). The histograms of the total precipitation (Figs. 13a–c) also depict that RRJ-Conv better fits to the JMA’s radar/raingauge-analyzed precipitation than JRA-55, particularly for precipitation larger than 500 mm (Figs. 13d, e). The Spearman’s correlation coefficient of the spatial distribution over the domain indicated in Fig. 13 is 0.81 between RRJ-Conv and the JMA’s radar/raingauge-analyzed precipitation. Figure 14 shows the time series of the fractions of areas with 3-hour precipitation greater than 10 mm and 30 mm. Note that the target domain is over and around Japanese islands, specifically the domain surrounded by black bold lines in Fig. 13, considering the observation ranges of the radar network and the distribution of the raingauges. For 3-hourly precipitation greater than 10 mm, although the variation in JRA-55 follows that of the observations, JRA-55 tends to overestimate these areas (Fig. 14a). JRA-55 estimates no areas with 3-hour precipitation greater than 30 mm in most of the period (Fig. 14b). These results indicate a limitation of JRA-55 in representing heavy precipitation. RRJ-Conv largely improves the representation of the time series, compared to JRA-55. The variation in the area of 3-hourly precipitation over 10 mm in RRJ-Conv are more consistent with the observed variation. For precipitation greater than 30 mm, RRJ-Conv can follow the observed time series, although it underestimates some of the observed peaks. As Shimpo et al. (2019) reported, there were a number of mesoscale convective systems embedded in the Baiu front, which contributed to locally enhanced precipitation. While JRA-55 cannot resolve such mesoscale systems, RRJ-Conv can capture the heavy precipitation brought by the mesoscale systems. The resolution of RRJ-Conv is still insufficient to fully resolve them, requiring a cumulus parameterization, which causes difficulties in simulating such heavier precipitation in the short term.

An extreme heavy rainfall event caused by Typhoon Hagibis (T1919) occurred over the eastern part of Japan in October 2019. Typhoon Hagibis approached Japan after its central pressure reached 915 hPa over the Pacific Ocean to the south of Japan. It made landfall in the Izu Peninsula on 12 October and passed through the eastern part of Japan. A number of the JMA’s raingauges observed record-breaking rainfalls. At Hakone, 72-hour precipitation exceeded 1000 mm from 10 to 12 October 2019 (Japan Meteorological Agency 2019).
Figure 15 shows the track and central pressure of Typhoon Hagibis. Both JRA-55 and RRJ-Conv simulate the track close to the JMA’s best track data. The observed central pressure was less than 950 hPa before landfall (Fig. 15b). JRA-55 estimates it only approximately 970 hPa even at the minimum. RRJ-Conv better represents the TC intensity around Japan. Its central pressure is gradually deepened as it moves to the center of the domain, reaching 962 hPa right before the landfall. The shallow bias as in JRA-55 remains in RRJ-Conv, particularly over the ocean to the south of Japan. This issue can be attributed to insufficient spin up for the TC across the lateral boundary. The lower-resolution lateral boundary data are strongly affected near the southern lateral boundary. In addition, over the ocean there are few in-situ surface pressure and upper-air observations, which might include information about the TC intensity when TCs pass near the observation sites.

Figure 16 shows the 72-hour precipitation from 00 UTC on 10 October to 00 UTC on 13 October 2019. Along the TC track, the precipitation from the JMA’s radar/raingauge-analyzed precipitation data exceeded 200 mm and locally enhanced on the eastern side of the mountainous areas. Although JRA-55 captures heavy precipitation along the TC track, it fails to represent the localized enhancement. The correlation is weak between JRA-55 and the radar/raingauge-analyzed precipitation for the total precipitation larger than 250 mm (Fig. 16e). RRJ-Conv improves the distribution of precipitation compared to JRA-55, representing the locally enhanced precipitation despite underestimating the peak values. RRJ-Conv better fits the radar/raingauge-analyzed precipitation than JRA-55, particularly for precipitation larger than 250 mm (Fig. 16d), and the Spearman correlation coefficient to the radar/raingauge-analyzed precipitation is 0.83. The improvements in the local enhancement of precipitation appear to result from the finer orography in RRJ-Conv, which can better represent the effects of lifting warm humid air at the local scale. RRJ-Conv captures the intensity of the TC around Japan better than does JRA-55, which can also contribute to the improvement. While improving the local enhancement along mountainous areas, RRJ-Conv underestimates the total precipitation, particularly in the plain area. RRJ-Conv still underestimates the intensity of Typhoon Hagibis passing through Japan. This underestimation of the TC intensity could be one of the possible causes. The cumulus parameterization used in the model tends to be overly sensitive to topography when simulating precipitation (Narita 2008; Kanada et al. 2008). This model bias can be another possible cause.

An anomalously heavy snowfall occurred due to the intensified East Asian winter monsoon. On the Japan sea side of Honshu, the largest island of Japan, from 14 to 21 December 2020, the previous records of snowfall at some of the JMA’s raingauges sites were broken (Japan Meteorological Agency 2020).
Figure 17 shows the total precipitation for the period of 14–21 December 2020. The distribution of the observed precipitation has clear contrast between the upwind and leeward sides of mountain ranges, including locally enhanced areas. This local enhancement is attributed to convections triggered by steep topography and mesoscale convergences of the cold airmass inflows. Figure 18 shows the time series of 3-hour precipitation at Tsunan, which is one of the raingauge sites where extremely heavy snowfall were observed in this event. According to the raingauge observations, the amount of 3-hour precipitation varies from 1.0 mm to 10.5 mm during the event, except for the period with almost no precipitation in 17–18 December due to temporal weakening of the monsoon.


Although JRA-55 simulates precipitation along the Sea of Japan side of Japan, the contrast is weaker than that observed. The localized distribution is roughly represented on the Sea of Japan side of Japan, but the peak values are underestimated. The maximum total precipitation is less than 240 mm in JRA-55, while the maximum value exceeds 350 mm in the observation. The temporal variation in precipitation at Tsunan in JRA-55 is smaller than the observed variation. RRJ-Conv successfully simulates the locally enhanced precipitation exceeding 350 mm for the 8 days in RRJ-Conv, which is comparable to the observations. RRJ-Conv represents the temporal variation in precipitation at Tsunan, including the period without precipitation, better than JRA-55. Nevertheless, RRJ-Conv tends to underestimate precipitation in the plains in the windward side and to spread more precipitation to the leeward side. The histograms also depict that RRJ-Conv has higher potential to represent heavy precipitation than JRA-55. When measured with the Spearman’s correlation coefficient to the radar/raingauge-analyzed precipitation, RRJ-Conv is 0.85, which is comparable to JRA-55. One of the possible causes is the topography in the 5-km grid model. The modeled topography is lower and smoother than the actual topography, resulting in precipitation systems tending to be flowed over the mountains. The resolution of the RRJ-Conv system is still insufficient to fully resolve convections to produce precipitation in this area in winter (Kawase et al. 2019). The insufficient resolution can delay the initiation of convections, which also causes the downwind shift in precipitation.
5. Conclusions
We started to conduct RRJ-Conv, a 5-km grid long-term regional reanalysis for Japan with assimilating conventional observations. RRJ-Conv for 20 years from July 2001 to June 2021 was evaluated with exploring its added values to JRA-55, mainly focusing on precipitation. RRJ-Conv is confirmed to provide atmospheric fields with consistency in analysis quality for the long term, which is favorable for investigating local climates.
Comparisons with JRA-55 suggest that RRJ-Conv has advantages in representing the TC intensity and simulating moderate and heavy precipitation. The improvements in simulating heavy precipitation are consistent with the results of Fukui et al. (2018). RRJ-Conv improves the seasonality of precipitation and the spatial distributions of monthly precipitation. It simulates the interannual variability in daily precipitation exceeding 100 mm well, which JRA-55 has difficulty representing. RRJ-Conv is demonstrated to fit the observed precipitation better than JRA-55 in extreme precipitation cases induced by the Baiu front, the TC, and the East Asian winter monsoon cold-air outbreak. The improvements can be attributed to the enhanced model resolution to a 5-km grid spacing, which can better represent mesoscale phenomena, such as TCs and local convergences, and the effects of complex topography. It is also emphasized that the assimilation contributes to the improvements by maintaining the environments favorable for simulating the actual situations.
Despite the presented improvements to JRA-55, RRJ-Conv still has some limitations. RRJ-Conv sometimes fails to reproduce depression systems passing through the ocean to the south and east of Japanese islands, where few conventional observations are available. Biases remain in heavier precipitation in RRJ-Conv. Therefore, advancing the reanalysis system towards the next generation of RRJ-Conv is also an important future work. To improve the treatment of cumulus convections, which largely influences precipitation simulations, further optimizing the cumulus parameterization or enhancing the resolution to a convective permitting model is one future direction. To extract more information from the limited observations, it is essential to improve the estimation of forecast error covariances. One approach is to enhance the ensemble size with relaxing the localization, as demonstrated by some studies (e.g., Kunii 2014; Duc et al. 2021). Another approach is to apply flow-dependent perturbations to the lateral boundary and sea surface temperature fields to appropriately represent uncertainties in boundary conditions.
A long-term high-resolution reanalysis dataset with stable quality covering more than 60 years helps us to comprehend the long-term variations in the local climate in Japan. The evaluation in this study was only for the period of 20 years. This preriod is sufficient to understand current climate states and some interannual variabilities but is insufficient in detecting longer variations, including impacts of global warming. Therefore, further evaluation from the perspective of climate change is necessary after completing RRJ-Conv, which extended back to 1958, which is the starting point of JRA-55. In addition, our evaluation mainly focused on precipitation in this present study. To explore the potential of RRJ-Conv for various applications, it would be also interesting to examine other meteorological variables, such as temperature and wind speed. These aspects will be addressed in our forthcoming study.
Acknowledgments
The authors thank two anonymous reviewers for their helpful comments. The authors thank the Climate Prediction Division and the Numerical Prediction Division of the JMA for providing the observations for assimilation and greenhouse gas data. The JMA NHM has been developed by the Meteorological Research Institute and the Numerical Prediction Division of the JMA. RRJ-Conv was produced by using the supercomputing resources at the Cyberscience Center, Tohoku University with the aid of its staffs. This work was performed as a joint research project between Tohoku University and the Meteorological Research Institute. This work was supported by MEXT as “Program for Promoting Researches on the Super-computer Fugaku” (Large Ensemble Atmospheric and Environmental Prediction for Disaster Prevention and Mitigation), JST Grant Number JPMJPF2013, and the Core Research Cluster of Disaster Science in Tohoku University (a Designated National University).
References
- Bauer, P., A. Thorpe, and G. Brunet, 2015: The quiet revolution of numerical weather prediction. Nature, 525, 47–55.
- Beljaars, A. C. M., and A. A. M. Holtslag, 1991: Flux parameterization over land surfaces for atmospheric models. J. Appl. Meteor. Climatol., 30, 327–341.
- Bengtsson, L., and J. Shukla, 1988: Integration of space and in situ observations to study global climate change. Bull. Amer. Meteor. Soc., 69, 1130–1143.
- Benjamin, S. G., J. M. Brown, G. Brunet, P. Lynch, K. Saito, and T. W. Schlatter, 2018: 100 years of progress in forecasting and NWP applications. Meteor. Monogr., 59, 13.1–13.67.
- Bollmeyer, C., J. D. Keller, C. Ohlwein, S. Wahl, S. Crewell, P. Friederichs, A. Hense, J. Keune, S. Kneifel, I. Pscheidt, S. Redl, and S. Steinke, 2014: Towards a high-resolution regional reanalysis for the European CORDEX domain. Quart. J. Roy. Meteor. Soc., 141, 1–15.
- Bromwich, D. H., A. B. Wilson, L. S. Bai, G. W. K. Moore, and P. Bauer, 2016: A comparison of the regional Arctic System Reanalysis and the global ERA-Interim Reanalysis for the Arctic. Quart. J. Roy. Meteor. Soc., 142, 644–658.
- Dahlgren, P., T. Landelius, P. Kållberg, and S. Gollvik, 2016: A high-resolution regional reanalysis for Europe. Part 1: Three-dimensional reanalysis with the regional HIgh-Resolution Limited-Area Model (HIRLAM). Quart. J. Roy. Meteor. Soc., 142, 2119–2131.
- Duc, L., T. Kawabata, K. Saito, and T. Oizumi, 2021: Forecasts of the July 2020 Kyushu heavy rain using a 1000-member ensemble Kalman filter. SOLA, 17, 41–47.
- Fukui, S., T. Iwasaki, K. Saito, H. Seko, and M. Kunii, 2018: A feasibility study on the high-resolution regional reanalysis over Japan assimilating only conventional observations as an alternative to the dynamical down-scaling. J. Meteor. Soc. Japan, 96, 565–585.
- Gesch, D. B., K. L. Verdin, and S. K. Greenlee, 1999: New land surface digital elevation model covers the Earth. EOS, 80, 69–70.
- Gregow, H., L. Jylhä, H. M. Mäkelä, J. Aalto, T. Manninen, P. Karlsson, A. K. Kaiser-Weiss, F. Kaspar, P. Poli, D. G. H. Tan, A. Obregon, and Z. Su, 2016: Worldwide survey of awareness and needs concerning reanalyses and respondents views on climate services. Bull. Amer. Meteor. Soc., 97, 1461–1473.
- Hamill, T. M., J. S. Whitaker, and S. L. Mullen, 2006: Re-forecasts: An important dataset for improving weather predictions. Bull. Amer. Meteor. Soc., 87, 33–46.
- Hersbach, H., B. Bell, P. Berrisford, S. Hirahara, A. Horányi, J. Muñoz-Sabater, J. Nicolas, C. Peubey, R. Radu, D. Schepers, A. Simmons, C. Soci, S. Abdalla, X. Abellan, G. Balsamo, P. Bechtold, G. Biavati, J. Bidlot, M. Bonavita, G. De Chiara, P. Dahlgren, D. Dee, M. Diamantakis, R. Dragani, J. Flemming, R. Forbes, M. Fuentes, A. Geer, L. Haimberger, S. Healy, R. J. Hogan, E. Hólm, M. Janisková, S. Keeley, P. Laloyaux, P. Lopez, C. Lupu, G. Radnoti, P. de Rosnay, I. Rozum, F. Vamborg, S. Villaume, and J.-N. Thépaut, 2020: The ERA5 global reanalysis. Quart. J. Roy. Meteor. Soc., 146, 1999–2049.
- Hunt, B. R., E. J. Kostelich, and I. Szunyogh, 2007: Efficient data assimilation for spatiotemporal chaos: A local ensemble transform Kalman filter. Phys. D, 230, 112–126.
- Ikawa, M., and K. Saito, 1991: Description of a nonhydrostatic model developed at the Forecast Research Department of the MRI. Tech. Rep. Meteor. Res. Inst., No. 28, 245 pp (with Japanese abstract).
- Ishii, M., A. Shouji, S. Sugimoto, and T. Matsumoto, 2005: Objective analyses of sea-surface temperature and marine meteorological variables for the 20th century using ICOADS and the Kobe collection. Int. J. Climatol., 25, 865–879.
- Japan Meteorological Agency, 2019: Report on factors of heavy rain by Typhoon Hagibis 2019. Japan Meteorological Agency, 8 pp (in Japanese). [Available at https://www.jma.go.jp/jma/kishou/know/yohokaisetu/T1919/mechanism.pdf.] (Accessed on 18 December 2023).
- Japan Meteorological Agency, 2020: A preliminary report on heavy snowfall associated with intensified East Asian winter monsoon. 23 pp (in Japanese). [Available at https://www.data.jma.go.jp/obd/stats/data/bosai/report/2020/20201224/jyun_sokuji20201214-1221.pdf.] (Accessed on 18 December 2023).
- Jermey, P. M., and R. J. Renshaw, 2016: Precipitation representation over a two-year period in regional reanalysis. Quart. J. Roy. Meteor. Soc., 142, 1300–1310.
- Kain, J. S., 2004: The Kain–Fritsch convective parameterization: An update. J. Appl. Meteor. Climatol., 43, 170–181.
- Kalnay, E., M. Kanamitsu, R. Kistler, W. Collins, D. Deaven, L. Gandin, M. Iredell, S. Saha, G. White, J. Woollen, Y. Zhu, M. Chelliah, W. Ebisuzaki, W. Higgins, J. Janowiak, K. C. Mo, C. Ropelewski, J. Wang, A. Leetmaa, R. Reynolds, R. Jenne, and D. Joseph, 1996: The NCEP/NCAR 40-year reanalysis project. Bull. Amer. Meteor. Soc., 77, 437–471.
- Kamahori, H., and O. Arakawa, 2018: Tropical cyclone induced precipitation over Japan using observational data. SOLA, 14, 165–169.
- Kanada, S., and A. Wada, 2016: Sensitivity to horizontal resolution of the simulated intensifying rate and inner-core structure of Typhoon Ida, an extremely intense typhoon. J. Meteor. Soc. Japan, 94A, 181–190.
- Kanada, S., M. Nakano, S. Hayashi, T. Kato, M. Nakamura, K. Kurihara, and A. Kitoh, 2008: Reproducibility of maximum daily precipitation amount over Japan by a highresolution non-hydrostatic model. SOLA, 4, 105–108.
- Kawase, H., H. Iida, K. Aoki, W. Shimada, M. Nosaka, A. Murata, and H. Sasaki, 2019: Comparison of snow cover observations along the Tateyama-Kurobe Alpine route with snow cover simulations using the Non-hydrostatic Regional Climate Model (NHRCM) with different horizontal resolutions. J. Geogr., 128, 77–92 (in Japanese).
- Kitagawa, H., 2000: Radiation processes. Separate volume of the annual report of NPD, 46, 16–31 (in Japanese).
- Kobayashi, C., H. Endo, Y. Ota, S. Kobayashi, H. Onoda, Y. Harada, K. Onogi, and H. Kamahori, 2014: Preliminary results of the JRA-55C, an atmospheric reanalysis assimilating conventional observations only. SOLA, 10, 78–82.
- Kobayashi, S., Y. Ota, Y. Harada, A. Ebita, M. Moriya, H. Onoda, K. Onogi, H. Kamahori, C. Kobayashi, H. Endo, K. Miyaoka, and K. Takahashi, 2015: The JRA-55 reanalysis: General specifications and basic characteristics. J. Meteor. Soc. Japan, 93, 5–28.
- Kunii, M., 2014: The 1000-member ensemble Kalman filtering with the JMA nonhydrostatic mesoscale model on the K computer. J. Meteor. Soc. Japan, 92, 623–633.
- Kunii, M., 2015: Assimilation of tropical cyclone track and wind radius data with an ensemble Kalman filter. Wea. Forecasting, 30, 1050–1063.
- Loveland, T. R., B. C. Reed, J. F. Brown, D. O. Ohlen, Z. Zhu, L. Yang, and J. W. Merchant, 2000: Development of a global land cover characteristics database and IGBP DISCover from 1 km AVHRR data. Int. J. Remote Sens., 21, 1303–1330.
- Mesinger, F., G. DiMego, E. Kalnay, K. Mitchell, P. C. Shafran, W. Ebisuzaki, D. Jović, J. Woollen, E. Rogers, E. H. Berbery, M. B. Ek, Y. Fan, R. Grumbine, W. Higgins, H. Li, Y. Lin, G. Manikin, D. Parrish, and W. Shi, 2006: North American regional reanalysis. Bull. Amer. Meteor. Soc., 87, 343–360.
- Nagata, K., 2011: Quantitative precipitation estimation and quantitative precipitation forecasting by the Japan Meteorological Agency. RSMC Tokyo-Typhoon Center Tech. Rev., No. 13, 37–50. [Available at https://www.jma.go.jp/jma/jma-eng/jma-center/rsmc-hp-pub-eg/techrev/text13-2.pdf.]
- Nakanishi, M., and H. Niino, 2006: An improved Mellor–Yamada level 3 model: Its numerical stability and application to a regional prediction of advection fog. Bound.-Layer Meteor., 119, 397–407.
- Narita, M., 2008: Improvement and adjustment of Kain-Fritsch scheme. Separate vol. ann. rep. NPD, 54, 103–111 (in Japanese).
- Onogi, K., J. Tsutsui, H. Koide, M. Sakamoto, S. Kobayashi, H. Hatsushika, T. Matsumoto, N. Yamazaki, H. Kamahori, K. Takahashi, S. Kadokura, K. Wada, K. Kato, R. Oyama, T. Ose, N. Mannoji, and R. Taira, 2007: The JRA-25 reanalysis. J. Meteor. Soc. Japan, 85, 369–432.
- Pathak, J., S. Subramanian, P. Harrington, S. Raja, A. Chattopadhyay, M. Mardani, T. Kurth, D. Hall, Z. Li, K. Azizzadenesheli, P. Hassanzadeh, K. Kashinath, and A. Anandkumar, 2022: FourCastNet: A global data-driven high-resolution weather model using adaptive fourier neural operators. [Available at https://arxiv.org/abs/2202.11214.]
- Rani, S. I., T. Arulalan, J. P. George, E. N. Rajagopal, R. Renshaw, A. Maycock, D. M. Barker, and M. Rajeevan, 2021: IMDAA: High-resolution satellite-era reanalysis for the indian monsoon region. J. Climate, 34, 5109–5133.
- Saito, K., J.-I. Ishida, K. Aranami, T. Hara, T. Segawa, M. Narita, and Y. Honda, 2007: Nonhydrostatic atmospheric models and operational development at JMA. J. Meteor. Soc. Japan, 85B, 271–304.
- Sasaki, H., A. Murata, H. Kawase, M. Hanafusa, M. Nosaka, M. Oizumi, R. Mizuta, T. Aoyagi, F. Shido, and K. Ishihara, 2015: Projection of future climate change around Japan by using MRI non-hydrostatic regional climate model. Tech. Rep. Meteor. Res. Inst., No. 73, 95 pp.
- Shimpo, A., K. Takemura, S. Wakamatsu, H. Togawa, Y. Mochizuki, M. Takekawa, S. Tanaka, K. Yamashita, S. Maeda, R. Kurora, H. Murai, N. Kitabatake, H. Tsuguti, H. Mukougawa, T. Iwasaki, R. Kawamura, M. Kimoto, I. Takayabu, Y. N. Takayabu, Y. Tanimoto, T. Hirooka, Y. Masumoto, M. Watanabe, K. Tsuboki, and H. Nakamura, 2019: Primary factors behind the heavy rain event of July 2018 and the subsequent heat wave in Japan. SOLA, 15A, 13–18.
- Skamarock, W. C., 2004: Evaluating mesoscale NWP models using kinetic energy spectra. Mon. Wea. Rev., 132, 3019–3032.
- Sommeria, G., and J. W. Deardorff, 1977: Subgrid-scale condensation in models of nonprecipitating clouds. J. Atmos. Sci., 34, 344–355.
- Su, C.-H., N. Eizenberg, P. Steinle, D. Jakob, P. Fox-Hughes, C. J. White, S. Rennie, C. Franklin, I. Dharssi, and H. Zhu, 2019: BARRA v1.0: The Bureau of Meteorology atmospheric high-resolution regional reanalysis for Australia. Geosci. Model Dev., 12, 2049–2068.
- Trenberth, K. E., and J. G. Olson, 1988: An evaluation and intercomparison of global analyses from the National Meteorological Center and the European Centre for Medium Range Weather Forecasts. Bull. Amer. Meteor. Soc., 69, 1047–1057.
- Tsuguti, H., and T. Kato, 2014: Objective extraction of heavy rainfall events and statistical analysis on their characteristic features. Tenki, 61, 455–469 (in Japanese).
- von Storch, H., H. Langenberg, and F. Feser, 2000: A spectral nudging technique for dynamical downscaling purposes. Mon. Wea. Rev., 128, 3664–3673.
- Yabu, S., S. Murai, and H. Kitagawa, 2005: Clear-sky radiation scheme. Separate volume of the annual report of NPD, No. 51, 53–64 (in Japanese).
- Yang, E.-G., H. M. Kim, and D.-H. Kim, 2022: Development of East Asia Regional Reanalysis based on advanced hybrid gain data assimilation method and evaluation with E3DVAR, ERA-5, and ERA-Interim reanalysis. Earth Syst. Sci. Data, 14, 2109–2127.
- Yin, J., X. Liang, Y. Xie, F. Li, K. Hu, L. Cao, F. Chen, H. Zou, F. Zhu, X. Sun, J. Xu, G. Wang, Y. Zhao, and J. Liu, 2023: East Asia reanalysis system (EARS). Earth Syst. Sci. Data, 15, 2329–2346.
- Zhang, F., C. Snyder, and J. Sun, 2004: Impacts of initial estimate and observation availability on convective-scale data assimilation with an ensemble Kalman filter. Mon. Wea. Rev., 132, 1238–1253.


