Abstract
The inner core of a tropical cyclone (TC) is vital for TC energetics and often undergoes dramatic changes. This article provides a review on the understanding and operational practices of the structural changes in the TC inner core, mainly focusing on recent literature and activities. The inner core structure of a TC is generally described as an axisymmetric vortex in the vicinity of a hydrostatic and gradient wind-balanced state. However, this schematic can sometimes be oversimplified. Recent studies have documented small-scale features of the inner core, structural changes in TC rapid intensification, secondary eyewall formation, and eyewall replacement cycles using observational data, and idealized and sophisticated models. In line with the progress in understanding the inner core structure, several operational agencies have recently analyzed TC structural changes using their subjective analyses or diagnostic tools, contributing to disaster prevention. We also discuss potential impacts of climate change on the inner core structure, for which further work is required to reach a solid conclusion.
1. Introduction
Tropical cyclones (TCs; all acronyms are summarized in the appendix) are often highly destructive, and an understanding of these systems and their operational activities are important in atmospheric science and disaster prevention. The inner core of TCs is particularly important owing to the strong winds and intense rainfall. The inner core of a developed TC consists of an eye, an eyewall surrounding the eye, and inner rainbands originating from the eyewalls. It is generally accepted that diabatic heating in the eyewall, banking upward and outward, is vital for TC energetics, and the relevant updraft forces downward motion in the eye and outside the eyewall. Although this schematic is convenient for describing the basic structure of the inner core in a mature axisymmetric TC, the actual inner core of a TC is not as simple as it has small-scale features and asymmetries, which are dependent on the stage of life cycle, outer core, and environment. In addition, the inner core of the TC can experience a dramatic change such as the Secondary Eyewall Formation (SEF) in which another eyewall develops outside the existing eyewall. The existing eyewall is often replaced with the outer eyewall in a period of one day, which is referred to as the eyewall replacement cycle (ERC). As many researchers have become interested in these topics, new perspectives have been introduced over the last several years, which build upon existing studies. In addition to research purposes, the inner core structure of TCs is also important for operational analyses and forecasting of TC intensity and size. Operations on TC inner core structure in various agencies have recently become more active, however global activities are less documented in publications. Climatological changes in the TC inner core structure are also relevant. Although the development of a high-resolution model that can resolve the TC inner core is expensive for climatological simulation, some recent studies have discussed the structural changes in TC inner cores in future climate scenarios.
As numerous studies on TC inner core structure changes have been performed in the last several years, here we propose a review of these activities. The goal is to assist in organizing the available information, motivate further research, and contribute to disaster prevention and mitigation. The paper is organized as follows: In Section 2, a review of recent studies on fine-scale features and the fundamental understanding of the TC inner core, excluding the SEF and ERC, which are described in Section 3. Sections 2 and 3 begin with basic TC dynamics and conventional theories, followed by the recent studies. Recent activities on the operational analyses and forecasting of the TC inner core structure are summarized in Section 4, and the climatological impact is outlined in Section 5. Finally, Section 6 summarizes the conclusions. The review largely focused on literature published since 2018, and built upon existing reviews of the TC inner core structure (Stern et al. 2014a; Vigh et al. 2018). However, some studies published before 2018 were also referenced for better understanding. We do not review the structural changes in the tropical and extratropical transition, which is nicely summarized in Wood et al. (2023). Also, the inner core structure change is strongly related to the TC intensity change. A reader may refer to Chen et al. (2023) for recent studies on TC intensity change.
2. TC inner core structure (excluding SEF/ERC)
The basic structure of the TC inner core is reviewed prior to introducing recent progress in TC inner core structure research. A storm undergoes explosive convection, known as a convective burst, during its genesis and development. It has a deep structure that covers the entire troposphere. A mature TC has an eye characterized by a warm core and dry air except near the surface (Hawkins and Rubsam 1968). The eye is surrounded by an eyewall consisting of convective clouds sloping upward and outward, similar to a stadium. The inflow in the boundary layer directs humid air to the eyewall and obtains further moisture from warm sea surface, whereas most of the air flows outward in a shallow layer at the tropopause. The eyewall region exhibited intense diabatic heating and precipitation, and the cloud-free eye was thought to have been formed to compensate for subsidence. The TC tangential velocity is usually maximized at altitudes of 500–1000 m (Powell et al. 2003) and gradually weakens with increasing height. The tangential wind component that consists of strong cyclonic circulation is often called the primary circulation, while the radial and vertical wind components in the radial-pressure section are called the secondary circulation.
A mature TC is typically regarded as an axisymmetric vortex in the vicinity of gradient wind and hydrostatic balanced state (Ooyama 1969). The combination of the gradient wind balance and hydrostatic balance yields the thermal-wind balance, linking the vertical decrease in tangential wind to the radial decrease in temperature owing to the warm core. As the saturated equivalent potential temperature
 (or moist entropy s* = Cp log
 ; Cp is the specific heat capacity at constant pressure) is nearly conserved above the boundary layer, the motion of a parcel in the eyewall follows the constant
 surface. From a dynamical point of view, the absolute angular momentum (AAM) defined by the following equation is also an important quantity that is conserved without surface friction or turbulent mixing.
where M is the AAM, f is the Coriolis parameter, r is the distance from the TC center, and v is the tangential velocity. The coincident surface of constant M and constant
 in the eyewall region indicates moist slantwise neutrality (Emanuel 1983).
The horizontal motion of an air parcel in a rapidly rotating environment is restricted by inertial stability I2 defined as follows:
where ζ is the vertical component of relative vorticity. The horizontal motion in a rapidly rotating fluid is constrained by I instead of the Coriolis parameter f as the Rossby number (v/fr) is much larger than unity. For example, characteristic scales of inertial period and dynamically determined boundary layer depth are 2π/I and
 instead of 2π/f and
 , respectively, where K is the diffusive eddy viscosity (Ito et al. 2011; Kepert 2001; Zhang et al. 2011).
A mature TC is rather symmetric; however, it also has notable asymmetric features. One of the examples is small scale vorticities called as “mesovorticies” which behave as vortex Rossby waves (VRWs) whose background field is a TC-scale vortex (Macdonald 1968; Montgomery and Kallenbach 1997). Such asymmetric vorticity perturbations can be amplified by barotropic instability and/or forcing. The vertical shear of environmental horizontal wind (simply referred to as VWS) is known to yield an azimuthal wavenumber-1 component, in which active convection, heavy rainfall, and local maximum wind speed tend to be observed in the downshear or downshear-left (Corbosiero and Molinari 2003; Kepert 2001; Ueno and Kunii 2009). Asymmetries also develop due to the translation speed of a TC. The addition of the TC translation and primary circulation wind vectors results in faster earthrelative winds to the right of the TC motion and enhanced boundary layer radial convergence generally ahead of and to the right of motion (Kepert 2001; Kepert and Wang 2001; Shapiro 1983). These asymmetries can project onto the asymmetries created by the VWS (Uhlhorn et al. 2014; Zhang and Uhlhorn 2012).
2.1 TC inner-core structure in different stages
While the typical inner core structure of a mature TC is described above, Tao and Zhang (2019) conducted idealized simulations to investigate the structural changes before, during, and after the TC rapid intensification (RI) under various VWS conditions. Prior to the onset of RI, the vortex and convection structure exhibit significant asymmetry. It causes the upper-level warm anomaly induced by diabatic heating to be displaced from the mid-level warm anomaly. Strong updrafts are primarily located on the down-tilt side. Boundary layer inflows positioned underneath and upwind of the updrafts, while outflows are found on the downwind side. On the RI onset, updrafts and downdrafts begin to spread out alternately, encircle the surface center, and overlap. It leads to a temporary weakening of convection. The previously displaced warm cores start to merge, and the radial flows in the boundary layer become more axisymmetric, consistent with findings by Miyamoto and Takemi (2013). During RI, although some asymmetry remains, the structure of an eye became more upright, and the eyewall had strong updrafts with downdrafts outside the eyewall and subsidence in the eye. These processes are illustrated in Fig. 1. Alvey III and Hazelton (2022) investigated the misaligned vortices located in the middle and lower troposphere can align due to deep convection (not necessarily symmetric). Using ensemble simulations, Alvey et al. (2020) showed that the RI members are characterized by persistent and deep convection in the downshear. As a result, the vortex became aligned through the stretching term and precession. The stratiform precipitation and anvil clouds were seen in the upshear quadrants. Condensate transported from the downshear quadrants makes the middle to upper tropospheric air more humid by evaporation and sublimation. This contributes to the symmetrization of precipitation region, which is a necessary precursor for RI. Chen et al. (2018) and Chen et al. (2021) displayed that higher sea surface temperatures (SSTs) can facilitate more symmetric inner core precipitation which promotes faster vertical vortex alignment and faster contraction of the radius of maximum wind (RMW) preceding RI.

Even in the axisymmetric model, the inner core structure differs significantly between the developing and mature stages. Peng et al. (2019) displayed how the constant AAM and
 surfaces evolved to become parallel from an almost orthogonal state in the early development stage (Fig. 2). In the early development stage (Phase I), sporadic and deep convection from the high s* air near the sea surface repeatedly redistribute large M and s* values vertically from the lower troposphere to the tropopause; the locally large value of M is associated with convective rings. In the later development stage (Phase II), the congruent M and s surfaces coevolve toward the center and become aligned. Fei et al. (2021) investigated the role of vertical advection on the boundary layer structure, intensification rate, and intensity. The removal of vertical advection of radial wind significantly reduced both the height and strength of supergradient wind core. Meanwhile, the removal of vertical advection of agradient wind reduced the height of supergradient wind core but slightly increased the strength.

An observational study on Hurricane Michael (2018) confirmed that M surfaces are redistributed in the inner core region and that RI is accompanied by the ∂z/∂r increase along the constant M surface in the inner core (DesRosiers et al. 2022). It supports the previous study showing the smaller RMW with the larger ∂z/∂r (Stern et al. 2014b). Meanwhile, Ito and Yamamoto (2022) argued for the slope of a constant M surface using commercial aircraft data for TCs, most of which were in the decaying stage in the western North Pacific. Their analysis showed that strong TCs tended to have a small ∂z/∂r in the upper troposphere. Considering that the slope corresponds to the inertial stability divided by the baroclinicity, they believed that changes can be attributed to the strong potential temperature gradient of strong TCs.
Other environmental factors, such as VWS, synopticscale atmospheric circulation, and upper-level troughs, also influence the inner core structure. Using a database of composited airborne Doppler radars, Wadler et al. (2018) found that intensifying TCs have updrafts at higher altitudes and stronger magnitudes in the upshear quadrants than steady-state TCs. Strong and deep updrafts located inside the RMW efficiently spun the vortex (Rogers et al. 2013; Zhang and Rogers 2019).
Li et al. (2019) revisited the dynamics of eyewall contraction. Using the azimuthal-mean tangential wind budget and the diagnostic equation proposed by Stern et al. (2015), in which the change of RMW is decomposed into the radial gradient of local time tendency of the azimuthal mean tangential wind and the curvature of the radial profile of azimuthal-mean tangential wind, they showed radial advection dominated the RMW contraction in the lower boundary layer and the vertical advection causes the RMW contraction in the upper boundary layer and lower troposphere. Also, the eyewall contraction is dependent on the horizontal mixing near the eyewall. Wu and Ruan (2021) reported that the rapid RMW contraction tends to precede the RI in observations. The possible mechanism of this phenomena was given by Li, Y. et al. (2021). First, they affirmed that the AAM is not conserved following the RMW. During the rapid contraction phase, the RMW decreases inward across the AAM surfaces, explaining the RMW decreases with relatively small intensification. On the other hand, when the RMW contraction slows down and the intensification becomes rapid, the AAM surfaces move inward passing through the RMW.
2.2 Nontraditional features in the inner core
When Hurricane Patricia (2015) reached its lifetime maximum intensity, an atypical inner core structure was observed, with a maximum tangential wind in the mid-troposphere, in addition to the conventional maximum at the lower level (Stern et al. 2020). This feature, which is ultimately due to the inertial oscillation driven by surface friction, was found to be prominent in intense and/or small storms. The numerical simulation displayed that the multi-maxima disappeared when the vertical mixing was strong. Yamada et al. (2021) described double warm cores in the eye region of TC Lan (2017) based on dropsonde observations during the Tropical Cyclones–Pacific Asian Research Campaign for the Improvement of Intensity Estimations/Forecasts (T-PARCII) aircraft campaign (Fig. 3). Their saturation point analyses revealed that the air parcels in the upper warm core originated from the eyewall rather than the lower stratosphere. Furthermore, the dropsondes indicated the vigorous turbulent mixing between eye and eyewall. Based on these findings, they proposed a conceptual model in which the parcels in the eye boundary layer were mixed through eddies and moved upward on the inner side of the eyewall updrafts and consisted of the upper-level warm core. Double warm cores have been reproduced by simulations (Stern and Zhang 2013) and Hurricane Patricia also appeared to have a double warm core structure based on high density Global Hawk dropsonde data (Rogers et al. 2017).

Inside the eye region, sporadic short-lived deep convective clouds of up to 9 km, which were considerably taller than stratocumulus hub clouds of up to 3 km (Simpson 1952), were observed in the decay stage of TC Trami (2018) during T-PARCII. Both observations and numerical simulations display that these clouds formed after the weakening and outward shift of the eyewall due to significant sea-surface cooling because of the slow translation speed of TC Trami (2018) (Hirano et al. 2022). Their analysis showed that the genesis of deep eye clouds may indicate the decay of the warm core in the middle-lower troposphere.
The striating clouds (“striations” or “finger-like features”) at r ~ 30 km were clearly observed by the Himawari-8 satellite, which had remarkably high angular velocities at the inward flank of the eyewall (Fig. 4). Their radial orientation is gradually tilted in a time scale of 10 minutes according to the differences in the tangential speed depending on the altitude (Tsukada and Horinouchi 2020).
2.3 Wavenumber-1 component
Geostationary satellite Himawari-8 has a special mode to take images every 30 seconds. Horinouchi et al. (2023) utilized those rapid-scan observations for analyzing the flows in the eye region of TC Haishen (2020) during the intensification. The low-level local circulation center was located several kilometers away from the storm-scale center. Their analysis showed that the local circulation behaves wavenumber-1 component which developed algebraically (Nolan et al. 2001). An important role of the local circulation is to homogenize the rotational angular velocity within the eye and contributes to the increase of azimuthal-mean tangential wind. Dai et al. (2021) found that the wavenumber-1 convection asymmetry in the outer eyewall of Typhoon Lekima (2019) was not integrally related to the ambient VWS or frictional effect associated with TC motion as in Kepert (2001). They suggested that this asymmetry results from the phase locking between the radially-outward propagating wavenumber-2 VRWs, which originate from the inner eyewall, and the wavenumber-1 asymmetry that cyclonically propagates near the radially-inward side of the outer eyewall.
2.4 Boundary layer modulation on TC inner core structure
Ahern et al. (2019) analyzed dropsonde composites of the TC boundary layer structure at different stages of the TC lifecycle. Intensifying TCs are characterized by deeper jets above the logarithmic layer in the eyewall region, higher (weaker) inertial stability within (the outer area of) the eyewall, and more inward-penetrating boundary layer radial inflow than weakening TCs. Focusing on the decay phase of a full-physics simulation of Hurricane Irma (2017), Ahern et al. (2021) analyzed how the asymmetric agradient forcing within the boundary layer from the VWS and the storm motion force local accelerations of the primary vortex, suggesting that the interplay between the directionality of the VWS and storm motion vectors produces structural asymmetries. Zhang et al. (2023) analyzed a large number of Doppler profile data in multiple storms and derived composites of boundary layer structure of TC with different intensity and intensity change rates. First, they showed that the depth of an inflow layer is deeper in weaker storms than in strong storms. They also found that intensifying TCs tend to have the rapid radial decay of the tangential wind outside of RMW (called “narrow”). The narrow vortex is also characterized with larger inflow and strong updrafts being located near RMW, while non-intensifying TCs have large inflow in the outer-core region. The total advection of mean AAM near the RMW is much larger in narrow vortex than in broad vortex suggesting larger intensification rate given the same intensity of these two types of vortices.
While VWS is typically not favorable for TC intensification, Hurricane Michael (2018) intensified under moderate VWS. Using dropsondes and idealized simulations, Wadler et al. (2021a) and Wadler et al. (2021b) found that enhanced low-level outflow upshear originating from the inner-core insulated the boundary layer inflow from low-entropy convective downdrafts, aiding in boundary layer flux recovery. Rios-Berrios et al. (2018) also used idealized simulations to explore intensification under moderate VWS. Their analysis revealed that a reduction in tilt and increased symmetry precede intensification, as these processes are linked to a significant increase of near-surface vertical mass fluxes and equivalent potential temperature. A vorticity equation indicated that the increase of near-surface vertical mass fluxes facilitate intensification by stretching near the surface and tilting of horizontal vorticity in the free troposphere. Notably, the reduction in tilt occurs due to vortex merger that forms a single closed circulation. This vortex merger occurs after the vortex in the middle troposphere moves to the upshear left. It means that the flow supports near-surface vortex stretching, deep updrafts, and the reduction of low-entropy fluxes in the upshear left quadrant. Zhang et al. (2013) showed that anomalously large enthalpy fluxes located to the left of the shear vector, owing to the presence of mesoscale ocean eddies, also aided in faster boundary layer recovery. It is supported by Chen et al. (2018) and Chen et al. (2021) indicating that higher SST has been found to aid symmetrization through faster boundary layer recovery. In addition, strong upper ocean salinity vertical gradients can increase the upper ocean density stratification and reduce SST cooling (Hlywiak and Nolan 2019; Rudzin et al. 2018). Le Hénaff et al. (2021) and John et al. (2023) showed that anomalously fresh sea surface salinity boundary layer due to enhanced outflow from the Mississippi River reduced SST cooling under Hurricanes Michael and Sally, respectively, which facilitated axisymmetrization. Strength of the vertical turbulent mixing also regulates the boundary layer inflow and recovery process through multiscale interaction (Zhang and Rogers 2019; Zhang, J. A. et al. 2017).
Chen and Chavas (2020) and Hlywiak and Nolan (2021) investigated the time-dependent response of a TC structure to surface roughening and drying, analogous to landfall scenarios, based on idealized simulations. Chen and Chavas (2020) studied the axisymmetric response to instantaneous changes in the surface, whereas Hlywiak and Nolan (2021) simulated the three-dimensional response of translating systems. Both studies found similar results: surface drying produced monotonic weakening and horizontal expansion of the vortex as reduced moisture fluxes into the boundary layer eventually stabilized the eyewall and weakened secondary circulation. The response to drying was initially weak, however became more apparent over time after significant weakening occurred. Higher surface friction produces a more immediate effect compared to drying through the deceleration of the primary circulation and weakening of inertial stability. This supports the transient acceleration of the secondary circulation, enhancing the radial inflow and angular momentum import within the boundary layer and accelerating the outflow above the boundary layer before weakening and inner core expansion commenced. Subsequently, Chen and Chavas (2020) found that the total response of the maximum winds is approximately a product of the individual responses to surface roughening and drying, indicating the applicability of the maximum potential intensity theory (Emanuel 1986) to the landfall decay process. Hlywiak and Nolan (2022) followed up Hlywiak and Nolan (2021) with an investigation of the asymmetric response of the inner-core boundary layer during landfall and found that the accelerated secondary circulation response to increased friction begins over land and within the offshore flow preceding landfall of the eye. Friction over land forces a deep subgradient inflow layer, subsequently enhancing the near-eyewall convergence within the offshore flow and accelerating the downstream supergradient boundary layer jet (Fig. 5). These asymmetries in the inner core boundary layer at landfall are due to the sharp gradient of surface frictional stress, a mechanism which is similar yet larger in magnitude to the asymmetries that develop for translating TC over the open ocean (Kepert and Wang 2001; Shapiro 1983). Aircraft observations of landfalling Ida (2021) documented boundary layer inflow and wind asymmetry from ocean to land (Rogers and Zhang 2023) generally supporting Hlywiak and Nolan’s findings in numerical simulations.

TC boundary layers contain a lot of small-scale coherent structures, such as roll vortices and tornado-like vortices (e.g., Ito et al. 2017; Zhang et al. 2008). Recent large eddy simulations (LES) have demonstrated that a boundary layer becomes shallower with stronger VWS near the surface by employing the fine-mesh. For example, Ito et al. (2017) identified three types of near-surface coherent structures. A Type-A roll nearly parallel to the tangential wind prevailed outside of the RMW, and Type-B rolls almost orthogonal to the type-A rolls were found near the RMW. They were caused by an inflection-instability. Type-C rolls nearly parallel to the tangential wind were found inside the RMW, which can be explained by a parallel instability. When the grid spacing is 100 m or less, roll vortices significantly contribute to the transfer of heat and momentum (Liu et al. 2021). Similarly, LES simulations of a landfalling TC have replicated the presence of a thin boundary layer and highlighted the critical role of roll vortices (Li, X. et al. 2021).
2.5 Dry and moist TCs
Several studies have attempted to establish a fundamental understanding of the contribution of moisture to the inner core structure of TCs, including the RMW, width of the eyewall, and depth of the inflow layer. Generally, TC-like storms (hereafter, dry TCs) are known to potentially exist by relying only on sensible heat fluxes without water substances (Mrowiec et al. 2011), although real TCs are tied to water in Earth’s present climate. By comparing typical TCs to dry TCs, Cronin and Chavas (2019) investigated the role of moisture on TC structure. The RMW will become substantially larger when a TC is maintained under dry conditions, and the inflow layers of the dry TCs are much deeper than those of typical TCs. Wang and Lin (2020) further investigated the differences between moist and dry TCs using idealized simulations and found that the sub-saturation of a moist atmosphere, not the moisture itself, causes distinctions between moist and dry TCs. The inner core structures of the moist reversible and dry TC were almost the same, whereas a typical moist TC with falling hydrometeors was significantly different from a dry or moist reversible TC (Fig. 6). It suggests that falling hydrometeors place a strong constraint on the inner core structure of TCs through redistributing entropy. However, the mechanism by which the irreversible entropy production modulates the inner core structure of TCs remains unknown.

The outer core structure was also found to be an important factor influencing the inner core structure. Using an axisymmetric nonhydrostatic model, Tao et al. (2020) revisited Lilly’s model, which relates the tangential wind structure of an axisymmetric steady-state TC to its outer size and environmental conditions by simplifying the assumptions. They showed that variations in the sea surface, boundary layer and tropopause temperatures, and the AAM at some outer radius affect the radial profile of the tangential velocity at the top of the boundary layer. On the other hand, these parameter variations do not substantially affect normalized tangential velocity, V (r/rm)/Vm, where Vm is the maximum tangential wind at RMW. Chavas et al. (2015) demonstrated that the RMW could be reasonably estimated from the outer size by applying a TC structure model. They found that the eyewall expansion of Hurricane Helene (2006) during its RI was due to environmental-scale low-level convergence and upper-level divergence of the angular momentum flux by accelerating the tangential velocity outside the eyewall.
Martinez et al. (2020) found that initially large TCs remained large during development by importing a large angular momentum into the inner core and spinning up the wind field (Fig. 7). Martinez et al. (2020) also displayed that environmental factors such as the amount of moisture can modulate the outer core structure, which in turn has a significant effect on the inner core structure. The moist environment promotes outer core convection, spins up the outer core wind field, and leads to the contraction of large angular momentum surfaces into the inner core of the TC, which expands the horizontal field of the tangential velocity (Fig. 7). Qin and Wu (2021) also confirmed this environmental impact on the outer core structure and the consequent impact on the inner core structure. Shen et al. (2021) revealed that limiting the enthalpy fluxes within the outer core reduces the total inward transport of angular momentum, leading to a smaller inner core size, whereas suppressing the fluxes within the inner core has little influence on the overall storm size. They generally support the findings of Xu and Wang (2010b) and Xu and Wang (2010a), which investigated the relationship between an inner core and an outer core and impact of environmental moisture. These results highlight the importance of the spatial heterogeneity of surface fluxes in the inner core boundary layer structure.

3. SEF and ERC
TCs often possess a secondary eyewall outside the original eyewall (Willoughby et al. 1982) as illustrated in Fig. 8, and SEF events are more likely to occur as the TCs intensify (Kossin and Sitkowski 2009; Kuo et al. 2009). It typically begins with a spiral rain band morphing into a new eyewall outside the inner eyewall. Kuo et al. (2009) reported that approximately 57 % and 72 % of Category 4 and Category 5 TCs, respectively, possessed concentric eyewalls at some point during their lifetime in the western North Pacific. After the secondary (or outer) eyewall is generated, the inner core region exhibits multiple maxima of tangential winds and precipitation (Sitkowski et al. 2011). The low-echo reflectivity region between the concentric eyewalls is called a moat. Following the SEF, TCs often undergo an ERC, characterized by the weakening of the original inner eyewall and its replacement by the outer eyewall, which becomes the new primary eyewall. If the environmental conditions remain favorable for TC development, TCs can then reintensity. Such a process is typically over a timeframe ranging from a couple of hours to a day or two (Kossin and DeMaria 2016; Sitkowski et al. 2011). There are also cases in which SEF TCs do not undergo an ERC; instead, the outer eyewall decays and the inner eyewall retains (Yang et al. 2013). Although the inner eyewall typically decays and the outer eyewall contracts with intensification on a timescale of less than a day or two, multiple eyewalls can sometimes coexist for a longer period, or the outer eyewall decays earlier (Kossin and DeMaria 2016; Yang et al. 2013). Many physical mechanisms have been proposed for the SEF and ERC (as summarized in Stern et al. 2014a; Vigh et al. 2018), yet they are not fully understood.

Simplified models are known to reproduce the structure similar to a secondary eyewall. Nong and Emanuel (2003) and Emanuel et al. (2004) reported that an SEF-like structure is generated even with an axisymmetric model. Whereas SEF events are reproduced much less in an axisymmetric model, it may aid in the exploration of certain aspects of plausible mechanisms. Using a two-dimensional non-divergent barotropic model, a strong inner vortex representing the TC core can envelop neighboring weak vorticity patches, forming an SEF-like vorticity ring (Kuo et al. 2004). However, Moon et al. (2010) argued that the allocation of convection-induced small vorticity dipoles, which have comparable strength to the innercore vorticity and potentially better represent moist convective vorticity in the TC’s outer core, did not result in coherent concentric vorticity rings in barotropic two-dimensional flow. In contrast, Moon and Nolan (2010) successfully simulated a secondary horizontal wind maximum by prescribing the same vorticity dipoles using a three-dimensional model that calculates more sophisticated physical processes. These findings underscore the importance of considering the complexity of three-dimensional processes in capturing SEF TCs.
The SEF was associated with the upward motion outside the primary eyewall. In addition to subsidence induced by the updraft in the inner eyewall, Rozoff et al. (2006) proposed that rapid filamentation dominated by strain plays a crucial role in moat formation. This rapid filamentation distorts vorticity generation within a 30-minute timescale, impeding deep convection. Observations indicate that mature hurricanes typically exhibit a radial area with a slightly negative radial gradient of azimuthal-mean vorticity beyond the RMW at lower levels, known as a beta-skirt region (Mallen et al. 2005). Within this region, under conditions of rapid filamentation, sufficient convective available potential energy (CAPE), and low convective inhibition, sporadic convection can persistently occur. Building upon the framework of two-dimensional theory (Vallis and Maltrud 1993), Terwey and Montgomery (2008) argued that this convective energy likely upscales towards the tangential direction over the beta-skirt region, leading to the accumulation of a ring of low-level tangential jets outside the primary eyewall.
Energy in the SEF region can accumulate through the stagnation of vortex Rossby waves (Montgomery and Kallenbach 1997), which is related to the slowdown of the outward group velocity with increasing radial wavenumbers in the outer region. Some studies support the contribution of the accumulation of eddy kinetic energy near the stagnation radius to the SEF (e.g., Menelaou et al. 2012), while some studies do not (e.g., Qiu et al. 2010). In addition, humid outer environments can be one of the important factors for the SEF (Ge 2015). This is because the unstable condition is favorable for TC to establish a secondary eyewall in the outer region.
In the recent decades, numerical models have demonstrated the increasing ability in reproducing the SEF occurrence; however, there remains significant uncertainty in simulated SEF regarding the onset time and duration of ERCs, as well as in predicting changes in TC intensity and structure during ERCs. Three-dimensional high-resolution models with a horizontal grid spacing of less than a few kilometers are needed for reproducing the SEF and ERC (e.g., Houze et al. 2007). Analyzing the simulated Typhoon Sinlaku (2008), Wu et al. (2012) and Huang et al. (2012) identified a sequence of structural changes within and just above the boundary layer, and proposed an unbalanced dynamical pathway to SEF, which was further elaborated by Huang et al. (2018). Some elements of this unbalanced dynamical pathway were also revealed by numerical modeling data (Abarca and Montgomery 2013) and data collected from flight observations (e.g., Abarca et al. 2016; Didlake and Houze 2011). Taking a different perspective, Kepert (2013) proposed a formula showing the analytical solution for the frictionally-induced boundary layer updraft, and emphasized the coupling and positive feedbacks between the friction-induced updraft and the aloft convection. The hypothesis of Kepert (2013) was supported by Kepert and Nolan (2014), Zhang, F. et al. (2017a), Kepert (2017), and Kepert (2018).
As the tangential wind field expands preceding SEF, a corresponding augmentation in surface heat fluxes beyond the eyewall is anticipated. Cheng and Wu (2018) conducted numerical experiments where they applied various caps on surface winds, used for surface flux calculations, across different radial intervals, illustrating the importance of the WISHE mechanism in SEF and ERC. In these numerical experiments, SEF failed to occur when surface heat fluxes were markedly suppressed both inside and outside the SEF region. When surface heat fluxes were moderately suppressed within the same area, SEF initiation was delayed, and the intensity of both eyewalls diminished. Notably, the suppression of surface heat fluxes in the inner-core region had negligible impact on the outer eyewall evolution. Observations and numerical experiments have shown that SEF tends to occur under weak-to-moderate VWS conditions (Didlake et al. 2017; Zhang, F. et al. 2017). It implies the contribution of asymmetric features, such as a rainband. Other factors are known to be related to SEF. For example, no-ice sensitivity experiments displayed that the SEF was delayed without an ice phase (Terwey and Montgomery 2008).
The aforementioned mechanisms and speculations are not necessarily exclusive and may reflect different aspects of the same phenomenon. Alternatively, some characteristics may only be valid in certain special cases. The SEF and ERC are topics that have been continuously investigated. Very recent studies have covered the above-mentioned mechanisms in more detail, display evidence in real case observations, propose a new theory, and investigate special cases. Additionally, the decay of the inner eyewall was investigated. These advances are summarized in the following subsections.
3.1 Classification of SEF and ERC
Cheung et al. (2024) investigated a dataset of 87 secondary eyewall progressions primarily based on 89–92-GHz passive microwave imagery. In their works, the secondary eyewall is defined as the azimuthal coverage of at least 50 % surrounding the inner eyewall. They classified the first stage into two types: a spiral band stemming from the inner eyewall and an outer rainband. The former typically progressed into half-concentric coverage, and the latter progressed into the full-concentric coverage. The exit stage consists of two distinct categories: Replacement or no replacement. The “no replacement” can be further categorized into three types: the secondary eyewall fading on microwave imagery, the merging of the secondary eyewall with the inner eyewall and becoming a spiral rainband after the loss of concentricity. One common pathway is that an outer rainband develops into a fully concentric eyewall followed by an ERC, while another typical pathway involves an inner rainband forming a half-concentric eyewall without any replacement. ERC events favor more intense storms, weaker VWS and greater relative humidity.
3.2 Stationary band complex (SBC) and SEF
Based on airborne Doppler radar analysis, Didlake et al. (2018) argued that the SEF was initiated from an organized rainband complex comprising convective precipitation in the downshear-right and stratiform precipitation in the downshear-left to upshear-left (Fig. 9). This rainband complex remained quasi-stationary relative to the storm center, like the SBC discussed in Willoughby et al. (1984). In the downwind sections (left of the VWS) of the rainband complex, falling ice particles formed a wide and uniform precipitation band with predominantly stratiform characteristics. Stratiform precipitation in the SBC induced mesoscale descending inflow (MDI). This process aided in the expansion of the vortex circulation and transported mid-level low-equivalent potential temperature (θe) into the boundary layer. The updraft next to the MDI was seemingly caused by convergence and upward acceleration. It was induced by the negative buoyancy of MDI, entering the high-θe region in the boundary layer. This updraft and the MDI in the downshear-left quadrant increased the tangential velocity, and it yielded the axisymmetric structure of the secondary eyewall. This can explain why SEF events typically occur under weak-to-moderate VWS and why SEF is sensitive to the ice phases.

Vaughan et al. (2020) compiled a five-year climatology of the SBC based on passive microwave satellite data. They demonstrated that approximately 80 % of 84 SEF events were preceded by an SBC in the 6 h time window prior to SEF. The geometry of the SBC has higher azimuthal extent and lower crossing angle from 12–24 h before the SEF (Fig. 10). This suggests that SBC-associated dynamic processes are important for SEF. However, SBCs with substantial radial extent and high circularity without subsequent SEF were also detected in the dataset (Fig. 10c).

Yu and Didlake (2019) used idealized simulations with a full-physics three-dimensional model to investigate the response to a prescribed heating that mimicked the contribution of stratiform around spiral TC rainbands, similar to Moon and Nolan (2010). The heating structure represented a quasi-stationary rainband complex. The vortex response included the MDI and a low-level forced radial updraft inside the rainband heating. Stratiform-induced cold pool interacted with tangential flow of upwind warm air, and it caused the updraft through buoyancy. It clearly shows that the diabatic forcing of rainband is critical for triggering and sustaining the forced low-level updraft, which might lead to a SEF.
Yu et al. (2021a) and Yu et al. (2022) further investigated the role of the stratiform rainband processes using a full-physics simulation of Hurricane Matthew (2016). Yu et al. (2021a) focused on the tangential velocity in the pre-SEF stage. Under a moderate VWS, the storm developed a quasi-SBC that aligned with the shear vector. Prior to the SEF, the storm experienced a broadening of the tangential velocity, which was largely by horizontal advection of momentum according to MDI in the downshear-left stratiform region. The MDI was connected to the boundary layer in the upshear-left quadrant, and convections were induced along its inner edge. It helped develop the maximum of low-level tangential velocity within the incipient secondary eyewall. Yu et al. (2022) focused on the emergence, maintenance, and impact of these persistent updrafts which developed within the left-of-shear quasi-SBC. Updraft initiation was based on the process described by Yu and Didlake (2019). In this process, buoyancy advection resulted from an MDI-induced cold pool interacting with the high-θe air in the inner core. A budget analysis of θe demonstrated that the updrafts in the left of the VWS were maintained by enhanced moist instability due to differential horizontal advection in the boundary layer. A potential vorticity (PV) budget showed that these updrafts generated PV anomalies that propagated cyclonically downwind. The propagation of PV anomalies downstream increased the azimuthal mean PV at the radius of the SEF, corresponding to the axisymmetrization of the secondary eyewall itself. These studies provide a dynamical explanation, as illustrated in Fig. 9, of how stratiform rainband processes can explain the SEF in a sheared, mature TC. Recent studies, such as those by Wang and Tan (2020), Zhu et al. (2022), and Kasami and Satoh (2024) demonstrated a similar MDI pathway to SEF in their modelling studies. Wang et al. (2019a) conducted an idealized simulation under the axisymmetric environment on an f-plane, yet the rainband contributed the simulated SEF in a similar manner.
Recent observational evidence of this stratiform pathway to the SEF has also been presented (Fischer et al. 2020; Kanada and Nishii 2023; Razin and Bell 2021). Fischer et al. (2020) examined the RI and associated ERCs of hurricane Irma (2017) using flight-level and airborne radar observations, microwave satellite observations, and model-based environmental analyses. Irma’s RI event included two short ERC episodes (less than 12 h). During the first SEF event, the upward motion and tangential velocity had a secondary peak at the forefront of the MDI. Kanada and Nishii (2023) focused on ground radar-based observations of the outer eyewall formation and inner eyewall weakening of TC Hinnamnor when it approached to Okinawa’s main island in 2022. They revealed that an SBC developed in the down-to-left quadrant of a moderate VWS that turned into an outer eyewall. As the VWS weakened, the SBC became more axisymmetric, and a weakly convective “moat” region appeared between the outer and inner eyewalls.
3.3 Boundary layer processes
The importance of boundary layer processes on SEF has been reconfirmed by many studies. Kepert (2018) developed a boundary layer model for TC rainbands. The boundary layer flow yields a strong low-level convergence and consists of an updraft along the rain-band and some region located downwind. The upper boundary layer has a marked wind peak along the band that was approximately 20 % stronger than the balanced flow. Therefore, the secondary peak of wind at the SEF region can be explained by the boundary layer dynamics near a rainband. Yu et al. (2021b) investigated the SEF using the Kepert (2018) nonlinear boundary layer model and storm composites of tangential wind observations from Wunsch and Didlake (2018). For the pre-SEF composite, the boundary layer model response exhibited clear secondary maxima in the updrafts, tangential wind, and radial inflow in the left-of-shear quadrant, which contributed substantially to the azimuthal mean. This finding suggests that, leading to SEF, the earliest signal of coupling with the boundary layer and free troposphere is likely to occur in these left-of-shear sectors. As this is also the same region where the MDI triggered new updrafts in previous studies on individual storms, these studies support the idea that the rainband complex process detailed in the previously discussed studies is likely a prevalent mechanism for SEF in sheared storms.
Huang et al. (2012) and Wu et al. (2012) identified dynamical processes consistent with unbalanced boundary layer features such as supergradient wind, and their contributions to SEF were revealed by the momentum budget of tangential and radial winds (Huang et al. 2018). These findings continue to be demonstrated in many studies (Ahern et al. 2022; Chen 2018; Guan and Ge 2018; Persing and Montgomery 2022; Razin and Bell 2021; Wang et al. 2019a; Wang et al. 2018; Wang and Tan 2020, 2022). Most of these studies emphasized the cooperation of this boundary layer pathway with other mechanisms occurring in an aloft-free atmosphere, such as the asymmetric dynamics associated with outer rainbands.
Miyamoto et al. (2018) proposed that the SEF can be attributed to the instability of the flow in a free atmosphere coupled with Ekman pumping. Vertical wind perturbation is damped in the classic Ekman theory, which considers slow flow in a horizontally uniform structure. Meanwhile, a positive feedback mechanism for vertical wind perturbation works in curving fast flows. This instability tends to be satisfied when an angular velocity is high, absolute vertical vorticity is low, radial gradient of angular velocity is small and negative, and gradient of vertical vorticity is strongly negative. In their setup, the unstable condition is satisfied only between two and seven times the RMW. They verified that the necessary condition for this instability was satisfied in the SEF simulated using a full-physics three-dimensional model.
3.4 SEF/ERC in a sheared environment
Liu et al. (2022) and Wang and Tan (2022) reproduced the SEF/ERC in simulations under moderate-strong VWS and weak to moderate VWS to a vortex with maximum wind at approximately 45 m s−1 and 70 m s−1 (or stronger), respectively. They found that increasing the VWS caused earlier SEF through the formation of outer rainbands. Moreover, Wang and Tan (2022) showed that a vortex with a larger outer core size or a stronger outer wind field could undergo ERC in a non-sheared or strongly sheared environment. In a simulation of Hurricane Earl (2010), Ahern et al. (2022) argued that Earl’s azimuthal asymmetry in low level wind and thermal fields affects the azimuthal structure of the broadening of low-level swirling winds; therefore, the secondary maximum winds first appear in the downshear-left quadrant. Low-level azimuthal asymmetry was related to moderate-to-strong VWS and asymmetric friction due to TC motion. By analyzing satellite data, Yang et al. (2021) demonstrated that during ERCs, the mean VWS in the environment for long-lived (longer than 20 h) and short-lived ERC events were weak and moderate, respectively.
3.5 Development of warm-core ring and moat prior to SEF
In an idealized numerical simulation, Wang et al. (2019b) found that an off-center warm ring in the upper level outside the eye emerged prior to the SEF and during the broadening of the tangential wind field, and then rapidly strengthened after the SEF. They suggested that this off-center warm ring is a plausible indication of the subsequent occurrence of SEF. Qin et al. (2021) performed a semi-idealized simulation of Typhoon Matsa (2005) and found that the moat formed with a well-developed anvil cloud extending outward from the eyewall. Beneath the anvil cloud, the heating-induced inflow appeared to enhance sublimation cooling by drying local conditions. Subsidence is further enhanced by the downward motion that compensates the strong updraft in the eyewall. Furthermore, the strong filamentation effect and reduced ambient VWS facilitated the axi-symmetrization of the moat and SEF. The authors suggested that a strong eyewall with a well-developed anvil in strength and space may favor SEF when the VWS environment transitions from moderate to weak magnitude. This feature is supported by an observational study (Kanada and Nishii 2023).
3.6 Role of VRWs
Several studies have investigated the role of vortex Rossby wave activity and examined its role in the SEF or intensity/structure change during an ERC process. Fischer et al. (2020) indicated that the theoretical values of VRW’s stagnation radius, provided by Montgomery and Kallenbach (1997), are close to the SEF regions of Hurricane Irma (2017). Guimond et al. (2020) presented evidence of VRW activity in the outer eyewall of Hurricane Matthew (2016) under moderate to strong VWS. After ERC completion, Hurricane Matthew did not reintensify as it contracted, in addition, it was not substantially weakened under the high shear environment. Cha et al. (2021) investigated the ERC process of Hurricane Matthew using ground-based and airborne radars. During the ERC, the VRW damping mechanism proposed by Reasor et al. (2004) could assist the vortex resiliency and resistance to increasing VWS. The AAM budget analysis by Guimond et al. (2020) also indicated that VRW dynamics appear to build up a second SEF event. Flight-level observations of Hurricane Matthew (2016) displayed secondary peaks of tangential velocity where VRW were active, implying their connection to the SEF process.
3.7 Barotropic and baroclinic instability during the ERC
Observations have shown that the location of inner eyewall often wobbles with a cycloidal track when multiple eyewalls form. Menelaou et al. (2018) demonstrated that the wobbling comes from the wavenumber-1 instability that grows exponentially in a three-dimensional framework (Fig. 11). This instability can be interpreted as the coupling of two baroclinic VRWs across the moat. In contrast, this wobbling was not reproduced in a two-dimensional barotropic model framework unless an asymmetric condition is provided at the initial time. The interaction of multiple eyewalls also affects the intensity and other structures substantially.

The inner eyewall of Hurricane Wilma (2005) became elliptic (Fig. 12; Lai et al. 2019), and the radial flow had significant wavenumber-2 component at lower levels as wavenumber-1 component weakened. Using a nondivergent barotropic model, they showed that this structure was developed through barotropic instability across the moat in which the sign of radial vorticity gradient changed (referred to as type-2 instability; Kossin et al. 2000). The inner eyewall significantly decays due to the development of wavenumber-2 radial flow. With a three-dimensional full-physics model, Lai et al. (2021b) pointed out that the inner eyewall decay corresponded to the net negative radial advection after the elliptic structure developed through the type-2 instability. It suggests that the eddies that develop under concentric eyewall condition can significantly weaken the inner eyewall, as well as the cutoff of moisture transport in the boundary layer. This finding is supported by the observation-based study of Tsujino et al. (2021).

Lai et al. (2021b) also mentioned that an idealized simulation with physics parameterization schemes turned off can intensify the outer eyewall in addition to the inner eyewall decay. Lai et al. (2021c) investigated the interaction between the inner eyewall and outer eyewall using an unforced shallow-water model. The radial eddy transport due to VRWs that developed through the type-2 instability can explain the inner eyewall weakening and outer eyewall intensification. In terms of AAM budget, the inner eyewall weakening and outer eyewall intensification can be viewed as divergence and convergence of the eddy angular momentum flux, respectively.
While the above-mentioned studies discuss the early stage of eddies developing according to the type-2 barotropic instability, Lai et al. (2021a) investigated the impacts for a longer period using forced and unforced shallow-water equations. The inner eyewall weakening and outer eyewall intensification repeatedly appear associated with the development of eddies. They also implied that the difficulty in the prediction of intensity changes during ERCs partly stems from type-2 instability.
Rostami and Zeitlin (2022) indicated that a robust tripolar vortex structure emerges during the late stages of the type-2 barotropic instability of double eyewall TC-like vortices when the intensities of the eyewalls are comparable with a moist-convective shallow-water model. This tripolar structure is more complicated than those in the studies employing two-dimensional nondivergent barotropic models, rotating shallow water models or laboratory experiments. Slocum et al. (2023b) demonstrated the type-2 instability by using a two-dimensional nonlinear nondivergent barotropic model with a simplified vorticity profile of Hurricane Maria (2017). Their results indicated that the type-2 instability may occur near the end of an ERC and yield a tripolar vorticity structure.
3.8 Decay of the inner eyewall
Using tangential winds estimated from Himawari-8 satellite data, Tsujino et al. (2021) demonstrated that momentum loss to surface friction could not sufficiently explain the inner eyewall intensity decay rate during the ERC of Typhoon Trami (2018). They suggested that eddies also weaken the inner eyewall. Based on a series of slab boundary layer model experiments, Kuo et al. (2022) proposed a scaling law in which inner eyewall pumping is proportional to storm intensity and the root square of a non-dimensional moat size (the actual moat size normalized by the Rossby length). From this perspective, they explained why satellite observations often document wider moats in long-lived ERCs (Yang et al. 2021).
Using idealized simulations, Yang et al. (2024) showed that the decay of the inner eyewall occurs earlier following the onset of an outer eyewall if the initial vortex is small and weak. They demonstrated that spiral rainbands of a large and strong TC were more active outside of the outer eyewall. These active rainbands reduced the inward-penetrating inflow toward the outer eyewall, slowing down the contraction and intensification of the outer eyewall. This prolonged the duration of the concentric eyewall structure.
3.9 Special ERCs cases
Molinari et al. (2019) summarized several unusual features of ERCs during Hurricane Frances (2004). It underwent three consecutive ERCs that resulted in an annular eyewall structure, which is rarely observed during Pacific typhoons. It has been proposed that unusual easterlies in the upper levels produce an environment with low inertial stability. This persistently low inertial stability in the outflow layer contributes to an anomalously strong outflow and faster intensification of the outer eyewall, resulting in multiple ERCs and shorter ERC durations.
Using airborne radar observations, Razin and Bell (2021) analyzed the unconventional ERC of Hurricane Ophelia (2005), which underwent two ERC events at category-1 intensity and over a low SST, at approximately 23 °C. Their results supported two previously proposed pathways to SEF; one is due to stratiform heating of TC rainbands (Didlake et al. 2018), while the second is associated with the unbalanced boundary layer dynamics (Huang et al. 2012).
Wang and Wang (2021) conducted sensitivity experiments on the decay of the original eyewall and the genesis of an outer eyewall as TC Megi (2011) crossed Luzon Island. The original inner eyewall was not fully destroyed over flat land, highlighting the importance of topography. Additionally, short-lived deep convection (possibly a new inner eyewall) developed after the center of TC Megi (2011) moved into the South China Sea due to favorable oceanic conditions for deep convection. Lau et al. (2024) also investigated island-induced eyewall formation in the case of TC Mangkhut (2018). Their findings generally align with those of Wang and Wang (2021). Furthermore, Lau et al. (2024) analyzed their results from the perspective of unbalanced dynamics.
3.10 Other perspectives
The impact of TC-induced SST cooling, ocean waves, radiation, and data assimilation on the SEF and ERC has been addressed in several studies. Yang et al. (2020) and Li, X. et al. (2022) demonstrated that the inclusion of TC induced SST cooling and ocean waves led to a simulated ERC duration that better matched observations. Yang et al. (2020) displayed that when both the ocean and waves were considered, the lifetime of the ERC was significantly prolonged for Typhoon Sinlaku (2008). According to Li et al. (2022a), the exclusion of the SST cooling associated with slow TC motion resulted in an impractically long ERC during Typhoon Trami (2018). In this case, the substantial negative feedback likely reduced the energy supply to the inner eyewall more severely. Because these results seem oppositional, further investigation is needed to clarify the impact of a coupling as well as the relevant mechanism.
Trabing and Bell (2021) showed that the magnitude of shortwave radiation affects the SEF timing through nonlinear interactions at longer lead times. Generally, shortwave radiation served to delay the SEF and ERC. The proposed mechanism is that the shortwave radiation alters the convective and stratiform heating profile and frequency, and it stabilize the atmosphere and reduces the CAPE.
4. Operational analysis and forecast
Utilizing information about the inner core structure such as RMW in an operational setting to forecast structural changes and the wider implications for TC intensity prediction is challenging. Operational centers have assessed inner core structural changes with the aid of existing and developing operational tools. Combining subjective assessments of inner-core changes with the available objective guidance remains the leading operational methodology. Although all available data are useful for the assessment by forecasters and analysts, the availability and manual assessment of satellite imagery is essential. The inner core structural change is important for the TC intensity estimate because satellite analysts at operational centers examine satellite images and utilize the Dvorak Technique to derive a current intensity (CI) number, which is one of important sources of TC intensity (Dvorak 1984). In this section, the operational analysis and forecasting of the TC inner core structure, use of tools, and relevant research are described. Regarding the surface wind estimation, readers may refer to Knaff et al. (2021), which is a nice review for operational center practices, historical databases, current and emerging objective estimates of TC surface winds, including algorithms, archive datasets, and individual algorithm strengths and weaknesses.
4.1 Operational analysis of RMW
The RMW can be operationally used for various purposes: 1) to monitor inner core structural changes associated with SEF, ERC, and RI; 2) to estimate central pressure; 3) to correct numerically simulated wind fields (e.g., Aijaz et al. 2019), 4) to potentially aid diagnostic intensity forecasts (e.g., Carrasco et al. 2014), and 5) to forecast waves and storm surges. Considering the importance of the RMW to the TC wind structure, a questionnaire was conducted to collect operational practices on the method of RMW analyses. The questions were:
“Q1: Does your operational center analyze the RMW routinely and include it in your post-analysis best track?
Q2-1: If yes to Q1, please describe the method of analysis with possible references such as research papers, documents, memorandum, etc.
Q2-2: If no, please select the reasons (check all that apply). 1. Lack of observations, 2. Lack of methods, 3. No needs, 4. Others”
The respondents to the questionnaire were Regional Specialized Meteorological Center (RSMC) Miami, RSMC Tokyo, RSMC La Réunion, RSMC Nadi, Tropical Cyclone Warning Centre (TCWC)-Australia, TCWC-Wellington, and Joint Typhoon Warning Center (JTWC). Of the seven respondents, four indicate that their center analyzes RMW in real-time, two centers do not analyze RMW, and one center analyzed RMW in real time however they do not conduct post-analysis/quality control. The answers to these questions are summarized in Tables 1 and 2.
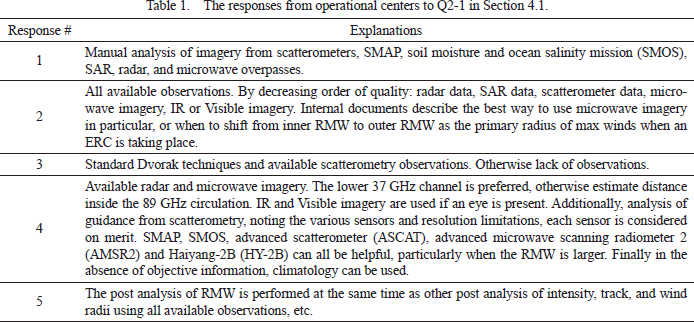

For centers that generally analyze RMW, a manual assessment of all available observations was the primary method. Radar, scatterometry, passive microwave (37 GHz and 89 GHz frequencies), and visible imagery, as well as Synthetic Aperture Radar (SAR), Soil Moisture Active/Passive (SMAP), and Soil Moisture and Ocean Salinity Mission (SMOS)-derived wind speeds are analyzed, with preference for the highest quality data. Climatology is occasionally used in the absence of real-time observations. Internal documents describe the best practices for analysis, particularly for microwave imagery, as well as the procedures for shifting from the inner RMW to the outer RMW as the primary radius of maximum winds when an ERC is taking place. Post-analysis of the RMW is performed coincidentally with other parameters, such as position and intensity. Centers that do not routinely analyze RMW cited the sparsity of observations, lack of operational requirements, non-standard structures such as monsoon gyres, and temporal inhomogeneity of supporting datasets.
From a research community, Tsukada and Horinouchi (2023) recently proposed the improved method of IR-based RMW estimation for a TC with a clear eye, following up the work of Kossin et al. (2007). Compared with C-band SAR sea-surface wind estimates, the mean absolute error of 4.7 km in previous studies was reduced to 1.7 km. Chavas and Knaff (2022) developed a simple semiempirical model to estimate the RMW using operationally available parameters, including an outer wind radius, the Coriolis parameter, and maximum wind speed. The empirical model is based on the physical understanding of the radial structure of TCs (Chavas and Lin 2016; Emanuel and Rotunno 2011; Emanuel et al. 2004). Chavas and Knaff (2022) showed that the model estimates RMWs with much better accuracy than previous methods (e.g., Knaff et al. 2011, 2015). Additionally, Avenas et al. (2023) applied the method of Chavas and Knaff (2022) to estimate RMWs using outer wind radii derived from satellite radiometers and scatterometers and SAR-derived RMWs as ground truth.
4.2 Operational assessment of ERCs
Although the predictability of an ERC event is low, efforts have been continuing. As ERC affects intensity trends and anticipated impacts, predicting the onset and completion of ERC remains an important challenge for operational centers. While high resolution numerical weather prediction models can resolve ERCs, the variability in predictions and low skill limit their applicability in operational settings. In many cases, the models indicated an ERC event, however the timing is incorrect. Applying hourly data assimilation cycling to the simulations of Hurricane Matthew (2016), Green et al. (2022) showed that concentric eyewalls could be better resolved by the inclusion of ground-based radar observations. Assimilating radar observations more rapidly reduced the bias of the storm structure, indicating the importance of an improved representation of the initial TC structure in forecasting the ERC process.
Considering the limitations of high-resolution modeling, forecasters at National Hurricane Center (NHC), Central Paciffic Hurricane Center (CPHC), JTWC, RSMC La Réunion and Bureau of Meteorology (BoM) assess the University of Wisconsin Cooperative Institute for Meteorological Satellite Studies (CIMSS) Microwave Probability of Eyewall Replacement Cycle (M-PERC) tool (Kossin et al. 2023; available online at https://tropic.ssec.wisc.edu/real-time/archerOnline/web/index_erc.shtml) to assist ERC prediction. M-PERC, which was developed using Atlantic data, applies a logistic regression probabilistic model to evaluate the environmental conditions that favor ERC. Evaluation of M-PERC indicate that the algorithm efficiently depicts ERC events in all ocean basins despite the Atlantic focused training of the model. Independent validation of the model using a climatological probability of ERC of 13 % yielded a Brier skill score of 35 %. Additionally, Pulmano and Joykutty (2021) found that for Atlantic Basin TCs between 2017 and 2019, the algorithm correctly predicted approximately 41 % of the total ERC events. The model was trained on SEF events that lead to ERC and thus model probabilities will rise with SEF development and intensification of the outer ring regardless of where the ERC completes or not. Pulmano and Joykutty showed that this can at times lead to higher probability events in the presence of dry air environments at higher latitudes that do not result in completion of the ERC. In addition, Kossin et al. (2023) noted the intensity evolution of ERC events as a function of TC intensity and found that the previous paradigm of TC weakening as result of an ERC should be modified to note a change in intensification rate instead. Kossin et al. (2023) shows TC intensification rate changes during ERC events which indicates a slowing of intensification for storms undergoing ERCs for Category 1–2 storms whereas storms at Category 3 intensity or stronger are more likely to undergo weakening (Fig. 13). Lower probability ERC events indicated by M-PERC may occur during the RI phase with the ERC resolving quickly and only resulting in a brief pause in RI on the order of 12 hours with RI resuming once the ERC is completed. An example of this occurred during the RI of Hurricane Dorian in 2019 on August 29th which was confirmed by aircraft reporting concentric eyewalls with the inner eye diameter of only 4 nautical miles.

Operational centers either use or anticipate tools such as M-PERC, raw microwave satellite imagery, statistical-dynamical models, and lightning data to predict the intensity fluctuations associated with changes in the inner core structure. A case study in the 2020 JTWC Annual Tropical Cyclone Report highlighted the successful prediction of multiple ERC events for TC 25P (Harold) using M-PERC algorithms, demonstrating the value of the tool for anticipating the associated short-term intensity fluctuations (typically a slight weakening prior to re-intensification) in an operational setting (Francis and Strahl 2021). Additionally, the BoM reported frequent use of microwave imagery to provide short-term subjective predictions of inner core structural changes and related intensity fluctuations. For example, a visual assessment of the ERC evident in passive microwave imagery influenced the operational decision-making for TC Trevor (2019). The system was approximately 12 h from landfall at CI 5.0/80 knots in a very favorable broad scale environment. Intensification at or above the standard Dvorak rate would lead to Category 4 (Australian system −90–105 knot 10 min. mean wind) landfall forecasts were credible. However, based on the double eyewall structure evident in the special sensor micro-wave/imager (SSMI) microwave imagery (Fig. 14), a subjective judgment was made that the inner eyewall would likely decay over the next 12–18 h leading to little intensification over that period, therefore the landfall forecast was limited to Category 3. In this case, this is what unfolds (Tony Wedd, Senior Meteorologist, BoM).

Rapid intensification can be preceded by inner core changes, as shown by Li, Y. et al. (2022) who used the best-track dataset for the North Atlantic and Eastern North Pacific during 1999–2019 to examine the statistical relationship between the rapid contraction of the RMW and RI. Their findings demonstrated that rapid RMW contractions were frequently followed by RI. Operationally, forecasters subjectively assess passive microwave imagery and other satellite imagery to identify processes such as contraction of the inner core as indicators of intensity change. Intensity tools aim to capture these processes by placing various levels of emphasis on each process, depending on their predictive value. The well-known statistical hurricane intensity prediction scheme (SHIPS; DeMaria et al. 2005) incorporated the IR brightness temperature parameter derived from IR satellite data. The Rapid Intensification Prediction Aid (RIPA), which provides statistical guidance for predicting the likelihood of RI in the western North Pacific and other basins, incorporates IR brightness temperatures, core size, and core symmetry as predictor variables. RIPA has been used operationally at the JTWC since late 2017 (Knaff et al. 2020).
Observational data have been used to validate physical parameterizations in operational TC forecast models. Composites of global positioning system (GPS) dropsondes, Doppler radar and Stepped Frequency Microwave Radiometer (SFMR) data have been used to evaluate the performance of the forecasted TC structures which lead to identification of model deficiencies (e.g., Zhang et al. 2015). Observation based new parameterizations of turbulent mixing have been implemented in U.S. operational TC models [e.g., Hurricane Weather and Research Forecasting System (HWRF)], which led to significant improvement in hurricane intensity forecasts as well as RI prediction (Zhang et al. 2015, 2018).
Operational forecasters consider the potential applicability of inner core lightning data for their forecast processes, particularly considering the limited availability of high-resolution microwave imagery, which is typically necessary to reveal rapidly changing inner core structures. The lightning data from TC Harold (2020), which underwent multiple periods of rapid intensification, indicated patterns that were highly consistent with the documented relationships between increased inner core lightning density and intensification (Francis and Strahl 2021; Lin and Chou 2020; Stevenson et al. 2018). Operational forecasters consider lightning density as a possible forecasting aid, and the lightning-based model is running in parallel and demonstration mode at NHC for the Atlantic and eastern Pacific using GOES-16 and GOES-18 geostationary lightning mapper (GLM) data (Slocum et al. 2023a). Further studies are needed to identify reliable lightning indicators that are valid for all basins and can be used as tools to predict intensity changes, particularly for RI.
Finally, the ingestion of dry air into the inner core is associated with rapid weakening. Forecasters report using satellite imagery, including Morphed Integrated Microwave Imagery at the Cooperative Institute for Meteorological Satellite Studies (MIMIC) total precipitable water loops, to identify inner core erosion due to dry air intrusion and VWS. However, assessing satellite imagery is a subjective process, and reliably determining the extent and effects of dry air intrusion into the inner core remains a forecasting challenge.
5. TC inner core structure change in future climate
The horizontal scale of a TC affects the size of the damaged area caused by strong winds and waves, attracting socioeconomic interest. Future changes in TC inner core structure are also an important issue. Some studies have investigated future changes in TC size (Knutson et al. 2020). Gutmann et al. (2018) evaluated the influence of global warming on the size of TCs using the WRF model and indicated that although the influence depended on individual TCs, the mean size across all TCs did not change significantly owing to global warming. Wehner (2021) reported that climate change does not influence the average radial distribution of a simulated TC on a specified Saffir-Simpson scale, at least when using the National Center for Atmospheric Research (NCAR) Community Atmosphere Model version 5.1 with a horizontal grid spacing of 25 km. Song et al. (2020) showed that TC size would increase under quadruple CO2 forcing over all ocean basins except the North Atlantic and North Indian Oceans using SEM0-UNICOM. As introduced here, the results obtained in previous studies are inconsistent, which is partly due to differences in the definition of TC size, experimental design, and model. Knutson et al. (2020) emphasized that “future studies should further assess model capabilities of simulating present day TC sizes, which has so far been done only to a limited extent. A better understanding of the mechanisms determining TC sizes in observations and models is important, as is the monitoring and accumulation of observed climate records of TC size.”
In general, TCs are in a mature stage in the tropics and consist of a strong rotating circulation with a large axisymmetric component. As TCs transition into the mid-latitudes, their structures become more asymmetric owing to the baroclinic environment in the midlatitudes. Typhoon Faxai in 2019 made landfall in the Tokyo metropolitan area at a latitude of approximately 35°N with a central pressure of 960 hPa, and caused severe damage owing to strong winds. The intensity of Faxai exceeded the maximum potential intensity, which was attributed to Faxai maintaining an axisymmetric structure similar to that of a well-developed TC in the tropics well after a TC would normally begin an extratropical transition. This was due to favorable environmental conditions such as relatively weak VWS (Miyamoto et al. 2022). It is unclear whether the environmental conditions before Faxai made landfall in Japan are associated with global warming. However, there is an urgent need to address the impacts of global warming on TC structure in the mid-latitudes where large cities and densely populated areas are located. Using a nonhydrostatic regional model with a horizontal resolution of 0.04°, Kanada et al. (2020) conducted approximately 100 dynamical downscaling experiments for mid-latitude typhoons in both current and warming climates (Fig. 15). In a future warmer climate, the extratropical transition position of TCs will shift to higher latitudes owing to higher SST, larger near-surface water vapor content/capacity, and smaller baroclinicity compared to the current climate conditions. The results of Fujiwara et al. (2023) were consistent with these results; they also showed that eyewalls become deeper in warmer climates. This will likely facilitate TCs intruding further into mid-latitude regions while retaining an axisymmetric structure, intensity, and smaller radius of maximum winds, as observed in the tropics.

Changes in several recent destructive TCs have also been studied using convection-permitting regional climate model simulations under pre-industrial, current, and future climate conditions (Patricola and Wehner 2018). The results indicate significant rainfall contraction and enhancement in the core regions of storms simulated in future warmer climate conditions and suggest that climate change has likely begun to enhance rainfall for recent destructive TCs.
6. Concluding remarks
This paper compiled recent publications and relevant information on research and operational use of TC inner core structural changes with an overview of conventional understanding. These are summarized as follows:
-
• The changes in the inner core structure during each intensity stage are described in detail. Many studies have focused on non-conventional distinctive structures such as dual warm cores, mid-tropospheric maxima in wind speed, short-lived deep convective clouds in the eye region, and finger-like features from both observational and modeling perspectives. The numerical simulations confirm the dependence of the RMW on the size and humidity of the outer core region. Non-axisymmetric structures, including those related to VWS, as well as contributions from factors such as translation speed, interactions with the land and ocean, and transformations from high-frequency components have advanced. A comparison with dry TCs suggests the potential impact of falling hydrometeors on the depth of the inflow layer and the size of the inner core.
-
• Observations and numerical simulations have focused on the transformation of the SBC into a secondary eyewall. Diabatic cooling from rain in the SBC causes MDI, which triggers enhanced convection in the upshear region. The axisymmetrization of the enhanced convection finally yielded a secondary eyewall. Also, many studies have reconfirmed the importance of boundary layer dynamics in the SEF region. From a dynamical perspective, the interaction between the inner and outer eyewall vortices has been applied to explain the enhanced wobbling and decay of the inner eyewall or the persistence of multiple eyewalls. Some studies have investigated the environmental conditions required for special multiple eyewall events. As such, both dynamical and thermodynamical processes have been proposed in the boundary layer and free atmosphere for multiple eyewalls, and the understanding of the SEF and ERC has progressed over the last several years. However, further studies are needed to clarify whether they are complementary or exclusive, and whether they are case dependent.
-
• With the progress in understanding the inner core structure, many operational agencies have started to utilize information on the inner core structure for disaster prevention and mitigation. The questionnaire to operational centers revealed that five operational agencies had already analyzed the RMW of TCs based on available observations with a preference for the highest quality data. Some agencies have begun to use guidance and subjective analyses to analyze and/or predict SEF and ERC. Inner core lightning activity and dry air intrusion from satellite observations were investigated for use in operational analysis and forecast. In-situ observations were used to improve model physics with a focus on turbulent mixing.
-
• Studies on climatological changes in the inner core structure are limited or unreliable owing to the high computational cost and diversity of the results. However, several publications have reported an increase in the inner core rainfall amount, an axisymmetric structure maintained at higher latitudes using regional climate models.
Building upon prior studies, extensive research has been conducted on structural changes in the TC inner core during various phases, SEF and ERC. Consequently, our knowledge of TC inner core structure has significantly advanced in recent years. However, some controversies and fragmented understandings still remain. It is essential to appropriately assess each result in terms of methodological reliability and strive for a more generalized perspective. It requires refinement in observational methodologies and numerical simulations, as the TC inner core is not easily observable. On one side, some operational agencies have already begun analyzing the RMW and concentric eyewalls using both existing and new tools. Although standardizing methodologies is challenging, enhanced international communication among operational centers and researchers is expected to foster advancements in publishing valuable information for TC-related disaster prevention based on updated insights. Further research on the impact of climate change on TC inner core structure is recommended. To make this more feasible, further model improvements and development of a kilometer-scale climate model (Miura et al. 2023) will be required, which demands huge computational resources. It is also worthy of note that machine learning and artificial intelligence techniques have been growing rapidly as a tool which may yield the new insight on the TC inner core research and operation.
Abbreviations

Data Availability Statement
This paper is a review article based on the recent publications, answers to questionnaires, and experiences of forecasters. See the paper and/or contact the corresponding author of the paper for the detailed data availability. Regarding the questionnaires and forecasters’ experiences, contact Kosuke Ito for more details.
Acknowledgment
This paper was based on the report “TC structure change processes: Inner core” for 10th International Workshop on Tropical Cyclones (IWTC-10). We appreciate the contribution of Dr. Margie Kieper, who passed away on 25 April 2024. Kosuke Ito was supported by JST Moonshot R&D Grant Number JPMJMS2282-06 and JSPS KAKENHI Grant Numbers JP21H04992 and JP23K26359. Yoshiaki Miyamoto was supported by JSPS KAKENHI Grant Numbers JP18H05872, JP19H05696, JP19H01973, JP19K04849, and JP19K24677. Chun-Chieh Wu and Yi-Hsuan Huang was supported by the National Science and Technology Council of Taiwan through Grant NSTC 112-2123-M-002-002, and Chun-Chieh Wu was also supported by the Office of Naval Research through Grant N00014-20-1-2467. James Hlywiak was supported by U.S. National Science Foundation (NSF) PREEVENTS Track 2 Award 1663947. Yohei Yamada was supported by JST Moonshot R&D Grant Number JPMJMS2282-10, JSPS KAKENHI Grant Numbers JP20H05728, and MEXT as “Program for promoting researches on the supercomputer Fugaku” JPMXP 1020200305. Jun Zhang was supported by U.S. NOAA Grants NA21OAR4590370, NA22OAR4590178, and NA22OAR4050669D, Office of Naval Research Grant N00014-20-1-2071, and U.S. NSF Awards 2228299 and 2211308. Sachie Kanada was supported by JSPS KAKENHI Grant Numbers JP19H05696, JP20H05166 and MEXT-Program for the advanced studies of climate change projection SENTAN Grant Number JPMXD0722680734. We thank to Dr. Christopher Slocum who gave us comments on the operational use of lightning-based guidance.
References
- Abarca, S. F., and M. T. Montgomery, 2013: Essential dynamics of secondary eyewall formation. J. Atmos. Sci., 70, 3216–3230.
- Abarca, S. F., M. T. Montgomery, S. A. Braun, and J. Dunion, 2016: On the secondary eyewall formation of Hurricane Edouard (2014). Mon. Wea. Rev., 144, 3321–3331.
- Ahern, K., M. A. Bourassa, R. E. Hart, J. A. Zhang, and R. F. Rogers, 2019: Observed kinematic and thermodynamic structure in the hurricane boundary layer during intensity change. Mon. Wea. Rev., 147, 2765–2785.
- Ahern, K., R. E. Hart, and M. A. Bourassa, 2021: Asymmetric hurricane boundary layer structure during storm decay. Part I: Formation of descending inflow. Mon. Wea. Rev., 149, 3851–3874.
- Ahern, K., R. E. Hart, and M. A. Bourassa, 2022: Asymmetric hurricane boundary layer structure during storm decay. Part II: Secondary eyewall formation. Mon. Wea. Rev., 150, 1915–1936.
- Aijaz, S., J. D. Kepert, H. Ye, Z. Huang, and A. Hawksford, 2019: Bias correction of tropical cyclone parameters in the ECMWF ensemble prediction system in Australia. Mon. Wea. Rev., 147, 4261–4285.
- Alvey III, G. R., and A. Hazelton, 2022: How do weak, Misaligned tropical cyclones evolve toward alignment? A multi-case study using the hurricane analysis and forecast system. J. Geophys. Res.: Atmos., 127, e2022JD037268, doi: 10.1029/2022JD037268.
- Alvey III, G. R., E. Zipser, and J. Zawislak, 2020: How does Hurricane Edouard (2014) evolve toward symmetry before rapid intensification? A high-resolution ensemble study. J. Atmos. Sci., 77, 1329–1351.
- Avenas, A., A. Mouche, P. Tandeo, J.-F. Piolle, D. Chavas, R. Fablet, J. Knaff, and B. Chapron, 2023: Reexamining the estimation of tropical cyclone radius of maximum wind from outer size with an extensive synthetic aperture radar dataset. Mon. Wea. Rev., 151, 3169–3189.
- Carrasco, C. A., C. W. Landsea, and Y.-L. Lin, 2014: The influence of tropical cyclone size on its intensification. Wea. Forecasting, 29, 582–590.
- Cha, T.-Y., M. M. Bell, and A. J. DesRosiers, 2021: Doppler radar analysis of the eyewall replacement cycle of Hurricane Matthew (2016) in vertical wind shear. Mon. Wea. Rev., 149, 2927–2943.
- Chavas, D. R., and N. Lin, 2016: A model for the complete radial structure of the tropical cyclone wind field. Part II: Wind field variability. J. Atmos. Sci., 73, 3093–3113.
- Chavas, D. R., and J. A. Knaff, 2022: A simple model for predicting the tropical cyclone radius of maximum wind from outer size. Wea. Forecasting, 37, 563–579.
- Chavas, D. R., N. Lin, and K. Emanuel, 2015: A model for the complete radial structure of the tropical cyclone wind field. Part I: Comparison with observed structure. J. Atmos. Sci., 72, 3647–3662.
- Chen, G., 2018: Secondary eyewall formation and concentric eyewall replacement in association with increased low-level inner-core diabatic cooling. J. Atmos. Sci., 75, 2659–2685.
- Chen, J., and D. R. Chavas, 2020: The transient responses of an axisymmetric tropical cyclone to instantaneous surface roughening and drying. J. Atmos. Sci., 77, 2807–2834.
- Chen, X., M. Xue, and J. Fang, 2018: Rapid intensification of Typhoon Mujigae (2015) under different sea surface temperatures: Structural changes leading to rapid intensification. J. Atmos. Sci., 75, 4313–4335.
- Chen, X., J.-F. Gu, J. A. Zhang, F. D. Marks, R. F. Rogers, and J. J. Cione, 2021: Boundary layer recovery and precipitation symmetrization preceding rapid intensification of tropical cyclones under shear. J. Atmos. Sci., 78, 1523–1544.
- Chen, X., C. M. Rozoff, R. F. Rogers, K. L. Corbosiero, D. Tao, J.-F. Gu, F. Judt, E. A. Hendricks, Y. Wang, M. M. Bell, D. P. Stern, K. D. Musgrave, J. A. Knaff, and J. Kaplan, 2023: Research advances on internal processes affecting tropical cyclone intensity change from 2018–2022. Trop. Cyclone Res. Rev., 12, 10–29.
- Cheng, C.-J., and C.-C. Wu, 2018: The role of WISHE in secondary eyewall formation. J. Atmos. Sci., 75, 3823–3841.
- Cheung, A. A., C. J. Slocum, J. A. Knaff, and M. N. Razin, 2024: Documenting the progressions of secondary eyewall formations. Wea. Forecasting, 39, 19–40.
- Corbosiero, K. L., and J. Molinari, 2003: The relationship between storm motion, vertical wind shear, and convective asymmetries in tropical cyclones. J. Atmos. Sci., 60, 366–376.
- Cronin, T. W., and D. R. Chavas, 2019: Dry and semidry tropical cyclones. J. Atmos. Sci., 76, 2193–2212.
- Dai, H., K. Zhao, Q. Li, W.-C. Lee, J. Ming, A. Zhou, X. Fan, Z. Yang, F. Zheng, and Y. Duan, 2021: Quasiperiodic intensification of convective asymmetries in the outer eyewall of Typhoon Lekima (2019). Geophys. Res. Lett., 48, e2020GL091633, doi: 10.1029/2020GL091633.
- DeMaria, M., M. Mainelli, L. K. Shay, J. A. Knaff, and J. Kaplan, 2005: Further improvements to the statistical hurricane intensity prediction scheme (SHIPS). Wea. Forecasting, 20, 531–543.
- DesRosiers, A. J., M. M. Bell, and T.-Y. Cha, 2022: Vertical vortex development in Hurricane Michael (2018) during rapid intensification. Mon. Wea. Rev., 150, 99–114.
- Didlake, A. C., Jr., and R. A. Houze, Jr., 2011: Kinematics of the secondary eyewall observed in Hurricane Rita (2005). J. Atmos. Sci., 68, 1620–1636.
- Didlake, A. C., Jr., G. M. Heymsfield, P. D. Reasor, and S. R. Guimond, 2017: Concentric eyewall asymmetries in Hurricane Gonzalo (2014) observed by airborne radar. Mon. Wea. Rev., 145, 729–749.
- Didlake, Jr., A. C., P. D. Reasor, R. F. Rogers, and W.-C. Lee, 2018: Dynamics of the transition from spiral rainbands to a secondary eyewall in Hurricane Earl (2010). J. Atmos. Sci., 75, 2909–2929.
- Dvorak, V. F., 1984: Tropical Cyclone Intensity Analysis Using Satellite Data, vol. 11. US Department of Commerce, National Oceanic and Atmospheric Administration, National Environmental Satellite, Data, and Information Service.
- Emanuel, K., and R. Rotunno, 2011: Self-stratification of tropical cyclone outflow. Part I: Implications for storm structure. J. Atmos. Sci., 68, 2236–2249.
- Emanuel, K., C. DesAutels, C. Holloway, and R. Korty, 2004: Environmental control of tropical cyclone intensity. J. Atmos. Sci., 61, 843–858.
- Emanuel, K. A., 1983: On assessing local conditional symmetric instability from atmospheric soundings. Mon. Wea. Rev., 111, 2016–2033.
- Emanuel, K. A., 1986: An air-sea interaction theory for tropical cyclones. Part I: Steady-state maintenance. J. Atmos. Sci., 43, 585–605.
- Fei, R., Y. Wang, and Y. Li, 2021: Contribution of vertical advection to supergradient wind in tropical cyclone boundary layer: A numerical study. J. Atmos. Sci., 78, 1057–1073.
- Fischer, M. S., R. F. Rogers, and P. D. Reasor, 2020: The rapid intensification and eyewall replacement cycles of Hurricane Irma (2017). Mon. Wea. Rev., 148, 981–1004.
- Francis, A., and B. Strahl, 2021: Joint Typhoon warning center annual tropical cyclone report 2020. JTWC Rep., 145 pp. [Available at https://www.metoc.navy.mil/jtwc/products/atcr/2020atcr.pdf.]
- Fujiwara, K., T. Takemi, and N. Mori, 2023: Response of intensity and structure of Typhoon Jebi (2018) before landfall to 2-K and 4-K warmed future climates in dynamical downscaling experiments. SOLA, 19, 142–149.
- Ge, X., 2015: Impacts of environmental humidity on concentric eyewall structure. Atmos. Sci. Lett., 16, 273–278.
- Green, T., X. Wang, and X. Lu, 2022: Impact of assimilating ground-based and airborne radar observations for the analysis and prediction of the eyewall replacement cycle of Hurricane Matthew (2016) using the HWRF hybrid 3DEnVar system. Mon. Wea. Rev., 150, 1157–1175.
- Guan, L., and X. Ge, 2018: How does tropical cyclone size affect the onset timing of secondary eyewall formation? J. Meteor. Res., 32, 124–134.
- Guimond, S. R., P. D. Reasor, G. M. Heymsfield, and M. M. McLinden, 2020: The dynamics of vortex Rossby waves and secondary eyewall development in Hurricane Matthew (2016): New insights from radar measurements. J. Atmos. Sci., 77, 2349–2374.
- Gutmann, E. D., R. M. Rasmussen, C. Liu, K. Ikeda, C. L. Bruyere, J. M. Done, L. Garrè, P. Friis-Hansen, and V. Veldore, 2018: Changes in hurricanes from a 13-yr convection-permitting pseudo–global warming simulation. J. Climate, 31, 3643–3657.
- Hawkins, H. F., and D. T. Rubsam, 1968: Hurricane Hilda, 1964. II. Structure and budgets of the hurricane on October 1, 1964. Mon. Wea. Rev., 96, 617–636.
- Hirano, S., K. Ito, H. Yamada, S. Tsujino, K. Tsuboki, and C.-C. Wu, 2022: Deep eye clouds in Tropical Cyclone Trami (2018) during T-PARCII dropsonde observations. J. Atmos. Sci., 79, 683–703.
- Hlywiak, J., and D. S. Nolan, 2019: The influence of oceanic barrier layers on tropical cyclone intensity as determined through idealized, coupled numerical simulations. J. Phys. Oceanogr., 49, 1723–1745.
- Hlywiak, J., and D. S. Nolan, 2021: The response of the near-surface tropical cyclone wind field to inland surface roughness length and soil moisture content during and after landfall. J. Atmos. Sci., 78, 983–1000.
- Hlywiak, J., and D. S. Nolan, 2022: The evolution of asymmetries in the tropical cyclone boundary layer wind field during landfall. Mon. Wea. Rev., 150, 529–549.
- Horinouchi, T., S. Tsujino, M. Hayashi, U. Shimada, W. Yanase, A. Wada, and H. Yamada, 2023: Stationary and transient asymmetric features in tropical cyclone eye with wavenumber-1 instability: Case study for Typhoon Haishen (2020) with atmospheric motion vectors from 30-second imaging. Mon. Wea. Rev., 151, 253–273.
- Houze, R. A., Jr., S. S. Chen, B. F. Smull, W.-C. Lee, and M. M. Bell, 2007: Hurricane intensity and eyewall replacement. Science, 315, 1235–1239.
- Huang, Y.-H., M. T. Montgomery, and C.-C. Wu, 2012: Concentric eyewall formation in Typhoon Sinlaku (2008). Part II: Axisymmetric dynamical processes. J. Atmos. Sci., 69, 662–674.
- Huang, Y.-H., C.-C. Wu, and M. T. Montgomery, 2018: Concentric eyewall formation in Typhoon Sinlaku (2008). Part III: Horizontal momentum budget analyses. J. Atmos. Sci., 75, 3541–3563.
- Ito, J., T. Oizumi, and H. Niino, 2017: Near-surface coherent structures explored by large eddy simulation of entire tropical cyclones. Sci. Rep., 7, 3798, doi: 10.1038/s41598-017-03848-w.
- Ito, K., and R. Yamamoto, 2022: Thermodynamic and kinematic structure of tropical cyclones in the western North Pacific based on ACARS/AMDAR. Front. Earth Sci., 10, 2354, doi: 10.3389/feart.2022.1058262.
- Ito, K., Y. Ishikawa, Y. Miyamoto, and T. Awaji, 2011: Short-time-scale processes in a mature hurricane as a response to sea surface fluctuations. J. Atmos. Sci., 68, 2250–2272.
- John, E. B., K. Balaguru, L. R. Leung, G. R. Foltz, R. D. Hetland, and S. M. Hagos, 2023: Intensification of Hurricane Sally (2020) over the Mississippi River Plume. Wea. Forecasting, 38, 1391–1404.
- Kanada, S., and A. Nishii, 2023: Observed concentric eyewalls of supertyphoon Hinnamnor (2022). SOLA, 19, 70–77.
- Kanada, S., K. Tsuboki, and I. Takayabu, 2020: Future changes of tropical cyclones in the midlatitudes in 4-km-mesh downscaling experiments from large-ensemble simulations. SOLA, 16, 57–63.
- Kasami, K., and M. Satoh, 2024: Mechanism of secondary eyewall formation in tropical cyclones revealed by sensitivity experiments on the mesoscale descending inflow. SOLA, 20, 62–68.
- Kepert, J., 2001: The dynamics of boundary layer jets within the tropical cyclone core. Part I: Linear theory. J. Atmos. Sci., 58, 2469–2484.
- Kepert, J., and Y. Wang, 2001: The dynamics of boundary layer jets within the tropical cyclone core. Part II: Nonlinear enhancement. J. Atmos. Sci., 58, 2485–2501.
- Kepert, J. D., 2013: How does the boundary layer contribute to eyewall replacement cycles in axisymmetric tropical cyclones? J. Atmos. Sci., 70, 2808–2830.
- Kepert, J. D., 2017: Time and space scales in the tropical cyclone boundary layer, and the location of the eyewall updraft. J. Atmos. Sci., 74, 3305–3323.
- Kepert, J. D., 2018: The boundary layer dynamics of tropical cyclone rainbands. J. Atmos. Sci., 75, 3777–3795.
- Kepert, J. D., and D. S. Nolan, 2014: Reply to “Comments on ‘How does the boundary layer contribute to eyewall replacement cycles in axisymmetric tropical cyclones?’ ” J. Atmos. Sci., 71, 4692–4704.
- Knaff, J. A., M. DeMaria, D. A. Molenar, C. R. Sampson, and M. G. Seybold, 2011: An automated, objective, multiple-satellite-platform tropical cyclone surface wind analysis. Journal of applied meteorology and climatology, 50, 2149–2166.
- Knaff, J. A., S. P. Longmore, R. T. DeMaria, and D. A. Molenar, 2015: Improved tropical-cyclone flight-level wind estimates using routine infrared satellite reconnaissance. Journal of Applied Meteorology and Climatology, 54, 463–478.
- Knaff, J. A., C. R. Sampson, and B. R. Strahl, 2020: A tropical cyclone rapid intensification prediction aid for the Joint Typhoon Warning Center’s areas of responsibility. Wea. Forecasting, 35, 1173–1185.
- Knaff, J. A., C. R. Sampson, M. E. Kucas, C. J. Slocum, M. J. Brennan, T. Meissner, L. Ricciardulli, A. Mouche, N. Reul, M. Morris, G. Chirokova, and P. Caroff, 2021: Estimating tropical cyclone surface winds: Current status, emerging technologies, historical evolution, and a look to the future. Trop. Cyclone Res. Rev., 10, 125–150.
- Knutson, T., S. J. Camargo, J. C. L. Chan, K. Emanuel, C.-H. Ho, J. Kossin, M. Mohapatra, M. Satoh, M. Sugi, K. Walsh, and L. Wu, 2020: Tropical cyclones and climate change assessment: Part II: Projected response to anthropogenic warming. Bull. Amer. Meteor. Soc., 101, E303–E322.
- Kossin, J. P., and M. Sitkowski, 2009: An objective model for identifying secondary eyewall formation in hurricanes. Mon. Wea. Rev., 137, 876–892.
- Kossin, J. P., and M. DeMaria, 2016: Reducing operational hurricane intensity forecast errors during eyewall replacement cycles. Wea. Forecasting, 31, 601–608.
- Kossin, J. P., W. H. Schubert, and M. T. Montgomery, 2000: Unstable interactions between a hurricane’s primary eyewall and a secondary ring of enhanced vorticity. J. Atmos. Sci., 57, 3893–3917.
- Kossin, J. P., J. A. Knaff, H. I. Berger, D. C. Herndon, T. A. Cram, C. S. Velden, R. J. Murnane, and J. D. Hawkins, 2007: Estimating hurricane wind structure in the absence of aircraft reconnaissance. Wea. Forecasting, 22, 89–101.
- Kossin, J. P., D. C. Herndon, A. J. Wimmers, X. Guo, and E. S. Blake, 2023: M-PERC: A new satellite microwave-based model to diagnose the onset of tropical cyclone eyewall replacement cycles. Wea. Forecasting, 38, 1405–1411.
- Kuo, H.-C., L.-Y. Lin, C.-P. Chang, and R. T. Williams, 2004: The formation of concentric vorticity structures in typhoons. J. Atmos. Sci., 61, 2722–2734.
- Kuo, H.-C., C.-P. Chang, Y.-T. Yang, and H.-J. Jiang, 2009: Western North Pacific typhoons with concentric eyewalls. Mon. Wea. Rev., 137, 3758–3770.
- Kuo, H.-C., S. Tsujino, T.-Y. Hsu, M. S. Peng, and S.-H. Su, 2022: Scaling law for boundary layer inner eyewall pumping in concentric eyewalls. J. Geophys. Res. Atmos., 127, e2021JD035518, doi: 10.1029/2021JD035518.
- Lai, T.-K., K. Menelaou, and M. K. Yau, 2019: Barotropic instability across the moat and inner eyewall dissipation: A numerical study of Hurricane Wilma (2005). J. Atmos. Sci., 76, 989–1013.
- Lai, T.-K., E. A. Hendricks, and M. K. Yau, 2021a: Longterm effect of barotropic instability across the moat in double-eyewall tropical cyclone–like vortices in forced and unforced shallow-water models. J. Atmos. Sci., 78, 4103–4126.
- Lai, T.-K., E. A. Hendricks, K. Menelaou, and M. K. Yau, 2021b: Roles of barotropic instability across the moat in inner eyewall decay and outer eyewall intensification: Three-dimensional numerical experiments. J. Atmos. Sci., 78, 473–496.
- Lai, T.-K., E. A. Hendricks, M. K. Yau, and K. Menelaou, 2021c: Roles of barotropic instability across the moat in inner eyewall decay and outer eyewall intensification: Essential dynamics. J. Atmos. Sci., 78, 1411–1428.
- Lau, K. H., C.-Y. Tam, and C.-C. Wu, 2024: Island-induced eyewall replacement in a landfalling tropical cyclone: A model study of Super Typhoon Mangkhut (2018). J. Geophys. Res.: Atmos., 129, e2023JD039541, doi: 10.1029/2023JD039541.
- Le Hénaff, M., R. Domingues, G. Halliwell, J. A. Zhang, H.-S. Kim, M. Aristizabal, T. Miles, S. Glenn, and G. Goni, 2021: The role of the Gulf of Mexico ocean conditions in the intensification of Hurricane Michael (2018). J. Geophys. Res.: Oceans, 126, e2020JC016969, doi: 10.1029/2020JC016969.
- Li, X., Z. Pu, and Z. Gao, 2021: Effects of roll vortices on the evolution of Hurricane Harvey during landfall. J. Atmos. Sci., 78, 1847–1867.
- Li, X., X. Cheng, J. Fei, X. Huang, and J. Ding, 2022: The modulation effect of sea surface cooling on the eyewall replacement cycle in Typhoon Trami (2018). Mon. Wea. Rev., 150, 1417–1436.
- Li, Y., Y. Wang, and Y. Lin, 2019: Revisiting the dynamics of eyewall contraction of tropical cyclones. J. Atmos. Sci., 76, 3229–3245.
- Li, Y., Y. Wang, Y. Lin, and X. Wang, 2021: Why does rapid contraction of the radius of maximum wind precede rapid intensification in tropical cyclones? J. Atmos. Sci., 78, 3441–3453.
- Li, Y., Y. Wang, and Z.-M. Tan, 2022: How frequently does rapid intensification occur after rapid contraction of the radius of maximum wind in tropical cyclones over the North Atlantic and Eastern North Pacific? Mon. Wea. Rev., 150, 1747–1760.
- Lin, S.-J., and K.-H. Chou, 2020: The lightning distribution of tropical cyclones over the Western North Pacific. Mon. Wea. Rev., 148, 4415–4434.
- Liu, Q., L. Wu, N. Qin, and Y. Li, 2021: Storm-scale and fine-scale boundary layer structures of tropical cyclones simulated with the WRF-LES framework. J. Geophys. Res.: Atmos., 126, e2021JD035511, doi: 10.1029/2021JD035511.
- Liu, X., Q. Li, and Y. Dai, 2022: Stronger vertical shear leads to earlier secondary eyewall formation in idealized numerical simulations. Geophys. Res. Lett., 49, e2022GL098093, doi: 10.1029/2022GL098093.
- Macdonald, N. J., 1968: The evidence for the existence of Rossby-like waves in the hurricane vortex. Tellus, 20, 138–150.
- Mallen, K. J., M. T. Montgomery, and B. Wang, 2005: Reexamining the near-core radial structure of the tropical cyclone primary circulation: Implications for vortex resiliency. J. Atmos. Sci., 62, 408–425.
- Martinez, J., C. C. Nam, and M. M. Bell, 2020: On the contributions of incipient vortex circulation and environmental moisture to tropical cyclone expansion. J. Geophys. Res.: Atmos., 125, e2020JD033324, doi: 10.1029/2020JD033324.
- Menelaou, K., M. K. Yau, and Y. Martinez, 2012: On the dynamics of the secondary eyewall genesis in Hurricane Wilma (2005). Geophys. Res. Lett., 39, L04801, doi: 10.1029/2011GL050699.
- Menelaou, K., M. K. Yau, and T.-K. Lai, 2018: A possible three-dimensional mechanism for oscillating wobbles in tropical cyclone-like vortices with concentric eyewalls. J. Atmos. Sci., 75, 2157–2174.
- Miura, H., T. Suematsu, Y. Kawai, Y. Yamagami, D. Takasuka, Y. Takano, C.-S. Hung, K. Yamazaki, C. Kodama, Y. Kajikawa, and Y. Masumoto, 2023: Asymptotic matching between weather and climate models. Bull. Amer. Meteor. Soc., 104, E2308–E2315.
- Miyamoto, Y., and T. Takemi, 2013: A transition mechanism for the spontaneous axisymmetric intensification of tropical cyclones. J. Atmos. Sci., 70, 112–129.
- Miyamoto, Y., D. S. Nolan, and N. Sugimoto, 2018: A dynamical mechanism for secondary eyewall formation in tropical cyclones. J. Atmos. Sci., 75, 3965–3986.
- Miyamoto, Y., H. Fudeyasu, and A. Wada, 2022: Intensity and structural changes of numerically simulated Typhoon Faxai (1915) before landfall. J. Meteor. Soc. Japan, 100, 181–196.
- Molinari, J., J. A. Zhang, R. F. Rogers, and D. Vollaro, 2019: Repeated eyewall replacement cycles in Hurricane Frances (2004). Mon. Wea. Rev., 147, 2009–2022.
- Montgomery, M. T., and R. J. Kallenbach, 1997: A theory for vortex Rossby-waves and its application to spiral bands and intensity changes in hurricanes. Quart. J. Roy. Meteor. Soc., 123, 435–465.
- Moon, Y., and D. S. Nolan, 2010: The dynamic response of the hurricane wind field to spiral rainband heating. J. Atmos. Sci., 67, 1779–1805.
- Moon, Y., D. S. Nolan, and M. Iskandarani, 2010: On the use of two-dimensional incompressible flow to study secondary eyewall formation in tropical cyclones. J. Atmos. Sci., 67, 3765–3773.
- Mrowiec, A. A., S. T. Garner, and O. M. Pauluis, 2011: Axisymmetric hurricane in a dry atmosphere: Theoretical framework and numerical experiments. J. Atmos. Sci., 68, 1607–1619.
- Nolan, D. S., M. T. Montgomery, and L. D. Grasso, 2001: The wavenumber-one instability and trochoidal motion of hurricane-like vortices. J. Atmos. Sci., 58, 3243–3270.
- Nong, S., and K. Emanuel, 2003: A numerical study of the genesis of concentric eyewalls in hurricanes. Quart. J. Roy. Meteor. Soc., 129, 3323–3338.
- Ooyama, K., 1969: Numerical simulation of the life cycle of tropical cyclones. J. Atmos. Sci., 26, 3–40.
- Patricola, C. M., and M. F. Wehner, 2018: Anthropogenic influences on major tropical cyclone events. Nature, 563, 339–346.
- Peng, K., R. Rotunno, G. H. Bryan, and J. Fang, 2019: Evolution of an axisymmetric tropical cyclone before reaching slantwise moist neutrality. J. Atmos. Sci., 76, 1865–1884.
- Persing, J., and M. T. Montgomery, 2022: Does the rotating convection paradigm describe secondary eyewall formation in idealized three-dimensional simulations? J. Atmos. Sci., 79, 745–762.
- Powell, M. D., P. J. Vickery, and T. A. Reinhold, 2003: Reduced drag coefficient for high wind speeds in tropical cyclones. Nature, 422, 279–283.
- Pulmano, L., and L. Joykutty, 2021: Comparison of ARCHER MPERC to NHC analysis. J. Student Res., 10, doi: 10.47611/jsrhs.v10i3.1606.
- Qin, N., and L. Wu, 2021: Possible environmental influence on eyewall expansion during the rapid intensification of Hurricane Helene (2006). Front. Earth Sci., 9, 715012, doi: 10.3389/feart.2021.715012.
- Qin, N., L. Wu, and Q. Liu, 2021: Evolution of the moat associated with the secondary eyewall formation in a simulated tropical cyclone. J. Atmos. Sci., 78, 4021–4035.
- Qiu, X., Z.-M. Tan, and Q. Xiao, 2010: The roles of vortex Rossby waves in hurricane secondary eyewall formation. Mon. Wea. Rev., 138, 2092–2109.
- Razin, M. N., and M. M. Bell, 2021: The unconventional eyewall replacement cycle of Hurricane Ophelia (2005). Mon. Wea. Rev., 149, 2151–2170.
- Reasor, P. D., M. T. Montgomery, and L. D. Grasso, 2004: A new look at the problem of tropical cyclones in vertical shear flow: Vortex resiliency. J. Atmos. Sci., 61, 3–22.
- Rios-Berrios, R., C. A. Davis, and R. D. Torn, 2018: A hypothesis for the intensification of tropical cyclones under moderate vertical wind shear. J. Atmos. Sci., 75, 4149–4173.
- Rogers, R., P. Reasor, and S. Lorsolo, 2013: Airborne Doppler observations of the inner-core structural differences between intensifying and steady-state tropical cyclones. Mon. Wea. Rev., 141, 2970–2991.
- Rogers, R. F., and J. A. Zhang, 2023: Airborne Doppler radar observations of tropical cyclone boundary layer kinematic structure and evolution during landfall. Geophys. Res. Lett., 50, e2023GL105548, doi: 10.1029/2023GL105548.
- Rogers, R. F., S. Aberson, M. M. Bell, D. J. Cecil, J. D. Doyle, T. B. Kimberlain, J. Morgerman, L. K. Shay, and C. Velden, 2017: Rewriting the tropical record books: The extraordinary intensification of Hurricane Patricia (2015). Bull. Amer. Meteor. Soc., 98, 2091–2112.
- Rostami, M., and V. Zeitlin, 2022: Evolution of double-eye wall hurricanes and emergence of complex tripolar end states in moist-convective rotating shallow water model. Phys. Fluids, 34, 066602, doi: 10.1063/5.0096554.
- Rozoff, C. M., W. H. Schubert, B. D. McNoldy, and J. P. Kossin, 2006: Rapid filamentation zones in intense tropical cyclones. J. Atmos. Sci., 63, 325–340.
- Rudzin, J. E., L. K. Shay, and W. E. Johns, 2018: The influence of the barrier layer on SST response during tropical cyclone wind forcing using idealized experiments. J. Phys. Oceanogr., 48, 1471–1478.
- Shapiro, L. J., 1983: The asymmetric boundary layer flow under a translating hurricane. J. Atmos. Sci., 40, 1984–1998.
- Shen, L.-Z., C.-C. Wu, and F. Judt, 2021: The role of surface heat fluxes on the size of Typhoon Megi (2016). J. Atmos. Sci., 78, 1075–1093.
- Simpson, R. H., 1952: Exploring eye of Typhoon “Marge,” 1951. Bull. Amer. Meteor. Soc., 33, 286–298.
- Sitkowski, M., J. P. Kossin, and C. M. Rozoff, 2011: Intensity and structure changes during hurricane eyewall replacement cycles. Mon. Wea. Rev., 139, 3829–3847.
- Slocum, C. J., J. A. Knaff, and S. N. Stevenson, 2023a: Lightning-based tropical cyclone rapid intensification guidance. Wea. Forecasting, 38, 1209–1227.
- Slocum, C. J., R. K. Taft, J. P. Kossin, and W. H. Schubert, 2023b: Barotropic instability during eyewall replacement. Meteorology, 2, 191–221.
- Song, C., S. Park, and J. Shin, 2020: Tropical cyclone activities in warm climate with quadrupled CO2 concentration simulated by a new general circulation model. J. Geophys. Res.: Atmos., 125, e2019JD032314, doi: 10.1029/2019JD032314.
- Stern, D. P., and F. Zhang, 2013: How does the eye warm? Part I: A potential temperature budget analysis of an idealized tropical cyclone. J. Atmos. Sci., 70, 73–90.
- Stern, D. P., J. Dunion, M. Bell, E. Hendricks, Y.-H. Huang, H. Jiang, J. Kossin, J. Kepert, Y. Miyamoto, and Y. Wang, 2014a: Subtopic 2.6. Intensity change: Internal processes. Report for the Eighth WMO International Workshop on Tropical Cyclones IWTC-VIII. World Meteorological Organization, Jeju Island, South Korea, 26 pp.
- Stern, D. P., J. R. Brisbois, and D. S. Nolan, 2014b: An expanded dataset of hurricane eyewall sizes and slopes. J. Atmos. Sci., 71, 2747–2762.
- Stern, D. P., J. L. Vigh, D. S. Nolan, and F. Zhang, 2015: Revisiting the relationship between eyewall contraction and intensification. J. Atmos. Sci., 72, 1283–1306.
- Stern, D. P., J. D. Kepert, G. H. Bryan, and J. D. Doyle, 2020: Understanding atypical midlevel wind speed maxima in hurricane eyewalls. J. Atmos. Sci., 77, 1531–1557.
- Stevenson, S. N., K. L. Corbosiero, M. DeMaria, and J. L. Vigh, 2018: A 10-year survey of tropical cyclone inner-core lightning bursts and their relationship to intensity change. Wea. Forecasting, 33, 23–36.
- Tao, D., and F. Zhang, 2019: Evolution of dynamic and thermodynamic structures before and during rapid intensification of tropical cyclones: Sensitivity to vertical wind shear. Mon. Wea. Rev., 147, 1171–1191.
- Tao, D., R. Rotunno, and M. Bell, 2020: Lilly’s model for steady-state tropical cyclone intensity and structure. J. Atmos. Sci., 77, 3701–3720.
- Terwey, W. D., and M. T. Montgomery, 2008: Secondary eyewall formation in two idealized, full-physics modeled hurricanes. J. Geophys. Res., 113, D12112, doi: 10.1029/2007JD008897.
- Trabing, B. C., and M. M. Bell, 2021: The sensitivity of eyewall replacement cycles to shortwave radiation. J. Geophys. Res.: Atmos., 126, e2020JD034016, doi: 10.1029/2020JD034016.
- Tsujino, S., T. Horinouchi, T. Tsukada, H.-C. Kuo, H. Yamada, and K. Tsuboki, 2021: Inner-core wind field in a concentric eyewall replacement of Typhoon Trami (2018): A quantitative analysis based on the Himawari-8 satellite. J. Geophys. Res.: Atmos., 126, e2020JD034434, doi: 10.1029/2020JD034434.
- Tsukada, T., and T. Horinouchi, 2020: Estimation of the tangential winds and asymmetric structures in typhoon inner core region using Himawari-8. Geophys. Res. Lett., 47, e2020GL087637, doi: 10.1029/2020GL087637.
- Tsukada, T., and T. Horinouchi, 2023: Strong relationship between eye radius and radius of maximum wind of tropical cyclones. Mon. Wea. Rev., 151, 569–588.
- Ueno, M., and M. Kunii, 2009: Some aspects of azimuthal wavenumber-one structure of typhoons represented in the JMA operational mesoscale analyses. J. Meteor. Soc. Japan, 87, 615–633.
- Uhlhorn, E. W., B. W. Klotz, T. Vukicevic, P. D. Reasor, and R. F. Rogers, 2014: Observed hurricane wind speed asymmetries and relationships to motion and environmental shear. Mon. Wea. Rev., 142, 1290–1311.
- Vaughan, A., K. J. E. Walsh, and J. D. Kepert, 2020: The stationary banding complex and secondary eyewall formation in tropical cyclones. J. Geophys. Res.: Atmos., 125, e2019JD031515, doi: 10.1029/2019JD031515.
- Vallis, G. K., and M. E. Maltrud, 1993: Generation of mean flows and jets on a beta plane and over topography. J. Phys. Oceanogr., 23, 1346–1362.
- Vigh, J. L., H. Jiang, Y.-H. Huang, Y. Miyamoto, R. Oyama, Q. Li, E. Hendricks, K. Menelaou, C. Slocum, K. L. Corbosiero, M. Bell, Y. Wang, J. Xu, O. Bousquet, R. Smith, and R. Coronel, 2018: Topic 3.1. Intensity change: internal influences. Report of the Ninth WMO International Workshop on Tropical Cyclones (IWTC-9). World Meteorological Organization, Honolulu, Hawaii.
- Wadler, J. B., R. F. Rogers, and P. D. Reasor, 2018: The relationship between spatial variations in the structure of convective bursts and tropical cyclone intensification as determined by airborne Doppler radar. Mon. Wea. Rev., 146, 761–780.
- Wadler, J. B., D. S. Nolan, J. A. Zhang, and L. K. Shay, 2021a: Thermodynamic characteristics of downdrafts in tropical cyclones as seen in idealized simulations of different intensities. J. Atmos. Sci., 78, 3503–3524.
- Wadler, J. B., J. A. Zhang, R. F. Rogers, B. Jaimes, and L. K. Shay, 2021b: The rapid intensification of Hurricane Michael (2018): Storm structure and the relationship to environmental and air–sea interactions. Mon. Wea. Rev., 149, 245–267.
- Wang, D., and Y. Lin, 2020: Size and structure of dry and moist reversible tropical cyclones. J. Atmos. Sci., 77, 2091–2114.
- Wang, H., and Y. Wang, 2021: A numerical study of Typhoon Megi (2010). Part II: Eyewall evolution crossing the Luzon Island. Mon. Wea. Rev., 149, 375–394.
- Wang, H., Y. Wang, J. Xu, and Y. Duan, 2019a: The axisymmetric and asymmetric aspects of the secondary eyewall formation in a numerically simulated tropical cyclone under idealized conditions on an f plane. J. Atmos. Sci., 76, 357–378.
- Wang, H., Y. Wang, J. Xu, and Y. Duan, 2019b: Evolution of the warm-core structure during the eyewall replacement cycle in a numerically simulated tropical cyclone. J. Atmos. Sci., 76, 2559–2573.
- Wang, X., Q. Li, and N. E. Davidson, 2018: The coupled dynamic and thermodynamic processes for secondary eyewall formation. J. Geophys. Res.: Atmos., 123, 9192–9219.
- Wang, Y.-F., and Z.-M. Tan, 2020: Outer rainbands–driven secondary eyewall formation of tropical cyclones. J. Atmos. Sci., 77, 2217–2236.
- Wang, Y.-F., and Z.-M. Tan, 2022: Essential dynamics of the vertical wind shear affecting the secondary eyewall formation in tropical cyclones. J. Atmos. Sci., 79, 2831–2847.
- Wehner, M., 2021: Simulated changes in tropical cyclone size, accumulated cyclone energy and power dissipation index in a warmer climate. Oceans, 2, 688–699.
- Willoughby, H. E., J. A. Clos, and M. G. Shoreibah, 1982: Concentric eye walls, secondary wind maxima, and the evolution of the hurricane vortex. J. Atmos. Sci., 39, 395–411.
- Willoughby, H. E., F. D. Marks, Jr., and R. J. Feinberg, 1984: Stationary and moving convective bands in hurricanes. J. Atmos. Sci., 41, 3189–3211.
- Wood, K., W. Yanase, J. Beven, S. J. Camargo, J. B. Courtney, C. Fogarty, J. Fukuda, N. Kitabatake, M. Kucas, R. McTaggart-Cowan, M. S. Reboita, and J. Riboldi, 2023: Phase transitions between tropical, subtropical, and extratropical cyclones: A review from IWTC-10. Trop. Cyclone Res. Rev., 12, 294–308.
- Wu, C.-C., Y.-H. Huang, and G.-Y. Lien, 2012: Concentric eyewall formation in Typhoon Sinlaku (2008). Part I: Assimilation of T-PARC data based on the ensemble Kalman filter (EnKF). Mon. Wea. Rev., 140, 506–527.
- Wu, Q., and Z. Ruan, 2021: Rapid contraction of the radius of maximum tangential wind and rapid intensification of a tropical cyclone. J. Geophys. Res.: Atmos., 126, e2020JD033681, doi: 10.1029/2020JD033681.
- Wunsch, K. E. D., and A. C. Didlake, Jr., 2018: Analyzing tropical cyclone structures during secondary eyewall formation using aircraft in situ observations. Mon. Wea. Rev., 146, 3977–3993.
- Xu, J., and Y. Wang, 2010a: Sensitivity of the simulated tropical cyclone inner-core size to the initial vortex size. Mon. Wea. Rev., 138, 4135–4157.
- Xu, J., and Y. Wang, 2010b: Sensitivity of tropical cyclone inner-core size and intensity to the radial distribution of surface entropy flux. J. Atmos. Sci., 67, 1831–1852.
- Yamada, H., K. Ito, K. Tsuboki, T. Shinoda, T. Ohigashi, M. Yamaguchi, T. Nakazawa, N. Nagahama, and K. Shimizu, 2021: The double warm-core structure of Typhoon Lan (2017) as observed through the first Japanese eyewall-penetrating aircraft reconnaissance. J. Meteor. Soc. Japan, 99, 1297–1327.
- Yang, L., X. Cheng, X. Huang, J. Fei, and X. Li, 2020: Effects of air-sea interaction on the eyewall replacement cycle of Typhoon Sinlaku (2008): Verification of numerical simulation. Earth Space Sci., 7, e2019EA000763, doi: 10.1029/2019EA000763.
- Yang, X.-w., Y.-q. Wang, H. Wang, J. Xu, and R.-f. Zhan, 2024: Effect of the initial vortex structure on intensity change during eyewall replacement cycle of tropical cyclones: A numerical study. J. Trop. Meteor., 30, 106–117.
- Yang, Y.-T., H.-C. Kuo, E. A. Hendricks, and M. S. Peng, 2013: Structural and intensity changes of concentric eyewall typhoons in the western North Pacific basin. Mon. Wea. Rev., 141, 2632–2648.
- Yang, Y.-T., H.-C. Kuo, S. Tsujino, B.-F. Chen, and M. S. Peng, 2021: Characteristics of the long-lived concentric eyewalls in tropical cyclones. J. Geophys. Res.: Atmos., 126, e2020JD033703, doi: 10.1029/2020JD033703.
- Yu, C.-L., and A. C. Didlake, Jr., 2019: Impact of stratiform rainband heating on the tropical cyclone wind field in idealized simulations. J. Atmos. Sci., 76, 2443–2462.
- Yu, C.-L., A. C. Didlake, Jr., F. Zhang, and R. G. Nystrom, 2021a: Asymmetric rainband processes leading to secondary eyewall formation in a model simulation of Hurricane Matthew (2016). J. Atmos. Sci., 78, 29–49.
- Yu, C.-L., A. C. Didlake, Jr., J. D. Kepert, and F. Zhang, 2021b: Investigating axisymmetric and asymmetric signals of secondary eyewall formation using observations-based modeling of the tropical cyclone boundary layer. J. Geophys. Res.: Atmos., 126, e2020JD034027, doi: 10.1029/2020JD034027.
- Yu, C.-L., A. C. Didlake, Jr., and F. Zhang, 2022: Updraft maintenance and axisymmetrization during secondary eyewall formation in a model simulation of Hurricane Matthew (2016). J. Atmos. Sci., 79, 1105–1125.
- Zhang, F., D. Tao, Y. Q. Sun, and J. D. Kepert, 2017: Dynamics and predictability of secondary eyewall formation in sheared tropical cyclones. J. Adv. Model. Earth Syst., 9, 89–112.
- Zhang, J. A., and E. W. Uhlhorn, 2012: Hurricane sea surface inflow angle and an observation-based parametric model. Mon. Wea. Rev., 140, 3587–3605.
- Zhang, J. A., and R. F. Rogers, 2019: Effects of parameterized boundary layer structure on hurricane rapid intensification in shear. Mon. Wea. Rev., 147, 853–871.
- Zhang, J. A., K. B. Katsaros, P. G. Black, S. Lehner, J. R. French, and W. M. Drennan, 2008: Effects of roll vortices on turbulent fluxes in the hurricane boundary layer. Bound.-Layer Meteor., 128, 173–189.
- Zhang, J. A., R. F. Rogers, D. S. Nolan, and F. D. Marks, Jr., 2011: On the characteristic height scales of the hurricane boundary layer. Mon. Wea. Rev., 139, 2523–2535.
- Zhang, J. A., R. F. Rogers, P. D. Reasor, E. W. Uhlhorn, and F. D. Marks, Jr., 2013: Asymmetric hurricane boundary layer structure from dropsonde composites in relation to the environmental vertical wind shear. Mon. Wea. Rev., 141, 3968–3984.
- Zhang, J. A., D. S. Nolan, R. F. Rogers, and V. Tallapragada, 2015: Evaluating the impact of improvements in the boundary layer parameterization on hurricane intensity and structure forecasts in HWRF. Mon. Wea. Rev., 143, 3136–3155.
- Zhang, J. A., R. F. Rogers, and V. Tallapragada, 2017: Impact of parameterized boundary layer structure on tropical cyclone rapid intensification forecasts in HWRF. Mon. Wea. Rev., 145, 1413–1426.
- Zhang, J. A., F. D. Marks, J. A. Sippel, R. F. Rogers, X. Zhang, S. G. Gopalakrishnan, Z. Zhang, and V. Tallapragada, 2018: Evaluating the impact of improvement in the horizontal diffusion parameterization on hurricane prediction in the operational Hurricane Weather Research and Forecast (HWRF) model. Wea. Forecasting, 33, 317–329.
- Zhang, J. A., R. F. Rogers, P. D. Reasor, and J. Gamache, 2023: The mean kinematic structure of the tropical cyclone boundary layer and its relationship to intensity change. Mon. Wea. Rev., 151, 63–84.
- Zhu, X.-S., H. Yu, and Y. Wang, 2022: Downwind development in a stationary band complex leading to the secondary eyewall formation in the simulated Typhoon Soudelor (2015). Mon. Wea. Rev., 150, 2459–2483.


;%0A%09%09%09newWindow.document.open();%0A%09%09%09newWindow.document.write('<img src=%22./Graphics/103_147_027.png%22>');%0A%09%09%09newWindow.document.close();%0A%09%09)