Abstract
This study investigates the microphysical characteristics of warm-season precipitation with observations from the second generation Parsivel disdrometer OTT2 in Ningbo, situated in eastern coastal China. A comparative analysis is conducted on the raindrop size distribution (DSD) across various rain types and regions, with a focus on elucidating the relationships between different rain rate (R), raindrop sizes, concentrations, and radar reflectivity (Z). Moreover, this study meticulously analyzes the shape-slope (μ−Λ) relationship of raindrops during the warm season in this region. The results reveal that during warm-season convection in coastal eastern China, the mass-weighted mean diameter (Dm) and the logarithmic generalized intercept parameter (log10 Nw) are 2.21 mm and 3.51, respectively. This indicates the presence of low-concentration large raindrops, distinguishing this region from other parts of China such as Guangdong, Hubei, Nanjing, and Beijing. Additionally, the enhancement of convective R is predominantly driven by the increase in raindrop size. Convective rainfall accounts for 67.0 % of the total precipitation, while stratiform contributes 11.1 %. Both types of rain display a unimodal distribution in number concentration and diameter, peaking at 0.3–0.6 mm. Additionally, both generally follow the three-parameter Gamma distribution, despite minor deviations in the occurrences of larger and smaller raindrops. The μ−Λ relationship in eastern coastal China is similar to that of the southern coastal regions, both being dominated by large raindrops. The Z–R relationship for warm-season convection is expressed as Z = 396.96R1.34. These findings are vital for optimizing regional model cloud microphysics parameterization and improving the precision of local radar-based quantitative precipitation estimates.
1. Introduction
Precipitation is one of the most common weather phenomena, playing a crucial role in regulating atmospheric temperature, humidity, and the surface hydrological cycle (Zhou et al. 2011; Jiang et al. 2023). Rainwater is primarily composed of raindrop particles, which influence Earth’s energy balance by absorbing or reflecting solar radiation and releasing latent heat through phase changes (Morrison and Milbrandt 2015; Tokay and Short 1996; Nelson et al. 2018). The formation of these particles is intricate, encompassing atmospheric thermodynamics, cloud microphysics, and their interactions (Morrison and Milbrandt 2015). This process induces variations in temperature, airflow, raindrop size, and phase state (Morrison and Milbrandt 2015; Thompson et al. 2015; Zeng et al. 2019). Therefore, it is imperative to comprehend the microphysical characteristics of these raindrops.
In recent years, the deployment of disdrometers and weather radars has provided highly efficient and precise observational tools for examining the microphysical characteristics of precipitation (Uijlenhoet et al 2003; Wu and Liu 2017; Wen et al. 2016; Zhang et al. 2019a). Leveraging the principle of laser attenuation by raindrops, disdrometers can observe continuous, high-precision measurements of raindrop diameter (D, mm), velocity (V, m s−1), rain rate (R, mm h−1), and weather phenomena (Fu et al. 2020; Li et al. 2022; Seela et al. 2017). These fundamental parameters and the raindrop size distribution (DSD) accurately reflect the microphysical properties of raindrops. It has been demonstrated through studies that analyzing DSD characteristics enhances the understanding of precipitation mechanisms in clouds and raindrops (List et al. 1987; Ulbrich et al. 2007; Han et al. 2021). This analysis improves microphysical parameterization schemes in numerical weather prediction (NWP) models, enhances quantitative precipitation estimation (QPE) using ground-based radar, and refines satellite precipitation estimates, ultimately boosting weather forecasting and early warning capabilities (Zhang et al. 2001; Morrison and Milbrandt 2015; Thompson et al. 2015; Zhang et al. 2019b). In 2014, the Global Precipitation Mission (GPM) was launched with the second-generation Dual-frequency Precipitation Radar (DPR) as its primary instrument (Hou et al. 2014). Ground-based DSD also provides essential evaluation parameters for the ongoing GPM mission (Radhakrishna et al. 2016; Del et al. 2021).
Some studies (Hu and Srivastava 1995; Tokay and Short 1996; Uijlenhoet et al. 2003) indicate that DSD can be categorized into three types: concentration control, size control, and a combination of number concentration and size control. In intense warm rain rainfall, equilibrium DSD characterized by concentration control are frequently observed (Zawadzki and Antonio 1988; Hu and Srivastava 1995). However, as rainfall intensity increases, the raindrop slope gradually steepens (Tokay and Short 1996; Caracciolo et al. 2006; Wu and Liu 2017). Such DSDs fall into the categories of either raindrop size control or a combination of size and concentration control.
DSD characteristics differ significantly across regions and rainfall systems. Tenório et al. (2012) analyzed 25 rainfall events in northern Brazil, both over land (offshore rainband) and ocean (onshore rainband), discovering that the oceanic region has a higher proportion of small to medium-sized raindrops (D < 2 mm) compared to the land. Seela et al. (2017) analyzed and compared the summer DSDs of two islands, Taiwan and Palau, which are located in the northwest Pacific and approximately 2,400 kilometers apart. The study revealed significant differences in DSDs between the islands, with Taiwan showing a higher concentration of medium to large raindrops due to more pronounced topographical influences. Additionally, convective rainfall on both islands featured larger raindrop diameters compared to stratiform. Bringi et al. (2003) analyzed global DSD data from various regions and climates, categorizing convective rainfall into “maritime-like” and “continental-like” clusters. The “maritime-like” cluster has a higher concentration of small raindrops compared to the “continental-like” cluster.
The vast territory and diverse climates of China result in varying DSD characteristics across different regions (Wang et al. 2024; Zeng et al. 2019; Ji et al. 2019; Han et al. 2021; Wen et al. 2017). Chen et al. (2013) used the first-generation Parsivel (OTT) to analyze DSD during the Meiyu season in the lower Yangtze River (Nanjing), revealing that the convective rainfall in this region exhibits “maritime-like.” However, Fu et al. (2020) analyzed data from the second-generation Parsivel (OTT2) and two-dimensional video disdrometer (2DVD), finding that convective rainfall during the Meiyu season in the middle Yangtze River region (Hubei) is intermediate between “maritime-like” and “continental-like” but closer to the “maritime-like.” Meanwhile, raindrop size and concentration are slightly higher in the Hubei compared to the Nanjing during the Meiyu season (Fu et al. 2020; Chen et al. 2013). In contrast, the coastal region of South China (Guangxi) has low concentrations of large raindrops during the warm season, characteristic of “continental-like” convective rainfall (Li et al. 2022). However, summer rainfall in northern China (Beijing) is marked by a high concentration of small raindrops, with sizes even smaller than those typical of “maritime-like” cluster (Han et al. 2021).
Positioned on the eastern edge of the East Asian continent and the western edge of the Pacific Ocean, eastern coastal China is heavily influenced by the East Asian monsoon, resulting in complex weather conditions. China’s eastern coast often experiences intense convective rainfalls, Meiyu season, onshore easterly waves, and typhoons during the warm season, leading to frequent short-duration heavy rainfall and prolonged torrential downpours (Wang et al. 2024; Volonté et al. 2021; Hollis et al. 2024). However, the DSD in eastern coastal China during the warm season remains underexplored, making a thorough examination of these characteristics crucial. This study leverages DSD data collected during the warm season (April to September) from 2021 to 2023 in Ningbo on the Zhejiang coast. This region is a critical segment of China’s eastern coastline, allowing for a comprehensive analysis of DSD characteristics. It is essential for understanding the microphysical characteristics of coastal precipitation, optimizing local radar QPE algorithms, and improving the accuracy of NWP models (Zhang et al. 2019b; Boodoo et al. 2015; Morrison and Milbrandt 2015; Vivekanandan et al. 2004).
The subsequent sections are organized as follows: Section 2 offers a concise overview of the DSD datasets and methods employed in this study. Section 3 examines the DSD characteristics along China’s eastern coast during the warm season, highlighting regional variations and presenting locally fitted raindrop shapeslope (μ−Λ) relationship and Z−R relationships. Finally, the discussion and conclusions are presented in Sections 4 and 5, respectively.
2. Materials and methods
2.1 Instruments and datasets
The DSD data used in this study are sourced from the second generation Parsivel disdrometer OTT2. OTT2 enhances accuracy with improved laser sheet uniformity, achieved through advanced laser equipment (Seela et al. 2017; Li et al. 2022; Fu et al. 2020). This device measures rainfall rate (R, mm h−1), radar reflectivity factor (Z, mm6 m−3), and rain type by analyzing raindrop size and fall velocity using laser attenuation as particles pass through the beam. OTT2 data are divided into 32 diameter channels and 32 fall velocity channels, with diameters ranging from 0 to 25 mm and fall velocities spanning from 0 to 20 m s−1. The OTT2 is positioned at the Fenghua National Meteorological Observatory (121.23°E, 29.42°N) in Ningbo along the east China coast (Fig. 1). This study uses OTT2 data during the warm season (April to September) for the years 2021 to 2023. Due to significant differences in DSD between typhoon and warm-season rainfall, data influenced by typhoons were excluded (Janapati et al. 2021; Li et al. 2022).

The accuracy of the OTT2 is affected by noise, sampling effects, strong winds, and raindrop splashing (Lee et al. 2005; Tokay and Short 1996; Wen et al. 2017; Janapati et al. 2021). The following measures were taken to ensure data quality: (1) 1-minute samples with fewer than 10 raindrops or R below 0.1 mm h−1 were considered noise and discarded; (2) due to a low signal-to-noise ratio, the first two diameter bins were excluded, resulting in a minimum detectable raindrop diameter of 0.25 mm (Wang et al. 2024). Additionally, raindrops with diameters exceeding 8 mm were excluded, likely due to measurement overlap; (3) samples with velocities deviating more than ±60 % from the theoretical relationship between terminal velocity and diameter (Atlas et al. 1973) were removed; (4) rainfall events lasting more than 10 minutes are considered valid, while shorter ones are disregarded. After these quality control measures, 9,349 minutes samples from the warm seasons of 2021–2023 were used in this study.
The raindrop number concentration in the i-th diameter, (N(Di), m−3 mm−1), is calculated from the DSD data using the following formula:
In the formula: nij represents the number of raindrops with the i-th diameter and j-th velocity; Di (mm) and ΔDi (mm) denote the raindrop diameter and its corresponding interval, respectively; Vj (m s−1) is the terminal velocity of raindrops in the j-th velocity class. A (m2) and Δt (s) represent the sampling area and sampling time (60 s), respectively. The total number concentration (NT, m−3), R, liquid water content (W, g m−3), and Z can be calculated based on these data using the following methods:
In formula (4), the ρw denotes the density of water, with a value of 1.0 g cm−3.
The three-parameter gamma model adeptly characterizes the DSD (Ulbrich et al. 1983; Brandes et al. 2004; Islam et al. 2012; Caracciolo et al. 2006), and is expressed as:
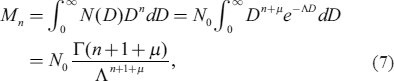
where N0 represents the intercept parameter. The truncated moment method is used to derive the three parameters (N0, μ, and Λ) based on the 2nd, 4th, and 6th moments (Zhang et al. 2003; Vivekanandan et al. 2004; Ulbrich et al. 1998). The nth-order moment is expressed as
The Dm (mm), a critical parameter in defining the DSD, is calculated by dividing the 4th moment of the DSD by its 3rd moment (Wen et al. 2016). The mathematical formulation for this is presented as
Finally, the generalized intercept parameter (Nw, mm−1 m−3) is calculated as follows:
Utilizing the classification methods by Bringi et al. (2003), precipitation in a 10-minute sliding window is classified as stratiform when the R falls between 0.5 mm h−1 and 5 mm h−1, and the standard deviation (SD) remains below 1.5 mm h−1. If the R exceeds 5 mm h−1 and the SD surpasses 1.5 mm h−1, the precipitation is classified as convective rainfall. Samples that do not meet either criterion are classified as mixed rainfall, which is not covered in this paper. As a result, convective rainfall constitutes 11.7 % (1,092 samples) of this study, while stratiform rainfall accounts for 29.9 % (2,799 samples). The average R for convective and stratiform during the warm season are 25.5 mm h−1 and 1.7 mm h−1, respectively, contributing 67.0 % and 11.1 % to the total precipitation.
3. Results
3.1 Distribution of Dm and Nw
Figure 2 presents the histograms of Dm (gray) and log10 Nw (black) along with the statistical parameters, including mean, SD, and skewness (SK), for different rain types during the warm seasons from 2021 to 2023. The mean of Dm and log10 Nw for whole datasets (1.40 mm for Dm, 3.30 for log10 Nw) and stratiform rainfall (1.44 mm for Dm, 3.25 for log10 Nw) are quite similar (Figs. 2a, b). However, the variations in Dm and log10 Nw for the stratiform are less pronounced than for the whole, with SDs of 0.35 and 0.46, respectively. Bringi et al. (2003) found that variations in DSDs are primarily due to differences in cloud microphysical processes. The melting of large dry snowflakes in stratiform rainfall results in DSDs with low concentrations of large raindrops, whereas the melting of tiny rimed snow particles leads to DSDs with high concentrations of small raindrops (Bringi et al. 2003; Zhang et al. 2019a). Therefore, the stratiform rainfall along the eastern coast of China is likely due to the melting of tiny rimed snow particles.

Compared to stratiform rainfall, convective rainfall features larger raindrops and higher number concentrations, with mean Dm and log10 Nw values of 2.21 mm and 3.51, respectively. These characteristics closely resemble the convective rainfall observed in the coast of South China (Guangxi) (Li et al. 2022). However, the number concentration is lower in comparison to the coastal regions of South China (Guangdong) (Zhang et al. 2019a), despite consistent of raindrop sizes. This discrepancy may be attributed to the incorporation of typhoon rainfall in the DSD data for Guangdong. Additionally, compared to the inland regions of China (Hubei and Nanjing) (Chen et al. 2013; Fu et al. 2020), the eastern coastal China exhibit larger raindrops and lower number concentrations in convective rainfall during the warm season. This phenomenon is even more pronounced when compared to the northern inland of China (Beijing) (Han et al. 2021). Meanwhile, compared to low-latitude regions influenced by maritime climates, such as Palau (Dm for 1.11 mm, log10 Nw for 4.56) and Taiwan (Dm for 1.24 mm and log10 Nw for 4.22) (Seela et al. 2017), the eastern coast of China also exhibits larger raindrop sizes and lower number concentrations in whole rainfall. These characteristic differences may result from the interaction of various factors such as atmospheric circulation, moisture conditions, topography, and temperature, etc. (Bringi et al. 2003; Chen et al. 2013; Wen et al. 2016; Ulbrich et al. 2007). The histogram of Dm for various rain types, as shown in Fig. 2, demonstrates positive SK. However, the SK of log10 Nw is positive for stratiform and negative for both whole and convective. This pattern closely mirrors the observations in Guangdong (Zhang et al. 2019a).
Figure 3 presents the scatter distribution of Dm-log10 Nw for two rain types observed by OTT2 during the warm seasons in eastern coastal China, alongside the average DSD characteristics of convective rainfall in other regions of China, including Guangdong (Zhang et al. 2019a), Guangxi (Li et al. 2022), Hubei (Fu et al. 2020), Nanjing (Chen et al. 2013), and Beijing (Han et al. 2021). The gray boxes indicate the categories of convective proposed by Bringi et al. (2003) for “maritime-like” (Dm = 1.5 ~ 1.75 mm, log10 Nw = 4 ~ 4.5) and “continental-like” (Dm = 2.0 ~ 2.75 mm, log10 Nw = 3 ~ 3.5). The results show that convective rainfall during the warm season along China’s eastern coast is predominantly “continentallike,” with only eight samples falling within the “maritime-like” cluster. This characteristic closely resembles that observed in Guangxi. However, convective rainfall in inland of China (Hubei, Nanjing, Beijing) tends to exhibit more “maritime-like” cluster. This further indicates significant regional variations in DSDs. Additionally, the DSDs of different rain types within the same region show significant variation (Ji et al. 2019; Han et al. 2021; Wen et al. 2017). Compared to typhoon rainfall affecting the eastern coastal China, warm season rainfall is characterized by larger raindrops and lower number concentrations (Wang et al. 2024). This observation aligns with the findings of Radhakrishna et al. (2016) regarding the DSDs of typhoon versus non-typhoon rainfall.

It is shown in Fig. 4 that scatter plots of Dm and Nw versus R are presented for the convective and stratiform, allowing further analysis of the effect of raindrop size and concentration on R and rain type. These scatter plots are fitted using the least squares method and feature fitting curves for the two rain types in coastal South China (Guangxi) (Li et al. 2022) and inland China (Hubei) (Fu et al. 2020). The Dm−R fitting relationships for convective and stratiform rainfall reveal positive exponents for eastern coastal China, Guangxi, and Hubei, indicating that the R for both types increases with raindrop size in these regions. Raindrop sizes along the eastern coast of China are slightly larger than those in Guangxi during stratiform rainfall (Li et al. 2022). Conversely, in convective precipitation, when the R is below 24 mm h−1, the raindrop in eastern coastal China are smaller than those in Guangxi. However, as the R increases, raindrops in eastern coastal China exhibit a more rapid growth, eventually exceeding those in Guangxi. Moreover, raindrops in both rain types are significantly larger in eastern coastal China and Guangxi compared to those observed in Hubei (Fu et al. 2020). On the other hand, except for R above 3.8 mm h−1 in stratiform, the raindrop concentration in eastern coastal China is slightly higher than that in Guangxi. Raindrop concentration in Guangxi increases with rainfall intensity for both rain types. In contrast, raindrop concentration decreases with increasing R in stratiform in eastern coastal China, mirroring the trend observed in Hubei. The Dm and Nw values for convective are higher than those for stratiform across all three regions. The variations in raindrop concentration in convective among the regions are almost negligible.

The Nw−R fitting exponent in Hubei is negative, and its Nw value is significantly higher than that in eastern coastal China and Guangxi. Additionally, the increase in raindrop size of convective rainfall is significantly greater than the increase in Nw with rising R. This suggests that the growth in convective R is more reliant on the increase in raindrop diameter, differing from the conclusions of Bringi et al. (2003). Besides, as the R increases, the Dm value eventually reaches an equilibrium state, attained through raindrop breakup and coalescence processes (Hu et al. 1995; List et al. 1987). The raindrop Dm in convective along China’s eastern coast during the warm season stabilize at approximately 2.8 mm, which is 0.3 mm larger than those observed during typhoon-driven convective rainfall in the same area (Wang et al. 2024). These analyses suggest that the DSD characteristics in the eastern coastal and southern coastal China (Guangxi) are quite similar during the warm season, likely due to the combined influence of the East Asian monsoon and maritime climate. The coastal regions have larger raindrops and lower concentrations compared to inland areas (Hubei). Although the DSD data for Hubei also pertains to the warm season, it primarily focuses on the Meiyu season (mid-June to early July), which differs from the analysis period for the eastern and southern (Guangxi) coastal regions of China (Fu et al. 2020; Li et al. 2022). Additionally, the DSD in Hubei is primarily observed using a 2DVD, which provides more precise measurements of raindrop characteristics (Fu et al. 2020; Wen et al. 2016). These factors may also underlie the pronounced differences observed in DSD characteristics.
3.2 Composite raindrop spectra
To further analyze the microphysical characteristics of convective and stratiform rainfall during the warm season in the eastern coastal China, this study calculated the average raindrop number concentration for each raindrop diameter and fitted a three-parameter Gamma distribution (Fig. 5). Additionally, the average rainfall parameters for different rain types were also calculated, as shown in Table 1. It can be seen that the N(D) of both types of rainfall exhibits a unimodal distribution, peaking at 0.3–0.6 mm (Fig. 5). However, there are significant differences in the DSDs between stratiform and convective. The convective exhibits higher number concentrations across all riandrop diameters compared to stratiform, with the most pronounced differences in smaller raindrops. Additionally, the spectrum width of the convective exceeds that of the stratiform, reaching over 6 mm, which is greater than the typhoon convective precipitation in this area (D > 5 mm) (Wang et al. 2024). These microphysical differences result in higher raindrop size, raindrop concentration, liquid water content, and rainfall rate in convective compared to the stratiform and whole (Table 1). On the other hand, both rain types during the warm season in the eastern coastal China fit well with the three-parameter Gamma distribution, demostrating some deviations observed in larger (D > 4.75 mm) and small (D ≤ 0.31 mm) raindrops. These phenomena align with the analysis of DSDs in Guangxi by Li et al. (2022). The distribution of natural raindrop may differ from the Gamma distribution used in mathematical models. Meanwhile, the discrepancies between the observed DSD and the theoretical Gamma distribution are likely due to inaccuracies in the moment estimation process. Zhang et al. (2003) identified discrepancies between the Gamma distribution model and natural DSDs. They conducted a thorough analysis of these differences, which lies beyond the scope of this study.

The analysis in the previous section demonstrates that the three-parameter Gamma distribution closely approximates the natural DSD, making it widely used in cloud microphysics research (Islam et al. 2012; Brawn et al. 2008; Vivekanandan et al. 2004). Actually, the three parameters of the Gamma model [intercept (N0), slope (Λ), and shape (μ)] are interdependent (Ulbrich et al. 2007; Zhang et al. 2019a). The μ is typically set to a constant value (μ = 0) in numerical models and radar QPE algorithms to streamline the model and minimize computational demands (Morrison and Milbrandt 2015; Zhang et al. 2001, 2003). The μ−Λ relationship provides valuable information about DSDs. It can describe local DSD features and enhance the accuracy of surface QPEs by both ground-based and space-based radars (Zhang et al. 2019b; Radhakrishna et al. 2016). However, the μ−Λ relationship varies across different regions due to the combined influence of geographical location, rainfall type, climate characteristics, and topography (Zhang et al. 2003; Li et al. 2022; Wang et al. 2024). To minimize intercept errors, we selected convective precipitation samples with more than 1000 raindrops and excluded those with Λ > 20, as they may represent observational anomalies (Zhang et al. 2003; Vivekanandan et al. 2004; Chen et al. 2013). As a result, the μ−Λ relationship for the eastern coastal China during the warm season is as follows:
Some researchers have also applied the same fitting method to obtain the local μ−Λ relationship in Florida (Zhang et al. 2003), Singapore (Kumar et al. 2011), the Palau Islands (Seela et al. 2022), Guangxi (Li et al. 2022), and Hubei (Fu et al. 2020).
Ulbrich et al. (1983) demonstrated a specific correlation between the μ−Λ relationship and raindrop size, expressed as  . Given Dm and μ, Λ can be inferred. Figure 6 displays the μ−Λ scatter plots and fitting curves for the eastern coastal region of China and other areas. The three gray lines represent the μ−Λ relationships when Dm is 1.0, 1.5, and 2.5 mm, respectively. It can be seen that, likely due to similar climatic conditions, the μ−Λ relationships in the eastern and southern (Guangxi and Guangdong) coastal China are remarkably alike, both in regions with larger Dm values. In contrast, the μ−Λ relationships in inland China (Hubei) and Florida are located in regions with smaller Dm values. This indicates that smaller raindrops correspond to lower μ values for a given Λ, suggesting that the μ−Λ relationship is likely influenced by geographical location and DSDs (Zhang et al. 2003; Seela et al. 2017).
3.4 Z–R relationship
Many studies indicate that the accuracy of radar QPE is mainly determined by the Z–R relationship (Zhang et al. 2001; Vivekanandan et al. 2004; Cifelli et al. 2011). Significant variations in Z–R relationships for different rain types across regions mean that radar QPE systems generally do not use a standardized Z–R relationship. The Next-Generation Weather Radar (NEXRAD) of America has determined the Z–R relationship for convective precipitation in mid-latitude regions to be Z = 300R1.40 (Fulton et al. 1998). Additionally, the Z–R relationship Z = 250R1.2 is widely applied in tropical regions (Rosenfeld et al. 1993). It is essential to identify a locally appropriate Z–R relationship to significantly enhance the accuracy of radar QPE. Figure 7 shows the Z–R scatter distribution and the fitted Z–R relationship curve (black line) for convective during the warm season in coastal eastern China, based on the OTT2 observed DSD data. Samples with fewer than 1,000 raindrops in convective rainfall were excluded during the fitting process (Chen et al. 2013). Additionally, the fitted Z–R relationship curves for convective precipitation in southern coastal China (Guangxi and Guangdong), inland China (Hubei), and NEXRAD are also presented (Zhang et al. 2019a; Li et al. 2022; Fu et al. 2020; Fulton et al. 1998). Convective rainfall in coastal eastern China is similar to mid-latitude convective rainfall due to the relatively large coefficient A and small exponent b in the Z–R relationship (Tokay and Short 1996). When radar reflectivity is weak, rainfall rates for Guangxi, Hubei, and NEXRAD exceed those for coastal eastern China and Guangdong. However, as radar reflectivity increases, the rainfall rates for coastal eastern China, Guangdong, Hubei, and NEXRAD gradually converge and eventually surpass those for Guangxi. The above analysis further indicates that, despite being the same type of rainfall, the Z–R relationships vary across different regions, climates, and terrains.

4. Discussion
This study is the first to reveal the DSDs of warm-season rainfall along the eastern coast of China. It also establishes the appropriate μ−Λ and Z–R relationships for local convective rainfall. These findings deepen the understanding of the microphysical processes of warm-season rainfall along the eastern coast of China. Additionally, they offer researchers developing radar QPE products more reliable rainfall relationships, which are crucial for improving the accuracy of local radar QPE. However, the specific factors causing regional variations in DSD remain unclear in this study. Future research should gather ERA5 data and DSD data from different elevations across eastern coastal China, focusing on the impact of dynamics, moisture, and topography on the DSD characteristics of warm-season rainfall. Numerical simulations can be used to conduct sensitivity experiments for a quantitative analysis of how these factors affect the DSD. This study relied on data from a single disdrometer, which may not fully capture the DSD across the entire eastern coast of China. Additionally, the warm-season rainfall data in this study includes various rainfall systems such as pre-Meiyu, Meiyu, and post-Meiyu. These factors can cause variations in DSDs and Z–R relationships, which in turn affects the accuracy of radar QPE (Zeng et al. 2019; Janapati et al. 2021). Fortunately, the China Meteorological Administration has installed disdrometers at most national meteorological stations. Therefore, future research should gather more comprehensive networked DSD data in Zhejiang Province, eastern China and conduct a more detailed analysis of DSD characteristics across various rainfall systems.
Moreover, the Z–R relationship derived in this study is limited to single-polarization radar. Recent upgrades in dual-polarization radar have led to widespread research and application (Min et al. 2019; Zhao et al. 2019). Radar polarization variables (Zh, Zdr, Kdp) help identify precipitation particle phase and size, enhancing QPE accuracy (Vivekanandan et al. 1999; Cifelli et al. 2011). These polarization variables can also be simulated via the T-Matrix method from DSD data. We have further fitted the dual-polarization radar precipitation relationships using the OTT2 data in the eastern coastal China and conducted research and accuracy assessments on radar QPE. The findings will be presented in the near future.
5. Conclusion
This study used 9349 minutes DSD observation data from the Parsivel OTT2 disdrometer to analyze the DSD characteristics during the warm seasons (April to September) from 2021 to 2023 in the eastern coastal China and calculated related rainfall parameters. The warm-season precipitation was classified into convective and stratiform rain types based on R characteristics, and the differences in DSDs for each type were analyzed separately. To enhance the accuracy of radar estimates for warm-season precipitation in coastal east China, the μ−Λ and Z–R relationships for convective rainfall were fitted, yielding equations tailored to this region. The main conclusions of this study are summarized as follows:
-
(1) The average Dm (2.21 mm) and log10 Nw (3.51) for convective are higher than those for the stratiform and the whole. The Dm histograms for all rain types show positive SK. Only the log10 Nw for stratiform exhibits positive SK, whereas both convective and whole display negative SK. Compared to other regions (Guangdong, Hubei, Nanjing, Beijing), warm-season rainfall along the eastern coast of China may feature a lower concentration of large raindrops. This phenomenon is similar to that observed in the coastal regions of South China (Guangxi), where convective rainfall tends to exhibit “continental-like” characteristics. Additionally, in the warm-season convection along the eastern coast of China, the increase in R relies more on the growth of raindrop size.
-
(2) The warm-season convective and stratiform along the eastern coast of China aligns well with a three-parameter Gamma distribution model. Some discrepancies are observed between actual measurements and the Gamma distribution in the cases of large raindrops (D > 4.75 mm) and small raindrops (D ≤ 0.31 mm). Additionally, the convective exhibits the highest rainfall rate and liquid water content due to its larger raindrop and higher number concentration compared to the stratiform and the whole. Convective and stratiform contribute 67.0 % and 11.1 % to the total, respectively. A μ−Λ relationship suitable for the convective along the eastern seaboard of China is derived:
 . This relationship is similar to that of the southern coast of China, both regions characterized by larger raindrop sizes, but it differs significantly from those observed in inland China (Hubei) and Florida.
-
(3) The Z–R relationship for warm-season convective rainfall along the eastern coast of China is Z = 396.96R1.34. The large coefficient and the smaller exponent suggest that this rainfall closely resembles midlatitude convective.
Data Availability Statement
The DSD data presented in this study are available on request from the corresponding author. The data are not publicly available due to privacy.
Acknowledgments
This research was partially funded by the Zhejiang Provincial Natural Science Foundation of China (Grant No. LZJMY25D050008); Ningbo Commonweal Research Project (Grant Nos. 2023S065, 2022S181); Ningbo Key R&D and Leading the Charge with Open Competition Project (Grant No. 2023Z139); Ningbo Meteorological Science and Technology Project (Grant Nos. NBQX2024004A, NBQX2023004B); Guangxi Key R&D Program (Grant Nos. AB22080104, AB 22035016). The authors gratefully thank the reviewers for their precise and constructive remarks, which significantly helped improve the manuscript.
References
- Atlas, D., R. C. Srivastava, and R. S. Sekhon, 1973: Doppler radar characteristics of precipitation at vertical incidence. Rev. Geophys., 11, 1–35.
- Boodoo, S., D. Hudak, A. Ryzhkov, P. Zhang, N. Donaldson, D. Sills, and J. Reid, 2015: Quantitative precipitation estimation from a C-band dual-polarized radar for the 8 July 2013 flood in Toronto, Canada. J. Hydrol., 16, 2027–2044.
- Brandes, E. A., G. F. Zhang, and J. Vivekanandan, 2004: Drop size distribution retrieval with polarimetric radar: Model and application. J. Appl. Meteor., 43, 461–475.
- Brawn, D., and G. Upton, 2008: Estimation of an atmospheric gamma drop size distribution using disdrometer data. Atmos. Res., 87, 66–79.
- Bringi, V. N., V. Chandrasekar, J. Hubbert, E. Gorgucci, W. L. Randeu, and M. Schoenhuber, 2003: Raindrop size distribution in different climatic regimes from disdrometer and dualpolarized radar analysis. J. Atmos. Sci., 60, 354–365.
- Chen, B. J., J. Yang, and J. P. Pu, 2013: Statistical characteristics of raindrop size distribution in the Meiyu season observed in eastern China. J. Meteor. Soc. Japan, 91, 215–227.
- Cifelli, R., V. Chandrasekar, S. Lim, P. C. Kennedy, Y. Wang, and S. A. Rutledge, 2011: A new dual-polarization radar rainfall algorithm: Application in Colorado precipitation events. J. Atmos. Oceanic Technol., 28, 352–364.
- Caracciolo, C., F. Prodi, A. Battaglia, and F. Porcu, 2006: Analysis of the moments and parameters of a gamma DSD to infer precipitation properties: A convective stratiform discrimination algorithm. Atmos. Res., 80, 165–186.
- Del Castillo-Velarde, C. D., S. Kumar, J. M. Valdivia-Prado, A. S. Moya-Álvarez, J. L. Flores-Rojas, E. Villalobos-Puma, D. Martínez-Castro, and Y. Silva-Vidal, 2021: Evaluation of GPM dual-frequency precipitation radar algorithms to estimate drop size distribution parameters, using ground-based measurement over the central andes of Peru. Earth Syst. Environ., 5, 597–619.
- Fu, Z., X. Dong, L. Zhou, W. Cui, J. Wang, R. Wan, L. Liang, and B. Xi, 2020: Statistical characteristics of raindrop size distributions and parameters in central China during the Meiyu seasons. J. Geophys. Res.: Atmos., 125, e2019JD031954, doi: 10.1029/2019JD031954.
- Fulton, R. A., J. P. Breidenbach, D.-J. Seo, D. A. Miller, and T. O’Bannon, 1998: The WSR-88D rainfall algorithm. Wea. Forecasting, 13, 377–395.
- Han, Y., J. P. Guo, Y. X. Yun, J. Li, X. R. Guo, Y. M. Lv, D. Wang, L. Li, and Y. Zhang, 2021: Regional variability of summertime raindrop size distribution from a network of disdrometers in Beijing. Atmos. Res., 257, 105591, doi: 10.1016/j.atmosres.2021.105591.
- Hollis, M. A., J. P. Stachnik, C. Lewis-Merritt, R. R. Mccrary, and E. R. Martin, 2024: Precipitation characteristics of easterly waves across the global tropics. J. Geophys. Res.: Atmos., 129, e2023JD039957, doi: 10.1029/2023JD039957.
- Hou, A. Y., R. K. Kakar, S. Neeck, A. A. Azarbarzin, C. D. Kummerow, M. Kojima, R. Oki, K. Nakamura, and T. Iguchi, 2014: The global precipitation measurement mission. Bull. Amer. Meteor. Soc., 95, 701–722.
- Hu, Z., and R. C. Srivastava, 1995: Evolution of raindrop size distribution by coalescence, breakup, and evaporation: Theory and observations. J. Atmos. Sci., 52, 1761–1783.
- Islam, T., M. A. Rico-Ramirez, M. Thurai, and D. Han, 2012: Characteristics of raindrop spectra as normalized gamma distribution from a Joss-Waldvogel disdrometer. Atmos. Res., 108, 57–73.
- Janapati, J., B. K. Seela, P.-L. Lin, M.-T. Lee, and E. Joseph, 2021: Microphysical features of typhoon and non-typhoon rainfall observed in Taiwan, an island in the northwest Pacific. Hydrol. Earth Syst. Sci., 25, 4025–4040.
- Ji, L., H. N. Chen, L. Li, B. J. Chen, X. Xiao, M. Chen, and G. Zhang, 2019: Raindrop size distributions and rain characteristics observed by a PARSIVEL disdrometer in Beijing, northern China. Remote Sens., 11, 1479, doi: 10.3390/rs11121479.
- Jiang, J., T. Zhou, Y. Qian, C. Li, F. Song, H. Li, X. Chen, W. Zhang, and Z. Chen, 2023: Precipitation regime changes in High Mountain Asia driven by cleaner air. Nature, 623, 544–549.
- Kumar, L. S., Y. H. Lee, and J. T. Ong, 2011: Two-parameter gamma drop size distribution models for Singapore. IEEE Trans. Geosci. Remote Sens., 49, 3371–3380.
- Lee, G. W., and I. Zawadzki, 2005: Variability of drop size distributions: Noise and noise filtering in disdrometric data. J. Appl. Meteor., 44, 634–652.
- Li, X., S. Chen, Z. Li, C. Huang, and J. Hu, 2022: Statistical characteristics of warm season raindrop size distribution in the Beibu Gulf, South China. Remote Sens., 14, 4752, doi: 10.3390/rs14194752.
- List, R., N. R. Donaldson, and R. E. Stewart, 1987: Temporal evolution of drop spectra to collisional equilibrium in steady and pulsating rain. J. Atmos. Sci., 44, 362–372.
- Min, C., S. Chen, J. J. Gourley, H. Chen, A. Zhang, Y. Huang, and C. Huang, 2019: Coverage of China New Generation Weather Radar network. Adv. Meteor., 2019, 1–10.
- Morrison, H., and J. A. Milbrandt, 2015: Parameterization of cloud microphysics based on the prediction of bulk ice particle properties. Part I: Scheme description and idealized tests. J. Atmos. Sci., 72, 287–311.
- Nelson, E. L., and T. S. L’Ecuyer, 2018: Global character of latent heat release in oceanic warm rain systems. J. Geophys. Res.: Atmos., 123, 4797–4817.
- Radhakrishna, B., S. K. Satheesh, T. N. Rao, K. Saikranthi, and K. Sunilkumar, 2016: Assessment of DSDs of GPM-DPR with ground-based disdrometer at seasonal scale over Gadanki, India. J. Geophys. Res.: Atmos., 121, 11792–11802.
- Rosenfeld, D., D. B. Wolff, and D. Atlas, 1993: General probability-matched relations between radar reflectivity and rain rate. J. Appl. Meteor., 32, 50–72.
- Seela, B. K., J. Janapati, P.-L. Lin, K. K. Reddy, R. Shirooka, and P. K. Wang, 2017: A comparison study of summer season raindrop size distribution between Palau and Taiwan, two islands in Western Pacific. J. Geophys. Res.: Atmos., 122, 11787–11805.
- Seela, B. K., J. Janapati, P.-L. Lin, C.-H. Lan, R. Shirooka, H. Hashiguchi, and K. K. Reddy, 2022: Raindrop size distribution characteristics of the Western Pacific tropical cyclones measured in the Palau Islands. Remote Sens., 14, 470, doi: 10.3390/rs14030470.
- Tenório, R. S., M. C. D. S. Moraes, and H. Sauvageot, 2012: Raindrop size distribution and radar parameters in coastal tropical rain systems of northeastern Brazil. J. Appl. Meteor. Climatol., 51, 1960–1970.
- Thompson, E. J., S. A. Rutledge, B. Dolan, and M. Thurai, 2015: Drop size distributions and radar observations of convective and stratiform rain over the equatorial Indian and west Pacific Oceans. J. Atmos. Sci., 72, 4091–4125.
- Tokay, A., and D. A. Short, 1996: Evidence from tropical raindrop spectra of the origin of rain from stratiform versus convective clouds. J. Appl. Meteor., 35, 355–371.
- Uijlenhoet, R., J. A. Smith, and M. Steiner, 2003: The microphysical structure of extreme precipitation as inferred from ground-based raindrop spectra. J. Atmos. Sci., 60, 1220–1238.
- Ulbrich, C. W., 1983: Natural variations in the analytical form of the raindrop size distribution. J. Appl. Meteor., 22, 1764–1775.
- Ulbrich, C. W., and D. Atlas, 1998: Rainfall microphysics and radar properties: Analysis methods for drop size spectra. J. Appl. Meteor., 37, 912–923.
- Ulbrich, C. W., and D. Atlas, 2007: Microphysics of raindrop size spectra: Tropical continental and maritime storms. J. Appl. Meteor. Climatol., 46, 1777–1791.
- Vivekanandan, J., D. S. Zrnic, S. M. Ellis, R. Oye, A. V. Ryzhkov, and J. Straka, 1999: Cloud microphysics retrieval using S-band dual-polarization radar measurements. Bull. Amer. Meteor. Soc., 80, 381–388.
- Vivekanandan, J., G. Zhang, and E. Brandes, 2004: Polarimetric radar estimators based on a constrained gamma drop size distribution model. J. Appl. Meteor., 43, 217–230.
- Volonté, A., M. Muetzelfeldt, R. Schiemann, A. G. Turner, and N. Klingaman, 2021: Magnitude, scale, and dynamics of the 2020 Mei-yu rains and floods over China. Adv. Atmos. Sci., 38, 2082–2096.
- Wang, D., S. Chen, Y. Kong, X. Gu, X. Li, X. Nan, S. Yue, and H. Shen, 2024: Raindrop size distribution characteristics for typhoons over the coast in eastern China. Atmosphere, 15, 951, doi: 10.3390/atmos15080951.
- Wen, G., H. Xiao, H. Yang, Y. Bi, and W. Xu, 2017: Characteristics of summer and winter precipitation over northern China. Atmos. Res., 197, 390–406.
- Wen, L., K. Zhao, G. Zhang, M. Xue, B. Zhou, S. Liu, and X. Chen, 2016: Statistical characteristics of raindrop size distributions observed in east China during the Asian summer monsoon season using 2-D video disdrometer and micro rain radar data: DSD observed in east China. J. Geophys. Res.: Atmos., 121, 2265–2282.
- Wu, Y. H., and L. P. Liu, 2017: Statistical characteristics of raindrop size distribution in the Tibetan Plateau and southern China. Adv. Atmos. Sci., 34, 727–736.
- Zawadzki, I., and M. D. A. Antonio, 1988: Equilibrium raindrop size distributions in tropical rain. J. Atmos. Sci., 45, 3452–3459.
- Zeng, Q. W., Y. Zhang, H. C. Lei, Y. Q. Xie, T. C. Gao, L. F. Zhang, C. M. Wang, and Y. B. Huang, 2019: Microphysical characteristics of precipitation during pre-monsoon, monsoon, and post-monsoon periods over the South China Sea. Adv. Atmos. Sci., 36, 1103–1120.
- Zhang, A., J. Hu, S. Chen, D. Hu, and Z. Liang, 2019a: Statistical characteristics of raindrop size distribution in the Monsoon Season observed in southern China. Remote Sens., 11, 432, 432, doi: 10.3390/rs11040432.
- Zhang, A., L. Xiao, C. Min, S. Chen, M. Kulie, C. Huang, and Z. Liang, 2019b: Evaluation of latest GPM-Era high-resolution satellite precipitation products during the May 2017 Guangdong extreme rainfall event. Atmos. Res., 216, 76–85.
- Zhang, G. F., J. Vivekanandan, and E. Brandes, 2001: A method for estimating rain rate and drop size distribution from polarimetric radar measurements. IEEE Trans. Geosci. Remote Sens., 39, 830–841.
- Zhang, G. F., J. Vivekanandan, E. A. Brandes, R. Meneghini, and T. Kozu, 2003: The shape–slope relation in observed gamma raindrop size distributions: Statistical error or useful information? J. Atmos. Oceanic Technol., 20, 1106–1119.
- Zhao, K., H. Huang, M. Wang, W.-C. Lee, G. Chen, L. Wen, J. Wen, G. Zhang, M. Xue, Z. Yang, L. Liu, C. Wu, Z. Hu, and S. Chen, 2019: Recent progress in dual-polarization radar research and applications in China. Adv. Atmos. Sci., 36, 961–974.
- Zhou, Y. P., K.-M. Xu, Y. C. Sud, and A. K. Betts, 2011: Recent trends of the tropical hydrological cycle inferred from Global Precipitation Climatology Project and International Satellite Cloud Climatology Project data. J. Geophys. Res., 116, 1–20.


 for Dm values of 1.0, 1.5, and 2.5 mm, respectively.