Abstract
Using special data from the field program of “Impact of Typhoons on the Ocean in the Pacific” (2010) and an ensemble Kalman filter–based vortex initialization method, this study explores the impact of Taiwan terrain on the uncertainty in forecasting track, intensity, and rainfall of Typhoon Fanapi (2010) based on ensemble simulations. The results show that the presence of Taiwan topography leads to rapid growths of the simulation uncertainty in track and intensity during the landfall period, particularly at the earlier landfall period. The fast moving ensemble members show an earlier southward track deflection as well as weakening of intensity, resulting in a sudden increase of standard deviation in track and intensity. During the period of offshore departure from Taiwan, our analysis suggests that the latitudinal location of the long-lasting and elongated rainband to the south of the tropical cyclone (TC) center has strong dependence on the latitude of the TC center. In addition, the rainfall uncertainty in southern Taiwan is dominated by the uncertainty of the simulated TC rainband, and the latitude of the TC track can be regarded as a good predictor of the rainband's location at departure time. It is also found that the rainband develops farther to the south as the topography is elevated. Considering the fact that the rainband impinging the high mountains in the southern Central Mountain Range generates the greatest accumulated rainfall, positions where the rainband associated circulation and its interaction with topography appear to offer an explanation on the uncertainty of the simulated rainfall.
1. Introduction
The steep topography of Taiwan, especially the north–south-oriented Central Mountain Range (CMR), has a significant impact on the rainfall, track, and intensity of landfalling tropical cyclones (TCs). The complex topographic features of Taiwan and the interactions among the environment, typhoon circulation, and topography increase the difficulty in predicting typhoon track, intensity change, and precipitation (e.g., Wu and Kuo 1999; Wu et al. 2002, 2013, 2015; Jian and Wu 2008; Huang et al. 2011; Yu and Tsai 2017; Huang and Wu 2018).
The effect of topography on TC track has been extensively documented using both real-case (e.g., Wu 2001; Jian and Wu 2008; Huang et al. 2011) and idealized numerical simulations (e.g., Yeh and Elsberry 1993a, b; Lin et al. 1999, 2005; Huang et al. 2011; Wu et al. 2015; Huang and Wu 2018). One dynamical mechanism driving southward track deflection is the acceleration of the tangential winds in the region between the topography and storm center, referred to as the channeling effect (Jian and Wu 2008). Huang et al. (2011) further investigated this effect using a simulation of Typhoon Krosa (2007) and a set of numerical experiments with idealized designs of the vortex and environmental steering flow. Performing simulations with idealized designs, including a greater variety of vortex and flow regimes, Wu et al. (2015) and Huang and Wu (2018) identified a second mechanism for track deflection. They proposed that the northerly asymmetric flow in the midtroposphere is the primary feature causing the southward deflection of the simulated TC tracks.
For the landfalling TCs, topography is considered a critical factor affecting the structure and intensity change (e.g., Wu and Kuo 1999; Wu 2001; Chou et al. 2011b; Yu and Tsai 2017). Wu (2001) indicated that TC intensity is affected by Taiwan terrain, which cuts off water supply to the boundary layer. In addition, Wu et al. (2009) demonstrated that the frictional effect of terrain and the decrease of moisture and heat supply from the ocean are the primary causes of the changes in the eyewall structure as well as TC intensity. On the basis of the microwave and radar images, Chou et al. (2011b) also found that all of the 19 typhoons crossing Taiwan from 2000–2010 weakened during the landfall period.
The steepness of the topography also plays a key role in substantially increasing the total rainfall accumulation and in determining rainfall distribution over Taiwan (e.g., Wu and Kuo 1999; Lin et al. 2001; Wu 2001; Wu et al. 2002). Observational analyses of landfalling typhoons in Taiwan have demonstrated that severe rainfall primarily occurs over mountains because of orographic forcing (e.g., Yu and Cheng 2008). The distribution of rainfall is strongly modulated by the topography of the CMR, with its southwest slope receiving especially large amounts of rain (Chang et al. 1993), and the wind field associated with the TC also plays a critical role (e.g., Wang 1989; Lee et al. 2006; Yu and Cheng 2013).
Previous studies have not only provided a better understanding of the impact of Taiwan topography on landfalling typhoons but also improved the accuracy of track forecasts through improvements on numerical weather models, advanced data assimilation schemes, and the increased coverage of satellite observations (e.g., Wu et al. 2007; Chou et al. 2011a; Weissmann et al. 2011). Although there has been significant progress in TC simulations, considerable uncertainties still exist in numerical TC simulations since the results of the simulations are affected by multiple factors, such as track variation, the complicated interaction between TC circulation and topography, and cloud microphysics (Wu and Kuo 1999). Ensemble forecasts, which have been used extensively to study typhoon rainfall events in the Taiwan region in recent years (e.g., Wu et al. 2010, 2013; Zhang et al. 2010; Fang et al. 2011; Yen et al. 2011; Fang and Kuo 2013; Chen and Wu 2016; Lin et al. 2018), can be used to quantify uncertainties in the track, intensity, and rainfall of simulated TCs. Zhang et al. (2010) demonstrated that simulations of extreme rainfall during Typhoon Morakot (2009) are improved by the use of a convection permitting mesoscale ensemble data assimilation system. In addition, through simulations of this typhoon using ensemble Kalman filter (EnKF; Wu et al. 2010) with the Advanced Research WRF Model, Yen et al. (2011) demonstrated that storm translation speed is a key factor in determining rainfall accumulation and found that a 55 % increase in storm translation speed results in a 33 % reduction in maximum rainfall accumulations. Moreover, Fang et al. (2011) indicated that Taiwan topography plays an important role in increasing rainfall variability in the case of Typhoon Morakot, but their study did not explain how exactly the terrain affected the simulated variability. Wu et al. (2013) investigated the impact of differences in TC track and rainfall distribution using ensemble simulations of Typhoon Sinlaku (2008), demonstrating that uncertainties in rainfall accumulation and distribution are strongly related to the variability of the ensemble tracks. The interaction between a TC and the large-scale flow is also a factor that influences uncertainty in TC rainfall. For instance, Chen and Wu (2016) found that uncertainty in rainfall distribution and accumulations increases in response to the mutual effects among the TC circulation, topography, and monsoon circulation.
Although the effect of Taiwan topography on the track, intensity, and rainfall of the landfalling TCs has been well investigated in many observational and numerical studies, the uncertainty of such impact in the simulations has not been thoroughly explored in the literature. To further understand the terrain's effect on simulated uncertainties, ensemble simulations on Typhoon Fanapi (2010) are conducted with a revised version of a WRF-based EnKF data assimilation system (Wu et al. 2010, 2012), assimilating all available observation data during the “Impact of Typhoons on the Ocean in the Pacific” (ITOP; D'Asaro et al. 2014) field campaign in 2010. The purpose of this study is to evaluate the impact of CMR on the uncertainty in the ensemble simulations of Fanapi and to determine whether the uncertainties in track, rainband positions, and TC-associated rainfall have a mutual influence. A brief overview of Fanapi is provided in Section 2. Descriptions of the model configuration, experimental design, and EnKF data assimilation scheme are given in Section 3. Section 4 presents the simulation results, including comparisons of track, intensity, rainbands, and rainfall distribution in the control and sensitivity experiments, particularly the uncertainty in each metric depicted by the ensemble simulations of each experiment group. Finally, a summary of this study is shown in Section 5.
2. An overview of Typhoon Fanapi
Typhoon Fanapi formed as a tropical storm at 1200 UTC 15 September 2010 to the south of the Ryukyu Islands (near 20.7°N, 127.6°E). It reached peak intensity with a minimum central sea level pressure (MSLP) of 940 hPa at 2100 UTC 18 September as it moved northwestward toward Taiwan and made landfall at Hualien in eastern Taiwan at 0000 UTC 19 September. Prior to landfall, a significant southward deflection of the vortex track was observed (Fig. 1a). The subtropical high was weak, and there was no obvious ambient steering flow during this period (Fig. 1b). After landfall, Fanapi turned westward, leaving Taiwan at 1000 UTC 19 September and moving toward Fujian Province in China.

Figures 2a and 2b show the observed composite radar reflectivity at 0000 UTC and 0600 UTC 19 September 2010. It is evident that Fanapi was a compact TC with a clear eye and organized inner eyewall, and it remained symmetric upon landfall at Taiwan (Figs. 2a, 1a). The radar reflectivity maximizes around the eyewall and in the outer rainband area concentrated to the north side of Fanapi. This asymmetry is due to the interaction between the typhoon circulation and the topography of northern Taiwan. Unsurprisingly, six hours after Fanapi's landfall, the eyewall nearly dissipated under the influence of the topography (Fig. 2b). During the same period, two primary bands of strong reflectivity were recognized. The rainband active before landfall retained and became stronger and narrower. The other rainband was located in the southwest quadrant of and closer to the storm's center. This second banding structure was roughly west–east elongating, extending from the Taiwan Strait toward the mountains in southern Taiwan. This rainband was possibly enhanced over the moist and warm ocean and also through the interaction between the rainband-associated circulation and its impinging on topography. The heaviest rainfall occurred in southwestern Taiwan, especially on the windward side of the mountains, because of orographic lifting. The 2-day accumulated rainfall in Taiwan from 0000 UTC 18 September to 0000 UTC 20 September 2010 observed by using rain gauges showed two areas of maximum rainfall concentrated in Yilan County (about 485 mm) and Kaohsiung–Pingdong Counties (about 951 mm on the plains and 1127 mm in the mountainous area) (Fig. 2c).

Changes in the track and structure of typhoon Fanapi as it passed across Taiwan included southward track deflection before landfall, sudden changes of intensity and structure during landfall, and changes in rainfall distribution. Some scientific issues related to the effect of Taiwan topography on Typhoon Fanapi's track, intensity, and rainfall have been discussed in the literature (e.g., Wang et al. 2013; Huang et al. 2016; Liou et al. 2016; Yang et al. 2018). Wang et al. (2013) proposed that the asymmetric latent heating induced by Taiwan topography can reduce Fanapi's translation speed during its offshore departure, thus leading to heavy rainfall over southwestern Taiwan. In addition, Huang et al. (2016) indicated that the double intense rainfall peaks cannot be simulated as the CMR height is reduced or latent heating is turned off in the model after Fanapi's landfall. Although the above studies have demonstrated that the topography of Taiwan has a significant impact on Typhoon Fanapi, they did not explicitly address to which extent the CMR affects the simulation uncertainty as Fanapi approached and passed across Taiwan. Therefore, in this study, we focus on the role of Taiwan topography in the variability of track, intensity, and rainfall simulations.
3. Methodology and experimental design
In this study, the Advanced Research WRF Model (version 3.2.1)–based ensemble Kalman filter (EnKF; Evensen 1994, 2003) data assimilation system is used to simulate Typhoon Fanapi. The system was initially developed by Meng and Zhang (2008a, b) and was later considerably revised by Wu et al. (2010) to include additional parameters to improve vortex initialization and to add the vortex-following movingnest capability for high-resolution TC assimilation. The horizontal resolutions in the experimental setup are 54 km (121 × 91 grid points), 18 km (73 × 73 grid points), and 6 km (97 × 97 grid points) in the first (D1), second (D2), and third (D3) domains, respectively (Fig. 3). The D2 and D3 domains follow the movement of the storm to resolve the structure of Fanapi. Thirty-five vertical levels are used in the terrain-following sigma coordinate. The physical parameterizations used in the simulation include the WRF single-moment 6-class microphysics scheme (WSM6; Hong and Lim 2006), the Yonsei University (YSU) planetary boundary layer scheme (Hong et al. 2006), the Rapid Radiative Transfer Model (RRTM) scheme (Mlawer et al. 1997) for longwave radiation, and the Dudhia shortwave scheme (Dudhia 1989) for shortwave radiation. In the two coarse domains (D1 and D2), cumulus convection is parameterized with the Grell–Freitas ensemble scheme (Grell and Freitas 2014).

The simulations are initialized based on the National Centers for Environmental Prediction global reanalysis at 1° by 1° at 1800 UTC 14 September 2010. The 28 ensemble members are produced by randomly perturbing the mean analysis on a transformed stream function field as described in Zhang et al. (2006). The EnKF data assimilation system update cycle is conducted every 1 h during the initialization from 1800 UTC 14 September to 0200 UTC 18 September 2010 using convectional data and the aircraft dropwindsonde observations collected during ITOP from the Dropwindsonde Observations for Typhoon Surveillance near the Taiwan Region (DOTSTAR) Astra (Wu et al. 2005) and three U.S. C-130 flights (Fig. 3). The TC center position, minimum central sea level pressure, and axisymmetric wind profile structure are also assimilated as a special technique to improve the initialization of the TC vortex, mainly following the method described in Wu et al. (2010, 2012), except that in this study the minimum central sea level pressure assimilation is added, the storm motion vector assimilation is removed, and the axisymmetric wind profile is constructed and assimilated at the C-130 flight level, 700-hPa, instead of at the surface. The D2 domain is added from the beginning of the assimilation period (1800 UTC 14 September), and the D3 is added later at 1200 UTC 15 September.
After the cycling EnKF data assimilation is performed, the control experiment (CTL) is designed as a 3-day ensemble forecasts of 28 members conducted with the initial conditions taken at 0200 UTC 18 September 2010. In order to improve our understanding of the physical processes affecting the track, intensity, and rainfall variability, a series of experiments with a 30 % increase (H130) and a 50 % reduction (H50) of the terrain height of Taiwan and no Taiwan terrain (H00) are conducted (Table 1). In addition to the 28-member ensemble forecasts, the deterministic forecast initialized from the ensemble mean (the average of 28 members) analysis is conducted for each experiment, denoted as CTL-M, H130-M, H50-M, and H00-M. Furthermore, to examine the effect of model resolution and to better resolve the terrain-induced precipitation, another high-resolution deterministic forecast experiment, denoted Fix2km-M, is carried out using an independent domain setup with four nested domains, all of which are fixed rather than vortex-following. Here, the horizontal resolutions and sizes of the second (D2), third (D3), and fourth (D4) domains are 18 km (124 × 91 grid points), 6 km (250 × 154 grid points), and 2 km (196 × 238 grid points), respectively. The area of D4 is just to cover Taiwan terrain as shown in Fig. 3 (and D2 and D3 in this experiment are not shown). The initial conditions of these fixed inner domains are regridded from the moving nested analysis using the data from the finest available domains.

Table 1.Summary of numerical experiments. “-M” denotes the deterministic forecast initialized from the ensemble mean.
4. Results
4.1 The effect of Taiwan topography on the simulation
Figure 4 shows the simulated ensemble tracks and ensemble mean of 28 members in the experiments with terrain at 0200 UTC 18 September 2010. In the CTL experiment, the ensemble mean is generally consistent with the best track analyzed by the Central Weather Bureau (CWB) of Taiwan, although it is slightly south of the best track after Fanapi moves away from Taiwan, while the ensemble members show a small spread throughout the integration. The track forecast errors in CTL-M are relatively small during the entire simulation period (the largest track error is about 120 km at 40 h), indicating that EnKF data assimilation performs reasonably well in analyzing the environmental flow and the TC vortex. As the terrain height is increased by 1.3 times (H130), the southward track deflection before landfall becomes more significant. This defection is caused by the northerly asymmetric flow induced by Taiwan terrain in the midtroposphere (figures not shown), which is also found in idealized simulations in Wu et al. (2015) and Huang and Wu (2018). In addition, as the terrain height is decreased by one-half (H50), the ensemble tracks do not have a significant direction shift as TCs approach and cross Taiwan. When the terrain of Taiwan is removed (H00), the tracks of all members change markedly, especially during the landfall period. The fact that the southward track deflection is hardly seen before landfall in the no terrain experiment (H00) highlights the critical role of terrain in these simulations.

The intensity of CTL-M at the initial time is about 945 hPa, which is very close to CWB observations (950 hPa) (Fig. 5; note the time goes from right to left). Prior to landfall, both the observed and simulated intensities reach a minimum of about 940 hPa (4 h earlier in CTL-M than from CWB), which is consistent with the statistical results in Brand and Blelloch (1974) and the idealized simulation in Bender et al. (1987). After landfall, under the influence of Taiwan terrain, the TC intensity rapidly decreases with time both in observations and simulations. The time evolution of the simulated TC intensity of 28 ensemble members is generally consistent with CTL-M, and the intensity averaged by 28 ensemble members is nearly identical to the simulation in CTL-M at each time. This result indicates that the simulation with initial condition integrated from 28 ensemble members (CTL-M) can also represent the mean intensity tendency obtained from all ensemble members. In addition, as the terrain height is increased, TC intensity decreased at a faster rate compared to those in experiments with lower or no terrain. During the period from landfall (at 1800 UTC 18 September) to departure from Taiwan (at 1200 UTC 19 September), the increases of minimum sea level pressure in H130-M, CTL-M, and H50-M are 40.8, 33.7, and 23.3 hPa, respectively. However, in H00, the intensity of simulated TCs remains steady as the vortex makes landfall.

Figure 6 shows the 2-day accumulated rainfall from 0000 UTC 18 September to 0000 UTC 20 September 2010 for each experiment initialized from the ensemble mean. Although the simulation in CTL-M captures the rainfall distribution, the extreme rainfall accumulations over the plains and mountains in Kaohsiung and Pingdong Counties are underestimated, and those over the mountains near Yilan County are overestimated (Fig. 6a). When the terrain height is increased by 1.3 times (H130), the accumulated rainfall increases in all regions of Taiwan, with the maximum rainfall in southern Taiwan increased by 47.5 % in the mountains, by 11 % in the plain area, and by 19.8 % in northeastern Taiwan as compared to CTL (Figs. 6a, d). In addition, if the terrain height is reduced by one-half (H50), less rainfall is produced in the northeast and southwest of Taiwan, but the rainfall pattern can still be captured (Fig. 6c). When there is no terrain, without enough orographic lifting, the rainfall is mainly contributed from by TC's inner core and rainband, and thus, the rainfall distribution and intensity show a marked difference (Fig. 6b). Results from cases with 2-km resolution show that the maximum accumulated rainfall increases as the horizontal resolution increased, especially in mountainous areas (Fig. 6e). Although the maximum rainfall accumulation in southwestern Taiwan increases from 804 mm in CTL-M to 1178 mm in the higher-resolution simulation (Figs. 6a, e), which is very close to the observed value of 1127 mm (Fig. 2c), the maximum rainfall accumulation in northeastern Taiwan also significantly increases to 1103 mm. It should be noted that, even though the horizontal resolution is enhanced to 2 km, the model is still unable to precisely capture the peak rainfall accumulation (mostly with an overestimation in northeastern Taiwan and an underestimation for the plains in southwestern Taiwan). This is consistent with the known limitations of models in simulations of heavy rainfall, which has previously been attributed to the interaction of the storm and topography and limitations in the physical parameterizations (e.g., Wu and Kuo 1999; Zhu and Zhang 2006; Tao et al. 2011). For a reliable assessment of model performance, we also need to take into account the insufficient rain gauge observations over mountainous areas in Taiwan, where the largest errors in simulated rainfall occur. In all, the above results imply that the terrain of Taiwan plays a vital role in affecting the variability in TC track and intensity as well as the accumulated rainfall.

4.2 The impact of Taiwan topography on the uncertainty of track and intensity simulation
Figure 7 shows the time evolution of ensemble mean track error (histograms) and standard deviation of the storm center position (solid lines). The mean track errors showed only a gradual increase before landfall (at 0000 UTC 19 September). In H00, the track error rapidly increases during the landfall period, and it can be explained by the absence of southward track deflection as shown in Fig. 4, indicating that the topography has a significant impact on the track error. The maximum track error is a deviation of around 80 km occurring at 3 h after landfall (at 0300 UTC 19 September), after which the track error continues to decrease until the TC moves into Fujian Province in China (at 1200 UTC 19 September). However, the track errors in the CTL, H50, and H130 experiments have a similar but smaller variation as compared to H00 after landfall. The standard deviation of the storm center position has a sudden increase as compared to the original rising trend after landfall in CTL and H130 (especially for H130), whereas there is no noticeable increase in H50 and H00. The experiments with higher terrain show larger variations in standard deviation. The reason for the sudden increase in standard deviation during the earlier landfall period is that the higher terrain can induce more significant southward track deflection, and thus, some ensemble members with faster translation speed are deflected southward earlier by the terrain compared to those ensemble members with slower translation speed (Figs. 8a, d), resulting in a significant variation in track position. In H50 and H00, the terrain does not have an obvious impact on southward track deflection during landfall. Therefore, there is no noticeable change in standard deviation (Figs. 8b, c). However, during the period after landfall from 0400 UTC to 1200 UTC 19 September, the standard deviation in CTL and H130 is significantly reduced, but still maintaining an increasing trend in both H50 and H00. For the westward-moving TCs approaching and crossing Taiwan, Wang (1980) and Yeh and Elsberry (1993b) suggested that the storm center would have a discontinuous track because of the formation of terrain-induced low pressure trough on the lee side of CMR. This process is also found in our simulation as TCs cross the terrain of Taiwan (figures not shown), resulting in the simulated TC center moving toward the low-pressure trough region. Therefore, a concentration of forecasted TC tracks associated with smaller track spread is identified during this period (Figs. 8a, d). However, when there is no terrain, this low-pressure trough does not exist, and thus, the standard deviation increases continuously with time (Fig. 8b). In all, the presence of terrain not only changes TC's movement, but it also increases the track uncertainty during the landfall period, especially for the cases with higher terrain.


The time evolution of ensemble mean MSLP error and standard deviation of MSLP in Fig. 9 reveal that the experiments show a small negative mean MSLP error at 4 h before landfall. After this time, the mean MSLP error increases with time, and the largest mean MSLP error occurs at 2 h after landfall. In addition, the experiments with higher terrain show a larger growth of mean MSLP error. In CTL and H130, the intensity is clearly weakened as compared to observation after landfall (cf. Fig. 5), and thus, there is a positive mean MSLP error during the landfall period. In H00, the TCs maintain their intensity and show a negative mean MSLP error after 0600 UTC 19 September, with an average error of about −20 hPa. On the other hand, the standard deviation in MSLP for CTL and H130 does not show a significant spread variation until 4 h before landfall, but the variation starts to increase after this time. The sudden increase of standard deviation begins in H130 about 3-h earlier than in CTL, and the increasing rate is also larger in H130 during the landfall period. The largest value of standard deviation in CTL and H130 occurs at approximately 1∼2 h after landfall, and then, it reduces gradually with time. Meanwhile, the standard deviation is roughly reduced to the same level as before landfall when the TCs leave Taiwan (at 1200 UTC 19 September). This result can be explained by the difference in the TC centers and the timing when the TCs begin to be influenced and weakened by terrain in each ensemble member (Figs. 8a, d). As all ensemble members hit Taiwan terrain, the degrees of their intensity reduction are quite similar, and therefore, the standard deviation among all of them starts to reduce gradually. Although TC intensity during the landfall period is also influenced by terrain in H50, the weakening of the TC intensity is smaller, and thus, the terrain plays a rather minor role in intensity variability. In H00, there is no change in intensity variability due to the lack of influence from the terrain. In all, the existence of Taiwan terrain can result in the sudden increase of intensity uncertainty, especially for the experiments with higher terrain. When the terrain is removed, the forecast errors increase during the landfall period, and the intensity uncertainty remains the same.

4.3 The uncertainties in rainfall simulation in the CTL
Figure 10 shows the 2-day accumulated rainfall associated with 28 ensemble members in southern Taiwan from 0000 UTC 18 September to 0000 UTC 20 September 2010 in CTL. Although the ensemble members can capture the main rainfall characteristics as compared to observations, the difference of maximum rainfall distribution as well as the rainfall variability among the ensemble members can be clearly identified. For instance, CTL-M06 (the sixth ensemble member in CTL) has less accumulated rainfall, and its location of maximum rainfall shows a northward deviation. By contrast, CTL-M24 (the 24th ensemble member in CTL) has more accumulated rainfall, and its location of maximum rainfall shows a southward deviation. In CTL-M06, the track shows a northerly movement deviation as compared to the track in CTL-M during the landfall period (Fig. 11a). To provide further insight into the processes of the induced rainfall uncertainties, trajectory analyses of the hourly model output are conducted using the Read/Interpolate/Plot program. The twenty 6-h backward air parcel trajectories released at 925 hPa in the rainfall region over the southwest of Taiwan show that these air parcels originate from the outer TC circulation and move through the Taiwan Strait toward the southwest of Taiwan. The low-level jet-like flow defined as horizontal wind speed beyond 35 m s−1 also extends from the northern part of the Taiwan Strait to the storm's southern inner core region. The rainband develops in the south of TC's center, where the air flows slow down and converge to the south of the TC, and this rainband associated with low-level jet-like flow moves inland and impinges the topography. This suggests that heavy rainfall is induced by the interaction between this rainband, TC circulation, and the Taiwan topography, especially near Chiayi County, where the maximum rainfall is observed. However, the track in CTL-M24 shows a southerly movement deviation (Fig. 11b), and the air parcels induce the confluence zone to the south of the TC associated with a developing convective rainband. This rainband is located father to the south as compared to CTL-M06, thus resulting in a significant southward shift of the maximum rainfall in CTL-M24.
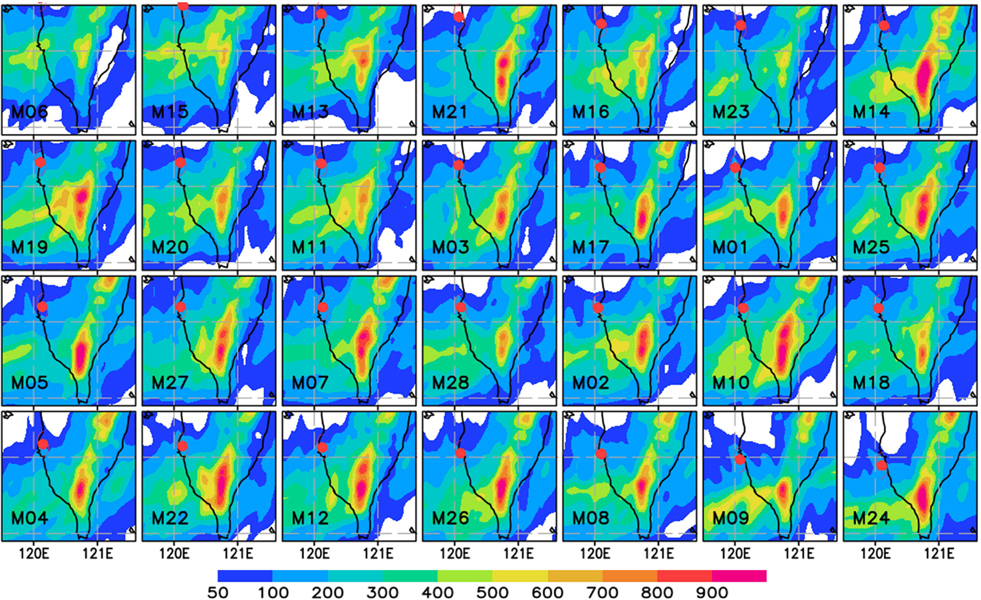

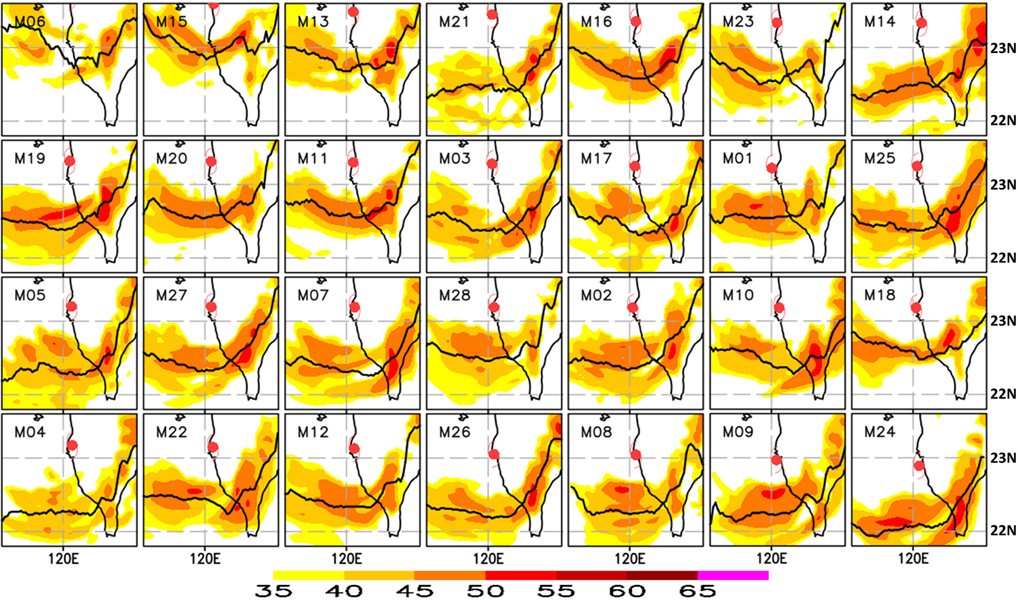
Figure 12 shows the simulated maximum radar reflectivity of 28 ensemble members as the storm centers move away from the west coast of Taiwan (i.e., toward 120.1°E), with the axis of the TC rainband defined as the central point of the rainband's width (Yu and Tsai 2017). It is found that the storm centers show spreads in latitude, and the TC rainbands and their axis among the ensemble members have similar spreads. This spread of TC rainband is related to the rainfall uncertainty in southern Taiwan. To further examine the cause of the rainfall uncertainty, the CTL ensemble members are classified into two groups according to the distribution of these rainband axes: the north-biased rainband group (NG) and the south-biased rainband group (SG) as compared to the rainband's axis of CTL-M. Each group contains eight ensemble members, and the distribution of their rainband's axis and the corresponding TC track and intensity for each member are shown in Fig. 13. It shows that the higher (lower) latitude of rainband in NG (SG) are correlated to the higher (lower) latitude of the storm center as TCs leave Taiwan (Fig. 13a), and the correlation coefficient between the latitudinal location of the storm center and rainband is 0.8 among all of the ensemble members. Meanwhile, the higher latitude of the rainband at the departure time corresponds with a higher latitude of the TC track and a rapid weakening of TC intensity during the landfall period (Figs. 13b, c). The time-lag ensemble correlation (i.e., autocorrelation) of at least 0.6 exists between the latitude of the TC track and the latitude of the storm center at the departure time (Fig. 14), suggesting that a higher latitude of the TC track from the initial time would expectedly have a more northern location of the storm center at the departure time. However, there is no significant correlation to the longitude of the TC track. In addition, the correlation between MSLP (maximum wind speed) and the latitude of the storm center at the departure time shows that the correlation rapidly increases (decreases) to 0.6 (−0.6) after landfall, implying that the stronger (weaker) intensity after landfall would expectedly have a more southern (northern) location of the storm center as TCs leave Taiwan.


The simulated composite maximum radar reflectivity shows that a west–east elongated rainband extends from southern Taiwan Strait toward the inland of southwestern Taiwan in both groups, except that the latitude of rainband in SG is more southern than NG (Fig. 15). In addition, the region of stronger composite radar reflectivity (> 35 dBZ) is more widespread in SG than in NG. Meanwhile, the low-level westerly flow is also stronger and farther to the south over the southwest of Taiwan in SG, and its impinging on the southern portion of the terrain results in stronger orographic lifting as well as heavier rainfall in the windward side of the mountains (Figs. 15b, 16b). By contrast, the region where the weaker low-level flow associated with narrower rainband interacts with the terrain is slightly farther to the north in NG, which leads to less rainfall as well as the shift of the location of the maximum rainfall farther to the north (Figs. 15a, 16a). Except for the difference in location of heavy rainfall, the maximum rainfall also shows a difference over the south of Taiwan, where the maximum rainfall difference can reach about 350 mm in the southern mountains (Fig. 16c).


The above results suggest that the uncertainty source of accumulated rainfall is primarily determined by the variability of the TC's rainband associated with the interaction between the storm circulation and the terrain of Taiwan. In addition, the simulated track latitude from the initial time can be regarded as a good predictor of the latitude of the storm center as well as the location of the TC rainband at the time when TC is leaving Taiwan. Although TC intensity after landfall seems to be another predictor of the latitude of the storm center at the departure time, the high correlation between intensity and the latitude of the storm center is also related to the latitude of the TC track (i.e., the intensity for those northward landing members is weakened more rapidly as they cross a higher and wider terrain to the north, and the southward landing members show a less intensity weakening as they cross a lower and narrower terrain to the south).
4.4 The effect of terrain height on rainfall uncertainty
The 2-day accumulated rainfall standard deviations indicate that the largest rainfall variability is located in the east and south of Taiwan, especially in mountainous areas (Fig. 17). The accumulated rainfall variability increases as the terrain height increases and reaches its maximum in H130 in the mountainous area in southern Taiwan. The area with the most intense accumulation of rainfall shown in Fig. 6 coincides with the largest rainfall variance. As compared to the distribution of each rainband's axis in those experiments with terrain at the departure time, it is found that the latitudes of the storm centers from all ensemble mean experiments (i.e., CTL-M, H50-M, and H130-M) and observation are in good agreement (Fig. 18). However, the distribution of each rainband's axis has a large deviation in latitude among the experiments with different terrain heights. The axis of the TC rainband in ensemble mean shifts to the south as terrain height increases, and this result is also found in their ensemble members. The coefficients of determination R2 of the regression among the 28 ensemble members in CTL, H130, and H50 is 0.80, 0.79, and 0.91, respectively (Fig. 19), indicating that there is a strong relationship between the latitude of the storm center and the rainband's latitude, which can have a significant impact on the rainfall distribution. In addition, the simulation result shows that the rainband's axis in CTL-M biases farther to the south as compared to the observation. A further investigation of this bias involves the model's parameterizations or the existence of systematic error in the simulation, which is beyond the scope of this study.


To better understand how Taiwan terrain affects the location of the TC rainband as TCs leave Taiwan, the 925-hPa wind field and backward air parcel trajectories are shown in Fig. 20. The analyzed results show that, as the terrain height increases, the wind field becomes more asymmetric with a long and narrow north-south flow over the Taiwan Strait. Meanwhile, the low-level wind spirals into the inner core of the TC associated with high water vapor mixing ratio. This low-level wind stream plays an important role in leading the convergence line and the TC rainband to move southward away from the storm center. This can be clearly seen in Fig. 21, where the convergence line induced by the asymmetric flow is located farther to the south in the experiments with higher terrain (e.g., H130-M and CTL-M). In all, the terrain of Taiwan not only changes the distribution and the total amount of the simulated rainfall but also induces the asymmetric flow, which increases the variability in the location of the TC rainband and further affects rainfall uncertainty.

5. Summary
Typhoon Fanapi (2010) produced heavy rainfall over the mountainous areas of Taiwan, with a maximum 2-day accumulated rainfall of 1127 mm over the southern ridge of CMR. Extensive data collected during the ITOP program are used to provide a more feasible delineation of the environment and typhoon vortex, and a unique opportunity to investigate those key processes affecting TC evolution. In this study, a WRF-based EnKF data assimilation system and all available ITOP data are integrated to evaluate the impact of CMR on the uncertainty in the ensemble simulations of Fanapi as well as the sources of the uncertainty.
The results show that the characteristics of the typhoon are generally well captured and the track spread is small throughout the integration of the control experiment, indicating a case with reasonably high predictability. In addition, the southward track deflection caused by the northerly asymmetric flow in the midtroposphere before landfall is more significant in the experiments with higher terrain, which is in agreement with previous studies in Wu et al. (2015) and Huang and Wu (2018). Moreover, the total accumulated rainfall increases in all regions of Taiwan as terrain height increases. The rainfall pattern is still captured in the experiment with halved terrain. When the topography is removed, the total rainfall accumulations decrease and the rainfall distribution is markedly changed. With 2-km horizontal grid resolution, the model is still unable to precisely identify the peak rainfall amount especially in northeastern Taiwan and on the plains of southwestern Taiwan.
The ensemble members with faster translation speed are influenced earlier by terrain and show an earlier southward track deflection and the weakening of intensity as compared to those ensemble members with slower translation speed, resulting in a significant increase of standard deviation in storm center position and MSLP, especially in the experiments with higher terrain (e.g., H130 and CTL). In addition, the terrain-induced low-pressure trough formed on the lee side of CMR tends to cause the TC to move into the same region, thus resulting in smaller track spread as TCs cross the CMR in both CTL and H130. However, the terrain does not have a clear impact on the southward track deflection and on the formation of terrain-induced low-pressure trough in H50 and H00, and thus, there is no noticeable change of standard deviation in storm center position and MSLP. These results indicate the important impact of Taiwan topography on the simulated uncertainty in both track and intensity.
Further examination of the cause of the rainfall uncertainty in the ensemble, by classifying two composite groups according to the distribution of the axis of the TC rainband that the north-biased rainband group (NG) and the south-biased rainband group (SG), reveals that the higher (lower) latitude of rainbands in the NG (SG) group are correlated to the higher (lower) latitude of the storm center as TCs left Taiwan. In addition, a significant correlation is found between the latitude of the storm center at departure time and earlier track latitude starting at the initial time, suggesting that the simulated track latitude at an earlier time in the forecast can be regarded as a good predictor of the storm center latitude as well as the location of TC rainband when TC is leaving Taiwan. Moreover, both NG and SG groups show a west–east elongated rainband extending from southern Taiwan Strait toward southern Taiwan, except that the latitude of the rainband associated with stronger low-level flow and its interaction with the terrain in SG occurs more toward the south than in NG and leads to a stronger orographic lifting as well as heavier rainfall in the southern CMR. These results suggest that positions where the rainband associated circulation and its interaction with topography appear to offer an explanation on the uncertainty of the simulated rainfall.
The 2-day accumulated rainfall standard deviations indicate that the largest rainfall variability is found in the mountainous areas of eastern and southern Taiwan. The accumulated rainfall variability increases as the terrain height increases. In addition, the TC vortex becomes more asymmetric in the cases with higher terrain (e.g., H130 and CTL), and the low-level flow spirals from the northern part of the Taiwan Strait into the inner core of the TC associated with high water vapor mixing ratio, which can contribute to the development of the convective rainband in the south side of the simulated TC. Moreover, the convergence line as well as TC rainband induced by the asymmetric flow has a more southward shift as the terrain height increases. The presence of Taiwan topography does not only change the characteristics of the simulated rainfall, but it also induces the asymmetric flow, which increases the variability in the location of the TC rainband and further affects rainfall uncertainty.
In summary, forecasting typhoon-induced rainfall near Taiwan has long been a challenging issue because of the complicated interactions among environmental flow, typhoon circulation, and the topography of Taiwan. This study highlights the impact of Taiwan topography on the uncertainties in TC simulations. We note that the main source of uncertainties in this study comes from the initial condition perturbations based on the EnKF, while the uncertainties related to model errors are not considered under the current framework. For example, the near-coastal rainfall peak on the plains of southwestern Taiwan is underestimated generally in all members and experiments, which is likely attributed to the model errors and thus limits the discussion in this study. Multi-model ensemble forecasts such as applying different physical parameterization schemes or parameters in each member can be useful in the investigation of this issue. Therefore, considerable issues are yet to be studied in the future to further understand the source of uncertainties associated with TC simulations as well as the rainfall peaks near coastal and mountainous areas, including the initial errors and model errors (e.g., the uncertainties of specific dynamics and physical processes), especially under the influence of the topography of Taiwan.
Acknowledgments
This work is supported by the Ministry of Science and Technology of Taiwan under Grants MOST 105-2628-M-002-001 and MOST 106-2111-M-002 -013 -MY3. Valuable comments from Kosuke Ito, two anonymous reviewers that helped improve the quality of the manuscript are highly appreciated.
References
- Bender, M. A., R. E. Tuleya, and Y. Kurihara, 1987: A numerical study of the effect of island terrain on tropical cyclones. Mon. Wea. Rev., 115, 130-155.
- Brand, S., and J. W. Blelloch, 1974: Changes in the characteristics of typhoons crossing the island of Taiwan. Mon. Wea. Rev., 102, 708-713.
- Chang, C.-P., T.-C. Yeh, and J. M. Chen, 1993: Effects of terrain on the surface structure of typhoons over Taiwan. Mon. Wea. Rev., 121, 734-752
- Chen, T.-C., and C.-C. Wu, 2016: The remote effect of Typhoon Megi (2010) on the heavy rainfall over northeastern Taiwan. Mon. Wea. Rev., 144, 3109-3131.
- Chou, K.-H., C.-C. Wu, P.-H. Lin, S. D. Aberson, M. Weissmann, F. Harnisch, and T. Nakazawa, 2011a: The impact of dropwindsonde observations on typhoon track forecasts in DOTSTAR and T-PARC. Mon. Wea. Rev., 139, 1728-1743.
- Chou, K.-H., C.-C. Wu, and Y. Wang, 2011b: Eyewall evolution of typhoons crossing the Philippines and Taiwan: An observational study. Terr. Atmos. Oceanic Sci., 22, 535-548.
- D'Asaro, E. A., P. G. Black, L. R. Centurioni, Y.-T. Chang, S. S. Chen, R. C. Foster, H. C. Graber, P. Harr, V. Hormann, R.-C. Lien, I.-I. Lin, T. B. Sanford, T.-Y. Tang, and C.-C. Wu, 2014: Impact of typhoons on the ocean in the Pacific. Bull. Amer. Meteor. Soc., 95, 1405-1418.
- Dudhia, J., 1989: Numerical study of convection observed during the Winter Monsoon Experiment using a mesoscale two dimensional model. J. Atmos. Sci., 46, 3077-3107.
- Evensen, G., 1994: Sequential data assimilation with a nonlinear quasi-geostrophic model using Monte Carlo methods to forecast error statistics. J. Geophys. Res., 99, 10143-10162.
- Evensen, G., 2003: The ensemble Kalman filter: Theoretical formulation and practical implementation. Ocean Dyn., 53, 343-367.
- Fang, X., and Y.-H. Kuo, 2013: Improving ensemble-based quantitative precipitation forecasts for topography-enhanced typhoon heavy rainfall over Taiwan with a modified probability-matching technique. Mon. Wea. Rev., 141, 3908-3932.
- Fang, X., Y.-H. Kuo, and A. Wang, 2011: The impacts of Taiwan topography on the predictability of Typhoon Morakot's record-breaking rainfall: A high-resolution ensemble simulation. Wea. Forecasting, 26, 613-633.
- Grell, G. A., and S. R. Freitas, 2014: A scale and aerosol aware stochastic convective parameterization for weather and air quality modeling. Atmos. Chem. Phys., 14, 5233-5250.
- Hong, S.-Y., and J.-O. J. Lim, 2006: The WRF Single-Moment 6-class Microphysics dcheme (WSM6). J. Korean Meteor. Soc., 42, 129-151.
- Hong, S.-Y., Y. Noh, and J. Dudhia, 2006: A new vertical diffusion package with an explicit treatment of entrainment processes. Mon. Wea. Rev., 134, 2318-2341.
- Huang, C.-H., and C.-C. Wu, 2018: The impact of idealized terrain on upstream tropical cyclone track. J. Atmos. Sci., 75, 3887-3910.
- Huang, C.-Y., I.-H. Wu, and L. Feng, 2016: A numerical investigation of the convective systems in the vicinity of southern Taiwan associated with Typhoon Fanapi (2010): Formation mechanism of double rainfall peaks. J. Geophys. Res., 121, 12647-12676.
- Huang, Y.-H., C.-C. Wu, and Y. Wang, 2011: The influence of island topography on typhoon track deflection. Mon. Wea. Rev., 139, 1708-1727.
- Jian, G.-J., and C.-C. Wu, 2008: A numerical study of the track deflection of Supertyphoon Haitang (2005) prior to its landfall in Taiwan. Mon. Wea. Rev., 136, 598-615.
- Lee, C.-S., L.-R. Huang, H.-S. Shen, and S.-T. Wang, 2006: A climatology model for forecasting typhoon rainfall in Taiwan. Nat. Hazards, 37, 87-105.
- Lin, K.-J., S.-C. Yang, and S. S. Chen, 2018: Reducing TC position uncertainty in an ensemble data assimilation and prediction system: A case study of Typhoon Fanapi (2010). Wea. Forecasting, 33, 561-582.
- Lin, Y.-L., J. Han, D. W. Hamilton, and C.-Y. Huang, 1999: Orographic influence on a drifting cyclone. J. Atmos. Sci., 56, 534-562.
- Lin, Y.-L., S. Chiao, T.-A. Wang, M. L. Kaplan, and R. P. Weglarz, 2001: Some common ingredients for heavy orographic rainfall. Wea. Forecasting, 16, 633-660.
- Lin, Y.-L., S.-Y. Chen, C. M. Hill, and C.-Y. Huang, 2005: Control parameters for the influence of a mesoscale mountain range on cyclone track continuity and deflection. J. Atmos. Sci., 62, 1849-1866.
- Liou, Y., T. Chen Wang, and P. Huang, 2016: The inland eyewall reintensification of Typhoon Fanapi (2010) documented from an observational perspective using multiple-Doppler radar and surface measurements. Mon. Wea. Rev., 144, 241-261.
- Meng, Z., and F. Zhang, 2008a: Test of an ensemble Kalman filter for mesoscale and regional-scale data assimilation. Part III: Comparison with 3DVAR in a real-data case study. Mon. Wea. Rev., 136, 522-540.
- Meng, Z., and F. Zhang, 2008b: Test of an ensemble Kalman filter for mesoscale and regional-scale data assimilation. Part IV: Comparison with 3DVAR in a month-long experiment. Mon. Wea. Rev., 136, 3671-3682.
- Mlawer, E. J., S. J. Taubman, P. D. Brown, M. J. Iacono, and S. A. Cloug, 1997: Radiative transfer for inhomogeneous atmospheres: RRTM, a validated correlated-k model for the longwave. J. Geophys. Res., 102, 16663-16682.
- Tao, W.-K., J. J. Shi, P.-L. Lin, J. Chen, S. Lang, M.-Y. Chang, M.-J. Yang, C.-C. Wu, C. Peters-Lidard, C.-H. Sui, and B. J.-D. Jou, 2011: High-resolution numerical simulation of the extreme rainfall associated with Typhoon Morakot. Part I: Comparing the impact of microphysics and PBL parameterizations with observations. Terr. Atmos. Oceanic Sci., 22, 673-696.
- Wang, C.-C., Y.-H. Chen, H.-C. Kuo, and S.-Y. Huang, 2013: Sensitivity of typhoon track to asymmetric latent heating/rainfall induced by Taiwan topography: A numerical study of Typhoon Fanapi (2010). J. Geophys. Res., 118, 3292-3308.
- Wang, S.-T., 1980: Prediction of the behavior and intensity of typhoons in Taiwan and its vicinity. Chinese National Science Council Research Rep. 108, 100 pp (in Chinese).
- Wang, S.-T., 1989: Track, intensity, structure, wind and precipitation characteristics of typhoons affecting Taiwan. Disaster Mitigation Research Rep. 80-73, NSC 80-04140-P052-02B, National Science Council of Taiwan, Taipei, Taiwan, 285 pp (in Chinese).
- Weissmann, M., F. Harnisch, C.-C. Wu, P.-H. Lin, Y. Ohta, K. Yamashita, Y.-H. Kim, E.-H. Jeon, T. Nakazawa, and S. Aberson, 2011: The influence of assimilating dropsonde data on typhoon track and midlatitude forecasts. Mon. Wea. Rev., 139, 908-920.
- Wu, C.-C., 2001: Numerical simulation of Typhoon Gladys (1994) and its interaction with Taiwan terrain using the GFDL hurricane model. Mon. Wea. Rev., 129, 1533-1549.
- Wu, C.-C., and Y.-H. Kuo, 1999: Typhoons affecting Taiwan: Current understanding and future challenges. Bull. Amer. Meteor. Soc., 80, 67-80.
- Wu, C.-C., T.-H. Yen, Y.-H. Kuo, and W. Wang, 2002: Rainfall simulation associated with Typhoon Herb (1996) near Taiwan. Part I: The topographic effect. Wea. Forecasting, 17, 1001-1015.
- Wu, C.-C., P.-H. Lin, S. Aberson, T.-C. Yeh, W.-P. Huang, K.-H. Chou, J.-S. Hong, G.-C. Lu, C.-T. Fong, K.-C. Hsu, I.-I. Lin, P.-L. Lin, and C.-H. Liu, 2005: Dropwindsonde observations for Typhoon Surveillance near the Taiwan Region (DOTSTAR): An overview. Bull. Amer. Meteor. Soc., 86, 787-790.
- Wu, C.-C., K.-H. Chou, P.-H. Lin, S. D. Aberson, M. S. Peng, and T. Nakazawa, 2007: The impact of dropwindsonde data on typhoon track forecasts in DOTSTAR. Wea. Forecasting, 22, 1157-1176.
- Wu, C.-C., H.-J. Cheng, Y. Wang, and K.-H. Chou, 2009: A numerical investigation of the eyewall evolution in a landfalling typhoon. Mon. Wea. Rev., 137, 21-40.
- Wu, C.-C., G.-Y. Lien, J.-H. Chen, and F. Zhang, 2010: Assimilation of tropical cyclone track and structure based on the ensemble Kalman filter (EnKF). J. Atmos. Sci., 67, 3806-3822.
- Wu, C.-C., Y.-H. Huang, and G.-Y. Lien, 2012: Concentric eyewall formation in Typhoon Sinlaku (2008). Part I: Assimilation of T-PARC data based on the ensemble Kalman filter (EnKF). Mon. Wea. Rev., 140, 506-527.
- Wu, C.-C., S.-G. Chen, S.-C. Lin, T.-H. Yen, and T.-C. Chen, 2013: Uncertainty and predictability of tropical cyclone rainfall based on ensemble simulations of Typhoon Sinlaku (2008). Mon. Wea. Rev., 141, 3517-3538.
- Wu, C.-C., T.-H. Li, and Y.-H. Huang, 2015: Influence of mesoscale topography on tropical cyclone tracks: Further examination of the channeling effect. J. Atmos. Sci., 72, 3032-3050.
- Yang, M.-J., Y.-C. Wu, and Y.-C. Liou, 2018: The study of inland eyewall reformation of Typhoon Fanapi (2010) using numerical experiments and vorticity budget analysis. J. Geophys. Res., 123, 9604-9623.
- Yeh, T.-C., and R. L. Elsberry, 1993a: Interaction of typhoons with the Taiwan orography. Part I: Upstream track deflections. Mon. Wea. Rev., 121, 3193-3212.
- Yeh, T.-C., and R. L. Elsberry, 1993b: Interaction of typhoons with the Taiwan orography. Part II: Continuous and discontinuous tracks across the island. Mon. Wea. Rev., 121, 3213-3233.
- Yen, T.-H., C.-C. Wu, and G.-Y. Lien, 2011: Rainfall simulations of Typhoon Morakot with controlled translation speed based on EnKF data assimilation. Terr. Atmos. Oceanic Sci., 22, 647-660.
- Yu, C.-K., and L.-W. Cheng, 2008: Radar observations of intense orographic precipitation associated with Typhoon Xangsane (2000). Mon. Wea. Rev., 136, 497-521.
- Yu, C.-K., and L.-W. Cheng, 2013: Distribution and mechanism of orographic precipitation associated with typhoon Morakot (2009). J. Atmos. Sci., 70, 2894-2915.
- Yu, C.-K., and C.-L. Tsai, 2017: Structural changes of an outer tropical cyclone rain band encountering the topography of northern Taiwan. Quart. J. Roy. Meteor. Soc., 143, 1107-1122.
- Zhang, F., Z. Meng, and A. Aksoy, 2006: Tests of an ensemble Kalman filter for mesoscale and regional-scale data assimilation. Part I: Perfect model experiments. Mon. Wea. Rev., 134, 722-736.
- Zhang, F., Y. Weng, Y.-H. Kuo, J. S. Whitaker, and B. Xie, 2010: Predicting Typhoon Morakot's catastrophic rainfall with a convection-permitting mesoscale ensemble system. Wea. Forecasting, 25, 1816-1825.
- Zhu, T., and D.-L. Zhang, 2006: Numerical simulation of Hurricane Bonnie (1998). Part II: Sensitivity to varying cloud microphysical processes. J. Atmos. Sci., 63, 109-126.

