Articles
A Cryogen-Free Automated Measurement System of Stable Carbon Isotope Ratio of Atmospheric Methane
2020 Volume 98 Issue 1 Pages 115-127

Details
2020 Volume 98 Issue 1 Pages 115-127
Although methane plays an important role in climate change and atmospheric chemistry, its global budget remains quantitatively uncertain mainly because of a wide variety of source types. The stable carbon isotope ratio of atmospheric methane (δ13C-CH4) is useful for separating contributions of different source categories, but owing to the complex and laborious analysis, limited measurement data exist. We present a new system for δ13C-CH4 measurement, optimized for the automated analysis of air samples. Although the system is designed, in principle, similarly to those in previous studies, we successfully set up the system with no use of cryogens (e.g., liquid nitrogen) and attained reproducibility sufficient to analyze atmospheric variations (∼0.1 ‰). We performed automated continuous measurements of ambient air outside our laboratory at about hourly intervals for 2 months, which characterized imprint of local methane sources well. Future measurement operation for flask air samples from existing atmospheric monitoring programs will provide a large number of atmospheric δ13C-CH4 data.
Methane (CH4) is an important greenhouse gas emitted from both natural and anthropogenic sources, and its removal from the atmosphere occurs primarily by the reaction with tropospheric hydroxyl radical (OH) (e.g., Saunois et al. 2016; Ito et al. 2019). Worldwide observation networks have shown the long-term, interannual, seasonal, and shorter-term variations of atmospheric CH4 mole fractions. However, many of such variations observed over the past decades still remain quantitatively unexplained (e.g., Dlugokencky et al. 2011; Cunnold et al. 2002; Bousquet et al. 2006; Morimoto et al. 2006; Schaefer et al. 2016; Nisbet et al. 2016, 2019; Rice et al. 2016; Rigby et al. 2008, 2017; Turner et al. 2017). For effective mitigation of climate change through the reduction of CH4 emissions, accurate understanding of various CH4 emission processes and their magnitude and spatiotemporal variability is needed.
The stable carbon and hydrogen isotope ratios of CH4 (δ13C-CH4 and δ2H-CH4) have been used to evaluate the contributions of different CH4 source sectors by utilizing their source-specific isotope composition signatures and the kinetic isotope effects of removal processes from the atmosphere (e.g., Quay et al. 1999; Miller et al. 2002; Schwietzke et al. 2016). The isotope ratio δ13C (and similarly for δ2H) is commonly reported using the delta notation:
 |
Measurements of atmospheric δ13C-CH4 have been made by offline conversion of CH4 to carbon dioxide (CO2) and subsequent dual-inlet isotope ratio mass spectrometry (DI-IRMS) until the 1990s (e.g., Stevens and Rust 1982; Lowe et al. 1991; Quay et al. 1999). Since the 2000s, continuous-flow isotope ratio mass spectrometry (CF-IRMS) combined with gas chromatography and a combustion furnace has become common practice (Merritt et al. 1995; Miller et al. 2002; more references in Umezawa et al. 2018). These techniques have achieved measurement reproducibility of < 0.1 ‰. Guidelines reported by the community of atmospheric greenhouse gas observations suggest a compatibility goal of 0.02 ‰ for δ13C-CH4 measurements of well-mixed background air (World Meteorological Organization 2018). However, this is still technically difficult to achieve experimentally.
Here, we present a new CF-IRMS measurement system for δ13C-CH4 in air installed at the National Institute for Environmental Studies (NIES). The advantage of our system is the absence of cryogens (e.g., liquid nitrogen) in all measurement steps, which enables unattended and automated operation of the system. To our knowledge, many of the earlier studies have used cryogens (e.g., liquid nitrogen) to cool preconcentration traps (e.g., Rice et al. 2001; Miller et al. 2002; Umezawa et al. 2009; Brass and Röckmann 2010; Tokida et al. 2014), and only one laboratory reported a preconcentration trap cooled by a cryogenfree compression cooler (Brand et al. 2016). Section 2 gives descriptions of our measurement set-up. Section 3 presents performance data of our measurement system, and Section 4 our conclusions.
Although detailed settings are different among laboratories (see Umezawa et al. 2018), the preprocessing procedure of CF-IRMS measurement for δ13C-CH4 can be commonly described as follows: (1) Sample air flows or is swept by carrier helium (He) through a preconcentration trap filled with an adsorbent maintained typically at < −120°C. This step collects CH4 in the sample air, and many other gases are flushed out. (2) The preconcentration trap is heated to liberate CH4 and transfer it to a cryofocusing trap. (3) The CH4 released from the cryofocusing trap passes through a separation column to achieve chromatographic separation from some remaining gases. (4) The CH4 is combusted to CO2 (and water) in a high-temperature furnace. (5) The CH4-derived CO2 is further separated from co-eluted atmospheric krypton (Kr) using a post-combustion separation (PCS) column. The importance of this step was recognized after Schmitt et al. (2013) (see Section 3.3). (6) The CH4-derived CO2 is introduced to an IRMS. The following sections detail our measurement set-ups.
2.1 Overview of the system
A schematic overview of the system is shown in Fig. 1. The preconcentration and cryofocusing steps are performed using a custom-made Continuous-flow Preconcentration and Refocusing (CPR) system. CPR controls valves (V1 to V4 (FPR-ND-71-6.35-2, Fujikin Inc., Japan), four-port valve (A4C4WE, Valco Instruments, Co. Inc., USA), and six-port valves A and B (A4C6WE, Valco Instruments, Co. Inc.)) and the temperatures of the two traps (T1 and T2) via custom-made software written in DaqFactory (https://www.azeotech.com/). CPR is equipped with three mass flow controllers (MFC1 (SEC-V110DM, HORIBA STEC, Co. Ltd., Japan), MFC2 (SEC-4400RO, HORIBA STEC, Co. Ltd.), and MFC3 (SEC-400MK3, HORIBA STEC, Co. Ltd.)) to regulate sample, standard, and ultra-high-purity He (> 99.99995 %, Japan Fine Products Corp., Japan) flow through traps and the gas chromatographic (GC) section. The measurement methods of CPR (i.e., a combination of valve and trap temperature settings at different steps) can be activated by receiving a trigger signal from ISODAT (software for IRMS of ThermoFisher Scientific). CPR also sends a trigger signal to the GC (Agilent 6890, Agilent Technologies, USA), which also triggers the data acquisition method of ISODAT. Accordingly, the two software programs (DaqFactory and ISODAT) run measurement methods consistently.

A schematic overview of the CPR-GC-IRMS system. The sub-system CPR is surrounded by the dotted square. The on/off valves V1 to V4, four-port valve, and six-port valves A and B are controlled pneumatically by CPR. Solid and dashed lines of the switching valves are, respectively, referred to as ON and OFF positions in the text. MFC: mass flow controller, FPSC: free piston Stirling cooler, IRMS: isotope ratio mass spectrometer.
2.2 Sample, standard, and reference gases
As shown in Fig. 1, the CPR system can introduce working standard or sample air by opening valves V1 or V3, respectively. The working standard gas is dry air containing ambient CH4 mole fraction in a 10 L high-pressure aluminum cylinder, which was compressed to 14.7 MPa at NIES, Tsukuba. Pressurized (above ambient) sample flasks can be attached upstream of V3. MFC1 controls the flow rate of sample or standard air. The measured gas is introduced to subsequent trap T1 after passing through Nafion tubing (Sigma-Aldrich, USA) and a chemical trap filled with Ascarite II (Thomas Scientific, USA) to remove water vapor and CO2. We also have a pure CO2 reference gas (> 99.995 %) in a 47 L cylinder (Japan Fine Products Corp.), which is introduced into IRMS via an open split (Fig. 1). The open split is an interface between the GC section/reference gas and the IRMS. Here, the incoming gas enters an open-to-atmosphere glass tube via a capirally. This tube is purged with carrier He, and a constant flow rate of this gas mixture is drawn by vacuum into the IRMS.
2.3 Preconcentration trap (T1)
The design of the preconcentration trap (T1) is schematically shown in Fig. 1. HayeSep D (80/100 mesh, 149 mg) adsorbent was packed into a section of 1/8″ o.d. (2.17 mm i.d.) stainless steel tubing and secured with glass wool at both ends, and the tubing was then coiled at the packed section. This shape allows the tubing a relatively large contact area with an aluminum cold block cooled by a free piston Stirling cooler (FPSC; SC-UD08, Twinbird Corp., Japan). For temperature control, a Nichrome heating wire is wound along T1, and a temperature sensor is placed in close proximity to the packed section of the trap. The coiled trap tubing with the temperature sensor has direct surface contact to the cold block inside an insulated enclosure, which was developed based on the work by Saito and Yokouchi (2008). A cooler-based system is not disrupted by the replenishment of liquid nitrogen, and therefore, it has an advantage in automated and unattended operation.
In our current standard operation method, referencing Fig. 1, the upstream line of T1 is first flushed by sample (or standard) air at 10 mL min−1 for 3 min when V3 (or V1, respectively) is open and the four-port valve and six-port valve A are at ON (solid line) and OFF (dashed line) positions, respectively. Then, six-port valve A is then switched to introduce sample air to T1, where CH4 in sample air is adsorbed at −130°C at a sample flow rate of 10 mL min−1 for 10 min (i.e., CH4 in a 100-mL sample air is collected in T1). The pressure upstream of MFC1 is kept at above ambient (controlled by a pressure regulator of the working standard air cylinder or inner pressure of a sample flask), but we cannot precisely control local pressure at T1 (downstream of MFC1). After that, the T1 temperature is set to 0°C, with six-port valves A and B in the OFF position (dashed line), by which CH4 adsorbed in T1 is liberated and pushed by He carrier gas at 1.0 mL min−1 (MFC2) to the refocusing trap (T2). Six-port valve B is then switched to the ON position (solid line), and the temperature of T1 increased to 30°C to release and vent the remaining gases (e.g., CO2, N2O, and H2O).
2.4 Refocusing trap (T2)
After eluting from T1, the CH4 from sample air is again trapped at the refocusing trap (T2). This step reduces the peak width measured on IRMS and further removes N2 and O2. T2 is 1/16″ o.d. (0.8 mm i.d.) stainless steel tubing filled with 15 mg of HayeSep D. Similarly to T1, the low temperature of T2 is achieved by contact with a cold block cooled by an FPSC (SC-UF01, Twinbird Corp.). In the tubing, HayeSep D was packed into a central ∼ 5 cm section and secured with glass wool at both ends. The HayeSep D section of the tubing was coiled a few times, along which a Nichrome heating wire was wound and a temperature sensor was secured for temperature control. The T2 temperature is set to −140°C for 4 min for refocusing of CH4 from T1, and then, the temperature is increased to 30°C to desorb the focused CH4 onto the GC separation column with six-port valve B in the ON position (solid line) at a flow rate of 1.1 mL min−1 (MFC3).
2.5 GC separations and combustion
We use a GS-CarbonPLOT column (0.32 mm ID, 30 m length, 3 µm film thickness, Agilent Technologies, USA) for the GC separation. In the GC eluent, CH4 is combusted to CO2 in a combustion furnace for subsequent IRMS measurement. The conversion is achieved in alumina tubing into which braided Cuo, NiO and Pt wires are inserted (ThermoFisher Scientific). Our standard operation maintains the furnace at a temperature of 940°C as reported by Umezawa et al. (2009). The furnace is then connected to a PoraBOND Q (0.32 mm ID, 50 m length, 5 µm thickness, Agilent Technologies) column used for PCS. The two separation columns are placed in the GC oven set at 30°C. The combustion furnace is regularly re-oxidized by introducing ultra-high-purity O2 (> 99.99995 %, Japan Fine Products). When the furnace is re-oxidized, sixport valve C is switched to the OFF position (dashed line) so that O2 gas does not flow through the PCS column, and the furnace temperature is set to 600°C according to Sperlich et al. (2012).
2.6 Mass spectrometric measurement
After the PCS column, the CH4-derived peak is transferred to Nafion tubing (installed in the GCC III Interface, ThermoFisher Scientific) to remove water vapor produced in the furnace and finally to the open split (housed in ConFlo IV, ThermoFisher Scientific) for introduction to an IRMS (Delta V Advantage, ThermoFisher Scientific). The IRMS simultaneously measures signals for m/z = 44, 45, and 46. Figure 2 shows a typical chromatogram obtained for the working standard air. A peak of the CH4, processed through the entire sample analytical line that was eventually converted to CO2, appears at retention time ∼ 1060 s. Before the CH4-derived peak, peaks of air (N2 and O2) and Kr origins appear at ∼ 880 and ∼ 970 s, respectively, and a peak from CO2 in sample air that was not completely removed by the analytical line appears at ∼ 1150 s. The rectangular peaks repeated 10 times until ∼ 600 s are injections of CO2 reference gas from the reference open split, and the last peak is used for reference of the sample peak. Currently, we determine sample δ13C-CH4 values against a δ13C value assigned for the CO2 reference gas. The CO2 reference gas was calibrated by dual-inlet IRMS measurements on the NIES δ13C-CO2 scale (Mukai 2005). Our calibration strategy to reference δ13C-CH4 measurements to the VPDB scale will be described in Section 3.5.

(a) Typical chromatogram for a measurement of the 100-mL working standard air. Black, blue, and red solid lines represent peak intensities of m/z 44, 45, and 46, respectively. Rectangular peaks repeated 10 times until ∼ 600 s are reference CO2 gas peaks from the reference open split. The CH4-derived CO2 peak (denoted as CH4) appears at ∼ 1060 s. (b) A zoom-in of (a) for retention time around the CH4-derived CO2 peak. Denoted are gases that appear in the chromatogram and should be sufficiently separated from the CH4 peak.
3.1 Preconcentration
Complete preconcentration of CH4 is crucial for attainting high-precision measurements of δ13C-CH4. Earlier studies have shown that the adsorbent HayeSep D enables efficient preconcentration of CH4 and separation from the major air component (N2 and O2) (Merrit et al. 1995; Eyer et al. 2014). We use HayeSep D accordingly and have tested various versions of preconcentration trap prototypes with different shapes and different amounts of HayeSep D. The amount of HayeSep D in the trap determines adsorption capacity, and the shape of the trap is important for efficient cooling and heating of the trap, since cooling of the trap in the CPR system is achieved by contact with the cold block.
To examine preconcentration efficiency in terms of HayeSep D amount and of the trap's shape, we made prototypes of T1 and tested them with a flame ionization detector (FID). The FID was connected after the main separation column (replaced combustion furnace and the subsequent components of Fig. 1), which precludes uncertainty that could originate from CH4 conversion to CO2 in the furnace. The prototypes included those with stainless steel tubing of 1/8″ and 1/16″ o.d. and with HayeSep D amount approximately ranging from 20 to 120 mg. The test with various prototypes suggested that quantitative adsorption of CH4 at −130°C and below requires a HayeSep D amount of > 120 mg. In addition, contact of T1 to the cold block at a larger surface area provides a more efficient and stable adsorption of CH4. Thus, we currently use T1 packed with 149 mg of HayeSep D in a coil of 1/8″ o.d. stainless steel tubing. We also tested a prototype with 280 mg of HayeSep D, but such further increase of HayeSep D amount did not increase the CH4 peak amplitude, and it could increase the amount of interfering air components adsorbed on the trap. A possible explanation is that the increased pressure inside the trap because of the enhanced flow resistance may trap a larger amount of N2 and O2. We therefore conclude that the amount of HayeSep D packed into the trap should not be increased further once adequate peak amplitude is achieved.
Figure 3 shows the response of the current T1 trap to the T1 setpoint temperature. We find stable δ13C-CH4 and peak area (m/z = 44) values at −125°C and below. This trap was also examined for response to sample air volume passing through T1 at −130°C (Fig. 4). The peak area increases linearly with the volume of sample air that passes through T1 when the trapping time is no longer than 18 min (i.e., sample volume of 180 mL or smaller). However, a longer sample flow does not increase the peak area, and for trapping times of 20–50 min, the peak areas are almost the same, indicating a partial breakthrough of CH4. δ13C-CH4 values are stable for trapping times of 7–18 min, whereas deviations occur outside of that range. The large variability for trapping times of > 20 min is due to the partial breakthrough of CH4 corresponding to the peak area response. On the other hand, for trapping times of 5 min and shorter, δ13C-CH4 clearly increases with decreasing T1 trapping time. This increase in δ13C-CH4 is due to the non-linearity of the IRMS. We confirmed the same magnitude of δ13C-CH4 increase when the amount of reference CO2 gas injected is reduced. A similar non-linearity trend in δ13C-CH4 for small peak amplitudes was reported by Umezawa et al. (2009).

δ13C-CH4 (closed circles, left axis) and peak area (m/z = 44, open circles, right axis) relationships as a function of T1 temperature.

δ13C-CH4 (closed circles, left axis) and peak area (open circles, right axis) relationships as a function of time during the preconcentration step at T1. Corresponding sample air volume is shown on the top axis.
In our set-up, we found that the CH4 adsorbed on T1 can be released adequately at a temperature of −80°C and above. This temperature of CH4 release is consistent with −85°C reported by Brass and Röckmann (2010). Some earlier studies adopted a stepwise temperature increase of the preconcentration trap (first approximately −80°C and finally above 0°C) because it practically separates CH4 from other gases adsorbed simultaneously (N2, O2, CO2, N2O, and H2O) (Umezawa et al. 2009; Brass and Röckmann 2010; Eyer et al. 2016). In this respect, we experimentally found that the peak of air (N2 and O2) detected on IRMS is reduced by setting the T1-to-T2 transfer temperature lower (closer to −80°C). On the other hand, it was also found that a rapid increase of T1 temperature to 0°C allows a more efficient and stable transfer of CH4 from T1 to T2 at the same transfer flow. We avoid stepwise temperature control during the transfer, but instead, we reduce the air-originated contamination peak by switching off the open split capillary (Section 3.4). Figure 5 shows how δ13C-CH4 and peak area change with He flow rate during the T1-to-T2 transfer. The largest peak was obtained with a flow rate of 1.0 mL min−1. The lower flow rate cannot transfer the CH4 adsorbed on T1 completely within 4 min, and the higher flow rates indicate incomplete refocusing at T2, where the heavier isotopologue 13CH4 partly breaks away. The transfer time was also optimized (not shown), with both shorter and longer times resulting in a reduced peak because of incomplete transfer and partial liberation from T2, respectively.

δ13C-CH4 (closed circles, left axis) and peak area (open circles, right axis) relationships against carrier He-flow rate when CH4 in sample air is transferred from T1 to T2.
3.2 Refocusing
For refocusing of CH4, previous studies have used capillary tubing cooled by liquid nitrogen (e.g., Rice et al. 2001; Umezawa et al. 2009; Tokida et al. 2014), but a recent study with a compression cooler (Brand et al. 2016) uses 1/16″ o.d. stainless steel tubing as per this study. For our first attempt, we used 1/32″ o.d. tubing because smaller-diameter tubing would lead to a sharper peak. However, we found inadequate CH4 adsorption with 1/32″ tubing. Our experiments showed that peak areas (m/z = 44) obtained from 1/32″-tubing T2 (HayeSep D 8 mg) are only half as large as those from 1/16″-tubing T2 (HayeSep D 15 mg). Even an increased amount of HayeSep D (17 mg) in 1/32″ tubing did not yield stable peak areas at temperatures of −130°C and below, whereas 1/16″-tubing T2 achieved quantitative adsorption at this temperature. The 1/32″- and 1/16″-tubing T2 traps with similar amounts of HayeSep D (∼ 15 mg) are different in their shape. Since the former requires a larger length for the same amount of adsorbent, it needs to be more repeatedly coiled to fit into the cold block contact configuration. It is likely that the larger diameter of the latter helps in cooling more efficiently the adsorbent packing. It is also important to note that the difference in tubing diameter changes the local pressure and linear velocity inside the trap, which can considerably affect trapping of CH4 and contributed to the above result.
Figure 6 shows how the CH4 peak changed with T2 temperature settings. The CH4 peak increases with decreasing T2 temperature, and its magnitude reaches a stable value at −130°C and below. The δ13C-CH4 trend indicates incomplete trapping of heavier 13CH4 at temperatures higher than −130°C. Also plotted are the background values of the CH4 peak (m/z 46 signal just before the peak) in gray. The background values show a rapid increase with decreasing temperature below −140°C. We found that the air (N2 and O2) peak that appears before the CH4 peak (see Fig. 2) increases with decreasing T2 temperature, especially temperatures below −140°C, and its tailing interferes with the CH4 peak.

δ13C-CH4 (closed circles, top left axis), peak area (open circles, right axis), and background (BGD) value of CH4-derived peak for m/z 46 (gray open squares, bottom left axis) as a function of T2 temperature.
3.3 GC separations and combustion
As reported by Tokida et al. (2014), we confirmed that GS-CarbonPLOT achieves better separation of CH4 from air (N2 and O2) than a PoraPLOT Q column (0.32 mm ID, 25 m, 10 µm thickness, Agilent Technologies, USA), which was widely used by previous studies (e.g., Rice et al. 2001; Umezawa et al. 2009; Brass and Röckmann 2010).
Figure 7 shows the relationship of δ13C-CH4 and peak area with the temperature of the combustion furnace. It is clearly shown in the figure that CH4 combustion is incomplete at furnace temperatures below 800°C. Such incomplete combustion yields lower δ13C-CH4 values, indicative of isotope fractionation where lighter isotopologue 12CH4 is preferentially combusted.

δ13C-CH4 (closed circles, left axis) and peak area (open circles, right axis) relationships as a function of combustion furnace temperature.
Re-oxidation of the furnace is carried out when a frequent δ13C-CH4 deviation of the measured value of the standard gas (typically > ∼ 0.2 ‰ off from the nominal value) was observed and their standard deviation becomes larger (> ∼ 0.2 ‰). This happens typically at 3 weeks or longer, and we do not observe rapid daily shifts in δ13C-CH4 through repetitive measurements as seen by Tokida et al. (2014). The re-oxidation interval depends on how frequently the system is used for sample measurement. It was found that the system tends to provide a stable measurement during periods when daily operation is continued. We empirically surmise that regular eluting of small amounts of O2 contained in sample air helps in conditioning the furnace (Miller et al. 2002). In this respect, automation of CPR is advantageous for conditioning the system constantly, since the system can be operated even during periods not used for sample analysis (e.g., nighttime).
Schmitt et al. (2013) showed that atmospheric Kr can interfere with δ13C-CH4 measurement on IRMS. Kr is present in ambient air at ∼ 1 ppm, and physicochemical separation of Kr from CH4 is difficult (Schmitt et al. 2013). To eliminate the Kr interference, some laboratories have used a PCS column (Umezawa et al. 2018) because GC separation of Kr from CO2 (derived from CH4) is easier. Brand et al. (2016) pointed out that a portion of CH4 that was not combusted in the furnace could also interfere with δ13C measurement on IRMS, since CH4+ molecular ions formed in the ion source help the CO2 gas become protonated to CO2H+ (i.e., isobaric with 13CO2+). They described that un-combusted CH4 should be separated from CO2 by using a PCS column. It is noted that our PCS column (50 m) could be shorter. We achieved the necessary precision with this column along with examinations of other various component settings, but our tests indicated that columns PoraPLOT Q (0.32 mm ID, 25 m length, 5 µm thickness, Agilent Technologies) and GS-Carbon PLOT (0.32 mm ID, 30 m length, 3 µm thickness, Agilent Technologies) are also capable of separating Kr from CH4-derived CO2. The former was used by Brand et al. (2016), and the latter was used by Tokida et al. (2014), although the lengths of the PCS columns are different in these studies because of different settings of column temperature.
3.4 Chromatogram
A typical chromatogram shows a significant intensity of the air peak (Fig. 2). We confirmed the appearance of the air peak even with the combustion furnace kept at room temperature as reported by previous studies, and it has been suggested that this peak is due to NO, N2O, and NO2 produced in the ion source (Umezawa et al. 2009; Tokida et al. 2014). It is also noted that measurement of ∼ 2 ppm CH4 in N2 showed a slightly reduced intensity of the air peak, which indicates that the presence of O2 in sample air also plays a role. We note that the air peak intensity is reduced (but not completely removed) by disconnecting the sample open split until 950 s. The Kr peak was identified by analyzing ∼ 10 ppm Kr in N2 (10 times ambient). It is also noted that, as reported by Sperlich et al. (2013) and Brand et al. (2016), multiple injections of CO2 reference gas are needed to condition the ion source and attain a more stable measurement. In our system, the first CO2 peak deviates by up to ∼ 0.5 ‰ in comparison to the last few peaks of the 10 injections.
3.5 Calibration
As described earlier, our current operation determines a sample δ13C-CH4 value against a δ13C-CO2 value assigned for the CO2 reference gas (−32.460 ± 0.007 ‰) injected in each measurement run. It is important that the reference CO2 gas has a δ13C value close to the sample's (about −47 ‰); otherwise, measurement uncertainty could be increased because of the disparity of δ13C between the sample and reference. The CO2-based calibration strategy, like our current attempt, has been used by previous measurement systems (e.g., Rice et al. 2001; Morimoto et al. 2006; Umezawa et al. 2009), but we are aware that this does not follow the identical treatment principle between the sample and standard (Werner and Brand 2001). Thus, it cannot be free from fractionations that could occur during the entire processes in sample and reference lines and their day-to-day or longer-term variability (e.g., Miller et al. 2002). In the future, we are planning to assign a δ13C-CH4 value to the working standard air so that the measured value for a sample can be determined against the measurement of a standard that is treated in an identical manner to the sample. For this purpose, the apparatus for the precise calibration of δ13C-CH4 in the working standard, as was examined by Sperlich et al. (2012, 2016), is in preparation.
3.6 Reproducibility
As an indicator of reproducibility of our measurement system, Fig. 8 shows a histogram of δ13C-CH4 deviations from the average measured value for the working standard air. The measurements of the standard air were made between November 9, 2018, and January 21, 2019 (N = 158). The standard deviation of all measurements is calculated to be 0.12 ‰. We also note that the standard deviation from repeated working standard air measurements within one day or a couple of days is better than 0.1 ‰.

A histogram of δ13C-CH4 deviations from the average for a standard air measured from November 9, 2018, to January 21, 2019 (N = 158).
3.7 Automated outside air measurements
Upstream of V3, CPR has a line that draws outside air via a metal bellows pump (MB-21, Senior Metal Bellows Corp., USA) (Fig. 1). The outside air inlet is located on the roof of a one-story building at NIES. By opening V3 and continuously introducing outside air, we made automated measurements for outside air in Tsukuba for the period November 9, 2018, to January 19, 2019. The measurements were run mainly during the time when the system was not used for flask samples or test measurements. The measurement cycle (i.e., data interval) was ∼ 1 h, and the standard air was analyzed at every 5 or 10 cycles. Figure 9 presents examples of measurement time-series. The CH4 mole fraction for outside air samples (red) was determined by peak area in comparison to those from the standard air measurements made before and after the sample. The measurement uncertainty of CH4 mole fraction by our system is estimated to be 1.2 % (∼ 25 ppb). The CH4 mole fraction of the standard air was calibrated against laboratory CH4-in-air gases whose CH4 mole fraction was determined on the NIES-94 CH4 scale (Machida et al. 2008). We note that the results presented here are preliminary, but that they show an example of how our system can provide useful on-line δ13C-CH4 data.

Time series of δ13C-CH4 measurements (blue, upper left axis) for air outside the NIES building, Tsukuba. For reference, CH4 mole fractions determined by peak area are also shown (red, lower left axis).
In the course of the two-month measurements, we observed diurnal and day-to-day variations in both CH4 mole fraction and δ13C-CH4. The observed CH4 mole fraction and δ13C-CH4 ranged from 1850 to 2180 ppb and −48.48 to −47.26 ‰, respectively. To depict diurnal variations, Fig. 10 shows δ13C-CH4 and CH4 mole fraction as a function of time of day. It is obvious that the minimum CH4 mole fraction (maximum δ13C-CH4) was nearly constant throughout the day (approximately 1900 ppb or −47.6 ‰), and the high CH4 mole fraction (low δ13C-CH4) was observed almost exclusively during nighttime to morning. In particular, we frequently observed an increase of the CH4 mole fraction overnight until around 10 am, accompanied by a decrease of δ13C-CH4. The nighttime CH4 accumulation would be explained by build-up of the nocturnal boundary layer, and the CH4 decrease afterward would be due to the formation of the daytime convective mixed layer.

Diurnal variations of δ13C-CH4 (blue, upper left axis) and CH4 mole fraction (red, lower left axis) for air outside the NIES building, Tsukuba.
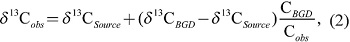
To infer CH4 sources contributing to the observed variations, some of the high CH4 events are plotted for δ13C-CH4 as a function of the reciprocal of the CH4 mole fraction (Fig. 11, often referred to as a Keeling plot). The isotope signature of the source has often been estimated by regression analysis of the Keeling plot according to the following equation (e.g., Pataki et al. 2003):
 |

A scatterplot of δ13C-CH4 as a function of the reciprocal of the CH4 mole fraction for three cases during the observation period (Case 1 in blue, Case 2 in light blue, and Case 3 in red). The solid line is the least-square linear regression applied for each case.
3.8 Flask measurements
As described earlier, when either pumped outside air or pressurized sample air stored in a flask is analyzed, the sample air comes into the system by opening V3, and it flows through MFC1, Nafion and Ascarite traps, and T1, with the four-port valve kept at the ON position (solid line), in reference to Fig. 1. This means that it is the pressure of the sample air itself (V3 upstream) that allows flow through T1 and preconcentration of CH4 in the sample air (air-flow mode). Our system has an additional measurement mode. By opening V2 and switching the four-port valve to the OFF position (dashed line), carrier He gas pushes sample air in the flask and allows it to flow through T1 for preconcentration of CH4 (He-flow mode). This measurement mode is used when the internal pressure of an air sample flask is close to the ambient pressure or below. For instance, we sometimes split aliquots of air samples (originally collected at ∼ 0.15 MPa) into 100-mL sample flasks at around ambient pressure for archive because the original sample flasks used for our air sampling networks should be routinely circulated for sample collection and measurement of various species. Such tentative archive of an air sample allows more flexibility in δ13C-CH4 measurements. It is noted that both air-flow (Eyer et al. 2016; Brand et al. 2016) and He-flow (Rice et al. 2001; Miller et al. 2002; Brass and Röckmann 2010; Morimoto et al. 2006; Umezawa et al. 2009) modes have been used previously in continuous-flow δ13C-CH4 measurements.
To confirm the consistency of measurement results between both modes, the working standard air was filled into 100-mL flasks, and those flask samples were analyzed in He-flow mode to compare with measurements in air-flow mode. In our standard method, the standard air flows through T1 for 10 min, with MFC1 set to 10 mL min−1, which preconcentrates CH4 in a gas volume of 100 mL on T1. Although this volume is equivalent to the standard air filled in a 100 mL flask at ambient pressure, our tests indicated that a 10-min He flow is not sufficient to completely flush the 100-mL flask. It was found that 20-min He flushing of a sample flask is appropriate, and the measurement results are in agreement with those at air-flow mode. For two successive days, we found the differences in the measurements between both modes to be 0.05 ± 0.10 ‰ and 0.01 ± 0.08 ‰.
We set up a new measurement system for δ13C-CH4 based on continuous-flow isotope ratio mass spectrometry. By using a custom-made preconcentration and refocusing trap system with Stirling coolers, our system requires no cryogen, which is highly advantageous in automated and unattended operation. Repetitive measurements indicated that the reproducibility of the system is 0.12 ‰. We performed automated continuous measurements of ambient air outside our laboratory building for 2 months. The results showed clear diurnal variations of CH4 mole fractions and δ13C-CH4 with amplitudes of > 200 ppb and > 0.6 ‰, respectively, which demonstrates that the variability of such amplitudes can be well characterized by our measurement. Since our system is capable of measuring air samples stored at both above and below ambient pressure, it is well optimized for monitoring operation using various flask air samples collected by existing air sampling networks. Future measurement operation will provide a number of atmospheric δ13C-CH4 data to the atmospheric science community. Accurate calibration of the standard air is our future task.
We are grateful to Yasunori Tohjima, Akihiko Ito and Yukio Terao for discussion during the set-up of the measurement system. We thank Hitoshi Mukai for δ13C measurements of CO2 and Keiichi Katsumata for help in preparing the working standard air and the CPR-FID set-up. This work has been supported by the Environmental Research and Technology Development Fund (2-1710) of the Ministry of the Environment, Japan and Environmental Restoration and Conservation Agency.