1. Introduction
1.1 The heavy rainfall event in July 2018
From June 28 to July 8, 2018, Japan experienced extremely heavy rainfall, which caused severe damage across several regions. This series of downpours was named “The Heavy Rain Event of July 2018” by the Japan Meteorological Agency (JMA). Especially in the period of July 5–8, an enhanced baiu front lingered over Japan, resulting in heavy rainfall over a wide area. Some stations registered 96-h (July 5–8) accumulated rainfall totals in excess of 500 mm (Tsuguti et al. 2019). In this study, we will refer to the period of heavy rainfall during July 5–8, 2018, as “the heavy rainfall event”.
Previous studies have proposed several factors that contributed to the heavy rainfall event. One of the characteristics of this event is extremely large precipitable water, which was realized by very humid conditions at middle levels (Takemi and Unuma 2019). During an episode of heavy rainfall of this event, an atmospheric river, which is a narrow synoptic-scale or larger moisture flow, was detected by Yatagai et al. (2019). Moteki (2019) also pointed out that cold air advection over the Sea of Japan intensified by the passage of Typhoon Prapiroon was one of the triggering factors for the formation process of the baiu front over western Japan.
According to Tsuguti et al. (2019) and Shimpo et al. (2019), the subtropical jet and the polar front jet in the upper troposphere experienced significant and persistent meanders in a meridional direction, which affected the heavy rainfall event through the extension of the North Pacific subtropical high to the southeast of Japan and through the development of the Okhotsk High. In addition, there was an active cumulus convection over the East China Sea, which locally moistened the mid- to lower troposphere. A combination of the southwesterly flow moistened with this convection, and the southerly flow of lower-tropospheric moist air along the periphery of the North Pacific subtropical high brought a huge amount of water vapor into western Japan. Sekizawa et al. (2019) also noted the importance of enhanced evaporation from the Pacific and the East China Sea for the intensified moisture transport from the south toward western Japan during the heavy rainfall event. The persistent meandering of the subtropical jet is associated with the Silk Road teleconnection pattern over the Eurasian Continent (Enomoto et al. 2003; Enomoto 2004).
During the same period, an upper-tropospheric trough emerged as a result of the meandering subtropical jet. Figure 1a shows the rainfall, precipitable water, and potential vorticity on the 350-K isentropic surface at 00 UTC on July 7, 2018. A narrow and deep trough appeared over the Korean Peninsula and the Sea of Japan, which was visible in a geostationary satellite water vapor imagery provided by the JMA (Fig. 1b). A rainfall band was distributed along the leading edge of this trough in a northeast–southwest direction, which corresponded to regions with very large volumes of precipitable water. Although this upper-tropospheric trough is shown to induce ascent dynamically along the baiu front (Takemura et al. 2019), the mechanism of how it affected the incidence of heavy rainfall is not fully elucidated. In this study, we quantitatively examine the effect of upper tropospheric trough on the heavy rainfall event.
1.2 Backgrounds
Extreme rainfall is not always brought by extremely tall convection (Hamada et al. 2015). Hamada and Takayabu (2018) statistically showed that extreme rainfall around Japan in summer time tends to be associated not with extremely tall convective systems with intense lightning activity but rather with organized rainfall systems that build large areas of stratiform rainfall. The environment related to extreme rainfall events is relatively convectively stable and very humid throughout most of the troposphere, associated with the transport of excessive moisture from the west via large-scale flow (Hamada and Takayabu 2018).
Bretherton et al. (2004) showed that rainfall rapidly increases with an increase in column water vapor over the tropical ocean. The nonlinearity in the rainfall–column water vapor relationship is largely attributed to the nonlinear increase in rainfall area, especially in stratiform regions (Ahmed and Schumacher 2015). Because organized rainfall systems contain large areas of stratiform rainfall, it follows that the mesoscale organization of rainfall is promoted with an increase in column water vapor. Using radiosonde data from the Tropical Rainfall Measuring Mission (TRMM) Kwajalein Experiment (KWAJEX) and coincident area-averaged rainfall derived from the TRMM C-band ground validation radar at Kwajalein, Bretherton et al. (2004) also showed that the area-averaged daily rainfall rates are sensitive to humidity in the mid-troposphere, rather than that in the boundary layer. Mid-tropospheric moisture is, therefore, considered as an important factor in the development and organization of deep cumulus convection over the tropical ocean (e.g., Sherwood 1999; Kuang and Bretherton 2006; Takayabu et al. 2010).
Recent studies have emphasized that large-scale conditions in the middle and upper troposphere, in addition to lower-tropospheric conditions, such as convective instability, are important in rainfall events over Japan. For example, over summertime East Asia and North Western Pacific, ascent associated with the ageostrophic secondary circulation that is induced by upper-tropospheric disturbances affects synoptic variations in rainfall and lower-tropospheric moisture (Horinouchi 2014; Horinouchi and Hayashi 2017). Note that the secondary circulation is characterized by upwelling and downwelling to the south and north of the subtropical jet, respectively. Yokoyama et al. (2017) showed that the subtropical jet plays a role in moistening the mid-troposphere during the baiu season. They found that dynamical ascent associated with the secondary circulation to the south of the jet produces environments favorable for the organization of rainfall. On the other hand, a case study by Hirota et al. (2016) examined a heavy rainfall event in August 2014 in Hiroshima, Japan. Their study showed a joint effect that acted to intensify the regional rainfall over Hiroshima: ample water vapor in the free troposphere associated with an atmospheric river (e.g., Zhu and Newell 1998; Gimeno et al. 2014; Waliser and Guan 2017) and instability and a dynamical ascent induced by an upper-tropospheric cutoff low.
More recently, Nie and Fan (2019) examined roles of dynamical forcing and diabatic heating with the quasi-geostrophic omega equation in extreme rainfall events over East China and the southeastern United States. They found that a strong ascent that is induced by dynamical forcings encourages local convection, and diabatic heating feedback is stronger over East China than over the southeastern United States. Using the idealized Column Quasi-Geostrophic modeling framework, the contributions of large-scale ascent and diabatic heating to extreme rainfall events were also quantified in Pakistan (Nie et al. 2016) and Texas (Nie et al. 2018).
In this study, we focus on the upper-tropospheric trough, which lingered over the Korean Peninsula, as one of the many factors for the heavy rainfall event in July 2018 over Japan. The objective of this study is to elucidate the characteristics of the rainfall system that brought heavy rainfall during the heavy rainfall event and to quantify the role that the upper-tropospheric trough played in this event.
2. Data and methodology
2.1 Data
The Dual-Frequency Precipitation Radar (DPR) onboard the Global Precipitation Measurement (GPM) satellite observed the heavy rainfall event at around 00:35–00:40 UTC on July 7, 2018. The major advantage that the GPM DPR provides is its capability to uniformly observe the three-dimensional structure of precipitation anywhere between 65°N and 65°S. In this study, we utilize snapshots from the Ku-band orbital product (2AKu V05; Iguchi et al. 2017) that was collected by the GPM DPR.
The GPM Spectral Latent Heating product (2HSLH V05; Shige et al. 2004, 2007, 2008, 2009; GPM SLH Algorithm Development Team 2017) is also used to examine the profiles of latent heating and Q1–QR, which is the difference between the apparent heat source (Q1; Yanai et al. 1973) and radiative heating of the atmosphere (QR). Note that the difference between latent heating and Q1–QR is the eddy heat flux convergence. The SLH algorithm consists of two separate algorithms for tropical precipitation and mid-latitude precipitation. The diabatic heating data that are analyzed in this study are retrieved using the tropical algorithm. In the tropical algorithm, spectral look-up tables are first made in terms of precipitation top height (precipitation rate at melting level) for convective and shallow stratiform precipitation (deep stratiform precipitation) based on the Tropical Ocean and Global Atmosphere Coupled Ocean–Atmosphere Response Experiment (TOGA COARE) precipitation simulated by a cloud-resolving model. Diabatic heating profiles are then retrieved with these look-up tables and three-dimensional information of precipitation observed by the GPM DPR.
Because the GPM DPR observation is spatiotemporally limited due to the narrow swath (245 km), we utilize the Global Satellite Mapping of Precipitation data (GSMaP_MVK version 7; Kubota et al. 2007, Aonashi et al. 2009) to obtain information on the temporal variation of horizontal distributions of rainfall. We also use the Automated Meteorological Data Acquisition System (AMeDAS) hourly rainfall data of the JMA.
To investigate the large-scale environment, we mainly use JRA55 reanalysis data (Kobayashi et al. 2015; Harada et al. 2016). The following variables are used: horizontal winds; vertical pressure velocity; specific humidity; relative humidity; temperature; geopotential height; latent heating rate (convective heating rate plus large-scale heating rate), which is based on model parameterization schemes; shortwave radiative heating rate; and longwave radiative heating rate. Each of these variables is given at 1.25° intervals of a latitude–longitude grid on isobaric surfaces every 6 h. Additionally, equivalent potential temperature is calculated using temperature and specific humidity. The potential vorticity on the 350-K isentropic surface, precipitable water, and surface pressure are also analyzed. Moreover, we examine the JMA radiosonde upper-air observation data at Fukuoka (33°35.0′N and 130°23.0′E) and Wajima (37°23.5′N and 136°53.7′) to verify thermodynamical profiles of reanalysis data. Radiosonde observations are conducted twice a day at 00 UTC and 12 UTC. The analysis period is from 00 UTC on July 5, 2018, to 18 UTC on July 8, 2018.
2.2 Methodology
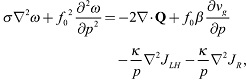
In this study, we examine the effects of dynamically forced ascent associated with an upper-tropospheric trough and diabatically generated ascent associated with cumulus convection. According to Holton (2004), the Q vector form of the quasi-geostrophic omega equation can be expressed as
where
In
Eq. (1), diabatic heating is divided into
JLH (latent heating) and
JR (radiative heating).
JLH can be estimated as the JRA55 latent heating rate, whereas
JR is the JRA55 radiative heating rate.
Vg is the geostrophic wind velocity, where
vg is its y-component.
R is the gas constant, and
κ is
R Cp−1, where
Cp is the specific heat at constant pressure.
σ is the static stability, and ∇ indicates the horizontal gradient operator. All other variables are standard symbols for meteorology. The Q-vector is calculated on the
β plane with a reference latitude of 35°.
Equation (1) indicates that vertical motion can be diagnosed with the sum of the divergence of the Q-vector (the first term on the right-hand side in the equation); the second term related to the β effect, which is generally small for synoptic-scale motion (Holton 2004); and the Laplacian of the diabatic heating (the third and fourth terms). A divergence of the Q-vector contributes to a descent associated with secondary circulation dynamically forced by geostrophic winds, whereas a convergence contributes to an ascent. The third term represents diabatically generated ascent associated with the latent heat of cumulus convection. Hereafter, the first term will be referred to as the dynamical forcing, and the third term, associated with JLH, will be called the diabatic term, even though radiative heating is not included.
Before calculating the Q-vector, we conducted a smoothing of the geopotential height and temperature with a 1-2-1 filter in both longitude and latitude directions over a 2.5° × 2.5° grid to remove variations on a scale smaller than geostrophic motions. When converting data from 1.25° to 2.5° resolution, we average each set of nine 1.25° resolution grid cells (one central grid cell and all eight surrounding grid cells) with approximate weights of 1, 0.5, and 0.25 for the central cell, adjacent four cells, and four corner cells, respectively. We also conducted smoothing of the third and fourth terms, which are of a higher-order derivation, with a 1-2-1 filter in both longitude and latitude directions. Note that in order to estimate the diabatic term not only over the path of the GPM DPR but also over areas outside the path, we use JRA55 latent heating instead of SLH. While we spotted some differences between JRA55 and SLH, the JRA55 generally offers good reproducibility of latent heating (as will be shown in Section 3.1), which corroborates the validity of applying JRA55 for estimation of the diabatic term.
To derive dynamical and diabatic vertical pressure velocity (ω), we iteratively solved Eq. (1) using the Gauss–Seidel method. The calculations were performed over 100°E–180° and 20–50°N in the layer between 1000 and 100 hPa with the condition where ω = 0 at each boundary. Dynamical ω (ωdyn) and diabatic ω (ωdia) are derived from Eq. (1), which has only the dynamical forcing and only the diabatic term on the right-hand side, respectively. Total quasi-geostrophic ω (ωqg) is derived from Eq. (1), which has all terms on the right-hand side.
3. Results
3.1 Rainfall event observed with the GPM DPR at around 00 UTC on July 7, 2018
The GPM satellite passed over Japan at around 00:35–00:40 UTC on July 7, 2018. It detected a heavy rainfall event over a wide area of Japan (Fig. 2a). Similarly, Fig. 2b shows a plan view of near-surface rainfall rates. The horizontal axis represents the GPM DPR scan numbers along the moving direction of the GPM satellite, whereas the vertical axis represents the angle bin numbers, which are numbers over the swath in a direction perpendicular to the GPM moving direction. Figure 2c shows the corresponding three-dimensional distribution of precipitation.

Left panels of Fig. 3 indicate vertical cross sections of radar reflectivity at every 5 angle bin. Reflectivity exceeding 15 dBZ is rarely observed at altitudes higher than 10 km, although rainfalls from relatively high altitudes are confirmed at the 40th and 45th angle bins for scan numbers between 2750 and 2850 (around western Japan). Most reflectivity profiles reach their maximum reflectivity values at 4–5 km, indicating the predominance of stratiform rainfall, which is characterized by “bright bands” in reflectivity. The distinction between convective and stratiform rainfall is more obvious in a vertical cross section of Q1–QR (right panels of Fig. 3). Note that the troposphere is heated in deep convective profiles, with the exception of cooling near the surface, whereas stratiform profiles are distinguished by upper-tropospheric heating and lower-tropospheric cooling. Stratiform rainfall is clearly dominant in this snapshot, which was obtained during the mature phase of this event. Convective rainfall is embedded in a large area of stratiform rainfall.

Figure 4a presents the rainfall histograms of near-surface rainfall intensity for this case from the GPM DPR scan numbers from 2700 to 3050 shown in Fig. 2b. The rainfall rates are shown in a dBR scale (10 × log10 [rainfall intensity; mm h−1]). The Y-axis indicates the sum of rainfall over DPR-observed pixels for each bin of the X-axis. The primary peak in total rainfall appears at 9.5 dBR (∼ 9 mm h−1), corresponding to that in stratiform rainfall. Meanwhile, the secondary peak at around 16.5 dBR (45 mm h−1) is largely contributed by convective rainfall. Intense rainfall is found to be a major contributor during this event; for example, rainfall with an intensity exceeding 18 dBR (63 mm h−1) accounts for 15 % of the total rainfall, whereas that exceeding 100 mm h−1 accounts for 8.9 %. Stratiform rainfall is dominant in terms of areas (stratiform/convective area ratio is 85:15), whereas convective rainfall contributes substantially to the total rainfall (stratiform/convective rainfall ratio is 65:35).

Figure 4b shows rainfall histograms of precipitation top heights, which are defined as the maximum heights with precipitation greater than or equal to 0.3 mm h−1. Rainfall with its top at moderately high altitudes (7–9 km) is a major contributor during this event, with its peak at ∼ 7.7 km. Rainfall with its top exceeding 10 km, on the other hand, represents a very small contribution, even for convective parts of rainfall.
Figure 5 shows a mean Q1–QR profile over four 2.5° × 2.5° grid cells in western Japan (as indicated in Fig. 2a), where heavy rainfall is identified. The mean Q1–QR profile shows a top-heavy structure with a heating peak at 7–8 km and a cooling below ∼ 2 km. This result is consistent with the finding that this rainfall system consisted of a large area of stratiform rainfall and the embedded convective rainfall. Comparing JRA55 latent heating with GPM SLH latent heating over the four grid cells in western Japan, we find that the JRA55 latent heating profile well captures the observed features. For example, JRA55 latent heating peaks at ∼ 6.5 km, which is approximately the same height that SLH latent heating reaches its maximum. Meanwhile, the amplitude of shallow (∼ 2 km) heating for JRA55 differs from that for SLH. This difference may be partly because of the limited ability of the GPM DPR to detect shallow light rain such as drizzle. It may also depend on the forecast model used to produce JRA55.

In summary, the GPM DPR observation reveals that the heavy rainfall event is characterized by the combination of intense convective rainfall and widespread stratiform rainfall. Rainfall from moderately high altitudes (7–9 km) is predominant both for convective and stratiform rainfall. These are characteristics of organized rainfall systems (e.g., Hamada and Takayabu 2018), which are maintained by mesoscale circulations (Houze et al. 1989).
3.2 Thermodynamic structures
Figure 6 shows vertical profiles of JRA55 temperature, equivalent potential temperature, relative humidity, and specific humidity, which were averaged over four grid cells indicated in Fig. 2a, at 00 UTC on July 7, 2018. Whereas raw values are shown in Figs. 6a–d, anomalies from the climatological average for 1989–2010 are shown in Figs. 6e–h.

The profile of temperature anomalies is very small and almost vertical in the layer below 550 hPa, indicating that the temperature stratification in the mid- to lower troposphere is nearly the same as the climatology (Fig. 6e). For the deeper layer of 1000–200 hPa, the stratification is somewhat more stable compared with the climatology, owing to warm anomalies in the layer of 500–200 hPa. Figure 6f shows that equivalent potential temperature is greater than the climatology below 200 hPa. The stratification is convectively more stable than the climatology for the 1000–450 hPa layer, whereas the stratification above the layer is convectively more unstable. Note that the lower troposphere is convectively unstable in the total field (Fig. 6b), although the anomaly field indicates relatively convectively stable stratification (Fig. 6f). Figure 6c indicates that relative humidity is very high throughout most of the troposphere. Relative humidity anomalies are larger in the mid-troposphere than in the lower troposphere, with a peak at 500 hPa elevated by 40 % or more over the climatological average. Wet anomalies are also found throughout the troposphere in terms of specific humidity (Fig. 6h).
To verify thermodynamical profiles based on JRA55 reanalysis data, we next examine those profiles based on radiosonde upper-air observations. Figures 7a–d and e–h show the profiles of the thermodynamic anomalies for JRA55 reanalysis data and radiosonde data, respectively. The locations of Fukuoka and Wajima, used for verification, are marked by x symbols in Fig. 2a. Rainfall time series observed at these two sites are depicted with AMeDAS hourly rainfall (Fig. 7i). Because radiosonde observations are conducted twice a day at 00 UTC (09 JST) and 12 UTC (21 JST), we use the time when significant rainfall is observed for the thermodynamical analysis at each site: 00 UTC (09 JST) on July 6, 2018, for Fukuoka and 12 UTC (21 JST) on July 6, 2018, for Wajima.

The JRA55 profiles (Figs. 7a–d) and radiosonde profiles (Figs. 7e–h) at Fukuoka and Wajima reveal some general characteristics. While there are some differences between JRA55 reanalysis and the radiosonde observations, the overall characteristics of the JRA55 reanalysis are consistent with those from radiosonde observations, indicating that the JRA55 profiles are reliable.
These profiles are compared with those over four grid cells of western Japan (Figs. 6e–h). The profiles for the three regions (western Japan, Wajima, and Fukuoka) are similar to one another, and the aforementioned characteristics of large-scale environments are captured in all three regions: compared with the climatology, they are somewhat stable in temperature below 200 hPa, convectively stable in the lower troposphere, and very humid throughout most of the troposphere. Very warm moist anomalies are observed at 700 hPa at Fukuoka, resulting in a stable layer between 700 and 500 hPa and strong convective instability above 700 hPa, which are not found in western Japan and Wajima. Differences in environments among the three regions are also found in terms of the total field: the stratification between 1000 and 700 hPa is somewhat convectively stable at Wajima and Fukuoka (not shown), whereas it is convectively unstable over western Japan (Fig. 6b).
The large-scale conditions identified during the heavy rainfall event are similar to those related to midsummer extreme rainfall events around Japan, which are mostly associated with organized rainfall systems (Hamada and Takayabu 2018). However, we can also identify a few differences, such as those in the depth of convectively stable layer.
The thermodynamical anomalies for this event are much larger than those for the extreme rainfall statistics shown by Hamada and Takayabu (2018). For example, the specific humidity at 500 hPa related to this event exceeds 2 g kg−1, which is more than four times the anomalous value from their statistics (∼ 0.5 g kg−1), even though the statistics of Hamada and Takayabu (2018) are for 99.9 percentile extremes. The large-scale environmental conditions that caused the heavy rainfall event are considered to be listed in the high end for such extreme rainfall events.
3.3 Effects of dynamically forced ascent associated with an upper-tropospheric trough
As shown in the previous section, we observe a free troposphere with very high moisture content over a wide area of Japan during the heavy rainfall event, suggesting that there is a mechanism capable of maintaining such extensive humidity stratification. Yokoyama et al. (2017) showed that large-scale, dynamically forced ascent promotes the generation of organized rainfall systems through the moistening of the mid-troposphere during the baiu season. Here, the effects of an upper-tropospheric narrow, deep trough on the rear of the heavy rainfall area on free-tropospheric humidity are explored in detail.
Figure 8 presents the vertically integrated moisture flux vectors from the surface to 100 hPa and their convergence at 00 UTC on July 7, 2018. The 2-m specific humidity (q) and 10-m winds (v) are used for surface variables for the integration of moisture flux convergence. Moisture flux convergence is confirmed to be a large contributor to the heavy rainfall event. Substantial moisture flux convergence is concentrated in areas with large amounts of precipitable water on the front of the trough (Fig. 1a). In a companion paper (Tsuji et al. 2020, manuscript in revision), significant southwesterly and southerly moisture transport for the free troposphere between 800 and 100 hPa is confirmed as well as moisture transport in the boundary layer. Consistent with Hamada and Takayabu (2018)'s results, free-tropospheric moisture transport by a large-scale flow partially plays a role in producing environmental conditions favorable for heavy rainfall.

Figure 9 shows the horizontal and vertical components of moisture flux convergence at 600 and 850 hPa. In addition to the substantial horizontal convergence of the southerly/southwesterly moisture flux in the lower troposphere (850 hPa), a comparable amount of vertical moisture flux convergence is identified in the mid-troposphere (600 hPa) around Japan. Water vapor is advected by the horizontal flux in the lower troposphere and lifted by ascent on the front of the trough. These large-scale environments are similar to those related to atmospheric rivers, which transport abundant moisture in the tropics to the mid-latitudes, over the Northwestern Pacific (e.g., Mundhenk et al. 2016; Hirota et al. 2016; Kamae et al. 2017a, b; Hamada and Takayabu 2018; Tsuji and Takayabu 2019; Yatagai et al. 2019).

Since ascent is not only dynamically forced but also diabatically induced by cumulus convection, it remains unclear whether dynamically forced ascent associated with the trough played a key role in the heavy rainfall event. Figure 10 shows the divergence of the Q-vector at 500 hPa, the wind speed at 200 hPa, and the potential vorticity with 2 PVU at the 350-K isentropic surface every 12 h from 00 UTC on July 5, 2018, to 12 UTC on July 8, 2018. A clear pattern of convergence of the Q-vector (ascent) emerges on the front of the narrow deep trough, where the subtropical jet is accelerating, and this condition persists around Japan for a few days. As the subtropical jet becomes stronger, the ascent increases over Japan, peaking at 00 UTC on July 7. Then, the region where the subtropical jet is accelerating begins to move eastward, resulting in a weakening of ascent over Japan. Finally, we detect divergence of the Q-vector (subsidence) over Japan at 12 UTC on July 8.

Figure 11 shows vertical cross sections of the dynamical forcing and the diabatic term of Eq. (1) along the northwest–southeast line indicated in Fig. 1a, intersecting heavy rainfall regions over western Japan. The contributions of both terms are confirmed in the strong-ascent regions near 135°E. The diabatic contribution peaks at ∼ 400 hPa, corresponding to the peak height of latent heating. By contrast, the dynamical contribution is the largest in the upper troposphere (∼ 250 hPa) and decreases gradually to 550 hPa. The dynamical contribution reaches its minimum at 550–600 hPa and then registers a secondary peak at 700–800 hPa. The double peaks of the dynamical forcing in the upper and lower troposphere are consistent with the composites of divergence of the Q-vector over summertime East Asia and Northwestern Pacific, which were conducted by Horinouchi (2014). In his study, mid- to low-level disturbances associated with upper-level disturbances are shown to be important for the upwelling in the lower troposphere. For the heavy rainfall event in July 2018, the lower-tropospheric upwelling may occur in the same way.

The profile of ω is similar to that of the diabatic term, and the dynamical contribution is relatively small compared with the diabatic contribution, in general. However, the contribution of the dynamical forcing is not negligible in the mid-troposphere and even more in the lower troposphere. For example, at 500 hPa near 135°E, the dynamical forcing is about 20–40 % of the diabatic term, suggesting that the dynamical forcing plays an important role in the heavy rainfall event.
Figure 12 shows a time series of latitude–pressure cross sections of the dynamical forcing, JRA55 ω, specific humidity, and equivalent potential temperature at 135°E. In the cross section, heavy rainfall occurs near 35°N. Air with high specific humidity in the lowest layer reaches 35°N from the tropics. The lower troposphere near 35°N is always very wet, regardless of the passage of the trough, resulting in large equivalent potential temperatures in the lowest layer and thus convective instability in the lower troposphere. The tropical stratification structure with the minimum equivalent potential temperature in the mid-troposphere is found to the south of 35°N, whereas to the north of 35°N, the equivalent potential temperature monotonically increases upward, which is indicative of a mid-latitude stratification structure.

In the mid-troposphere, on the other hand, large specific humidity values are limited in relatively narrow regions with the dynamical forcing, indicating that lower-tropospheric moisture is uplifted in these regions. Mid-tropospheric specific humidity is found to vary in association with the dynamical forcing. While the trough lingers over the Korean Peninsula, a relatively deep layer of the mid- to lower troposphere becomes moist near 35°N through the dynamically forced ascent of lower-level moist air. However, as the trough passed over Japan, regions with large specific humidity in the mid-troposphere shift together with the dynamical forcing and get gradually decoupled from regions with large specific humidity in the lower troposphere at 35°N.
Next, dynamical ω (ωdyn) and diabatic ω (ωdia) are derived from Eq. (1). Figures 13a, b show the horizontal distributions of GSMaP rainfall and JRA55 ω, and Figs. 13c, d and 13e, f show ωdyn and ωdia at 500 hPa, respectively. Distributions at 12 UTC, July 6 (left panels), and those at 00 UTC, July 7 (right panels), are shown. Note that ωdyn and ωdia are much smaller than JRA55 ω, indicating that total ω cannot be explained only by the quasi-geostrophic ω (ωqg). In order to separate roles of ωdyn and ωdia in the heavy rainfall event, however, we here examine them in the quasi-geostrophic framework.

Figures 13c–f show that both dynamical and diabatic ascents (negative value of ωdyn and ωdia) are found in the heavy rainfall region over Japan at both dates. At 00 UTC on July 7, dynamical ascent is identified extensively with its peak over the ocean to the northeast of Japan (142.5°E) on the front of the upper-tropospheric trough slightly ahead of the rainfall distribution. We can observe a better agreement between the distribution of rainfall at 00 UTC on July 7 and that of dynamical ascent at 12 UTC on 6 July, with their peaks extending from western Japan to central Japan (135–137.5°E). While the distribution of diabatic ascent well corresponds to that of the rainfall, it is suggested that dynamical ascent induced by the upper-tropospheric trough leads the rainfall and diabatic ascent in time.
Figure 14a shows the total vertical convergence of moisture flux associated with ωqg at 12 UTC, July 6. In Figs. 14b, c, vertical convergence of moisture flux is divided into that associated with ωdyn and that associated with ωdia. At 135°E, the profile of vertical convergence of moisture flux associated with ωqg shows convergence above 750 hPa, with primary and secondary peaks at around 400 and 650 hPa, respectively, and divergence below 750 hPa (Fig. 14a). Vertical convergence of moisture flux associated with ωdia, which reaches its peak at 400 hPa, is generally a large contributor to the total vertical convergence of moisture flux associated with ωqg (Fig. 14c). Meanwhile, vertical convergence of moisture flux associated with ωdyn has its peaks at 400 and 650 hPa (Fig. 14b). Moisture flux convergence associated with ωdyn in the layer of 750–550 hPa is significant and clearly separated from the upper-tropospheric convergence.

At 135°E, vertical convergence of moisture flux associated with ωdyn accounts for ∼ 25 % and ∼ 35 % of the total vertical moisture flux convergence associated with ωqg at 400 and 650 hPa, respectively. Remarkably, a significant peak of the total vertical moisture flux convergence in the mid-troposphere (650 hPa) cannot be attributed to only diabatic ascent, indicating that dynamical ascent plays an important role in producing the total vertical moisture flux convergence in the mid-troposphere.
These results consistently indicate that a dynamically forced ascent associated with the upper-tropospheric trough moistens the mid-troposphere. Thus, the upper-tropospheric dynamical effect is important for the generation of an organized rainfall system capable of producing heavy rainfall over Japan.
3.4 Differences in rainfall–environment relationships among regions
In this subsection, we compare the large-scale environments related to heavy rainfall over western Japan with environments over other regions to elucidate which environmental conditions work effectively in the formation of the heavy rainfall event. We focus on three regions, such as western Japan, southern China, and the ocean to the east of northeastern Japan at 00 UTC, July 7, because the relative contributions of dynamical and diabatic ascents differ among the three regions (Figs. 13b, d, f). The three regions are marked with dashed circles in the rainfall map (Fig. 15a). According to Figs. 13b, d, f, both dynamical and diabatic ascents are found over western Japan, whereas only diabatic ascent is active over southern China. Over the ocean to the east of northeastern Japan, we can find dynamical ascent; however, this is not associated with rainfall. Based on vertical gradient of equivalent potential temperature between 925 and 700 hPa (note the contours in Fig. 15a), the lower troposphere appears to be convectively unstable over western Japan and southern China but convectively stable over the ocean to the east of northeastern Japan.

In a similar manner to Fig. 12, latitude–pressure cross sections of the dynamical forcing of Eq. (1), JRA55 ω, specific humidity, and equivalent potential temperature at 135°E, 112.5°E, and 150°E are shown (Figs. 15b–d). Over western Japan (135°E, 35°N), we note high equivalent potential temperatures in the lowest layer, resulting in convective instability in the lower troposphere. Note that equivalent potential temperature is shown in the total field. Over western Japan, thus, the lower troposphere is convectively unstable in the total field, whereas it is relatively convectively stable compared with the climatology as shown in Figs. 6f, 7b, and 7f. The mid-troposphere is moistened by the dynamically forced ascent of lower-level moist air associated with the upper-tropospheric trough.
In contrast, over southern China (112.5°E, 25°N), the mid- to lower troposphere is moist despite the absence of obvious dynamical forcing. The lower troposphere is convectively unstable, with high equivalent potential temperatures in the lowest layer. In this region, cumulus convection may be generated associated with convective instability, resulting in the humid mid-troposphere. Over the ocean to the east of northeastern Japan (150°E, 40°N), the lower troposphere is convectively stable, with relatively low equivalent potential temperatures in the lowest layer. There is no sign of rainfall in this region, despite the confirmation of mid-tropospheric moistening associated with dynamical forcing. Previous studies have shown that generation of cumulus congestus is well determined by sea surface temperature (Takayabu et al. 2010) and convective instability in the lower troposphere (Yokoyama et al. 2017). Rainfall is scarcely produced where the lower-tropospheric convective stability is strong. This is true even though the mid-troposphere is moistened through upper-tropospheric effects.
Western Japan is provided with sufficient convective instability in the lower troposphere to initiate cumulus convection. In addition, ascent associated with the upper-tropospheric trough moistens the midtroposphere. These large-scale environments both in lower and mid- to upper troposphere produced conditions favorable for well-organized rainfall systems that brought the heavy rainfall event. Additionally, once deep cumulus convection begins, convection itself is capable of moistening the mid-troposphere through diabatically generated ascent, which enhances the conditions favorable for the organization of rainfall that brings heavy rainfall.
4. Discussion and conclusions
This study examined the heavy rainfall event during July 5–8, 2018, which caused serious damages to various regions in Japan. The heavy rainfall was brought by a mesoscale, well-organized rainfall system. The environments related to the heavy rainfall event were relatively convectively stable and very moist throughout most of the troposphere compared with the climatology.
According to Yokoyama et al. (2017), in the baiu region, deep cumulus convection can occur without the aid of mesoscale organization in highly unstable conditions, whereas cumulus convection tends to be organized in relatively less unstable conditions. Organized rainfall systems are considered to be capable of maintaining themselves by collecting mid- to lower-tropospheric water vapor efficiently through their mesoscale circulation even in less unstable conditions. Thus, it is reasonable that in the heavy rainfall event in July 2018, deep convection occurred with the aid of mesoscale organization under relatively stable (compared with the climatology) but very humid conditions, which may partly be a result of the rainfall system.
An upper-tropospheric trough, which lingered in the region from the Korean Peninsula to the Sea of Japan, helped to maintain large-scale environments favorable for the organization of rainfall. Dynamically forced ascent associated with the trough served to moisten the mid-troposphere specifically at around 650 hPa. The mid- to lower troposphere was moistened over a wide area on the front of the trough by the effects of dynamical ascent as well as the horizontal convergence of a southerly/southwesterly moisture flux. Previous studies have shown that mid-tropospheric moisture is an important factor in the development of deep cumulus convection and its organization (e.g., Sherwood 1999; Kuang and Bretherton 2006; Takayabu et al. 2010; Yokoyama et al. 2017). We emphasize that the moistening of the mid-troposphere at around 650 hPa during the heavy rainfall event was caused not only by diabatically generated ascent but by dynamically forced ascent. Once deep cumulus convection occurs associated with dynamical ascent, convection in turn moistens the troposphere above 750 hPa through diabatic ascent. Both dynamical and diabatic effects may promote conditions favorable for heavy rainfall. This is also consistent with Nie and Fan (2019)'s study on extreme rainfall events in the dynamical forcing–diabatic feedback perspective.
Yokoyama et al. (2017) showed that in the baiu season, the subtropical jet has an effect on moistening of the mid-troposphere owing to dynamically forced ascent to the south of the subtropical jet, especially around the jet entrance, producing environments favorable for the organization of rainfall. In the heavy rainfall event in July 2018, the subtropical jet accelerated on the front of the upper-tropospheric trough (Fig. 10). Thus, the large-scale conditions related to the heavy rainfall event were consistent with their statistical results. Thermodynamical profiles related to the heavy rainfall event were also consistent with those for extreme rainfall events identified by Hamada and Takayabu (2018). In this study, we could show an actual case, which corresponds to these statistical studies. Moreover, we could estimate dynamically forced ascent and diabatically generated ascent to quantify their contributions to the moistening of the troposphere.
While the patterns of large-scale environments in the heavy rainfall event in July 2018 were similar to those in the statistical studies, it is remarkable that the amplitude was very large. Particularly, in terms of humidity, the large-scale environmental conditions that resulted in the heavy rainfall event were listed in the high end of those for extreme rainfall events identified by Hamada and Takayabu (2018). In the heavy rainfall event in July 2018, the effects of the upper-tropospheric trough on moistening the mid-troposphere, in combination with other factors, such as anomalous horizontal moisture flux (Tsuguti et al. 2019; Shimpo et al. 2019) and evaporation (Sekizawa et al. 2019), could produce the extremely moist environments to cause the extensive heavy rainfall. In addition, the lingering upper-tropospheric trough, which maintained very moist conditions, is related to the Silk Road teleconnection pattern (Enomoto et al. 2003; Enomoto 2004).
Figure 16 schematically summarizes our findings for the heavy rainfall event. Sufficient convective instability in the lower troposphere will initiate cumulus convection (Part 1; top-right panel of Fig. 16). Dynamically forced ascent associated with an upper-tropospheric trough, as well as southerly/southwesterly moisture flux, produces ample moisture in the mid- to lower troposphere, which is favorable for the development of deep cumulus convection and its organization (Part 2; bottom-left panel of Fig. 16). Dynamically forced ascent also moistens the upper troposphere. In addition, low-level horizontal moisture convergence may produce convective instability. Once deep cumulus convection occurs, convection itself can moisten the troposphere above 750 hPa through diabatically generated ascent (Part 3; bottom-right panel of Fig. 16). This synergy between dynamical effects and diabatic effects promotes conditions favorable for the organization of rainfall (top-left panel of Fig. 16).

Note that although lower-tropospheric convective instability is statistically shown to be important for the initiation of congestus, it is not necessarily true for this event. The lower troposphere is convectively unstable over western Japan (Fig. 6b; the total field of equivalent potential temperature), whereas the stratification in the lower troposphere is somewhat convectively stable at Wajima and Fukuoka (not shown). In this study, large-scale environments are not for the time just before rainfall occurs, and thus, environments may partly be affected by rainfall. Further studies are needed for stricter discussion.
In conclusion, dynamically forced ascent associated with an upper-tropospheric trough played a key role in the generation of the extensive and persistent heavy rainfall of the heavy rainfall event. In a companion paper (Tsuji et al. 2020, manuscript in revision), we compare the heavy rainfall event in July 2018 over Japan with the 2017 Northern Kyushu rainfall event to discuss differences in the roles of upper tropospheric troughs between the two events.