Abstract
This study examined the roles of wind-evaporation feedback in the tropical cyclone (TC) intensification, with special attention devoted to the feedback in weak wind areas (domains where the 10-m wind speed is smaller than 5, 10, and 15 m s−1). This was done by setting lower limits of the 10-m wind speed in the calculation from the underlying ocean in a nonhydrostatic cloud-resolving model. As a result, the surface evaporation is enhanced in outer regions of a TC where the actual wind speed is smaller than the prescribed lower limit(s). Results show that increasing the lower limit reduces the radial water vapor contrast in the lower troposphere (below 100 m) and suppresses the TC size and intensity at the mature stage by 30–33 % and 5–14 %, respectively, compared to the control run with all standard model settings. The increased evaporation enhances the outer convective activity and reduces the radial pressure gradient in the lower troposphere. As a result, the inflow and the inward advection of angular momentum are reduced and the enhanced convection in the outer region suppresses eyewall updraft and thus reduces the secondary circulation and finally the TC intensity. Moreover, the outer region convection suppresses the rainband activity, within a radius of 300 km from the TC center. The contribution of the wind-evaporation feedback to the enhancement of the radial contrast of water vapor in the lower troposphere is a fundamentally important element for TC intensification, suggesting that the understanding of TC development process can be improved by elucidating the role of the weak wind area.
1. Introduction
A main energy source for tropical cyclones (TCs) is latent heat release by condensation of water vapor from the underlying ocean. There are two well-known TC intensification theories. The first is the conditional instability of the second kind (CISK) theory (Charney and Eliassen 1964; Ooyama 1969, 1982). Low-level frictional forcing induces inflow, which transports warm moist air inward toward the TC center. The air mass convergence lifts the warm-moist air to the level of free convection and thereby initiates deep cumulus convection. Many authors have confirmed the sensitivity to the surface exchange coefficient for momentum (e.g., Montgomery et al. 2010; Coronel et al. 2016). The second is the wind-induced surface heat exchange (WISHE) mechanism proposed by Emanuel (1986); this is based on a positive feedback between surface evaporation and surface wind. The surface wind activates evaporation from the underlying ocean. The evaporated water from the ocean induces convection in the eyewall, which intensifies the TC. Based on the WISHE mechanism, Emanuel (1986) obtained the mature TC intensity, namely, the TC maximum potential intensity. In the developing stage, because the intensified wind evaporates more water from the ocean, some studies have specifically examined the effect of introducing an upper limit to the surface entropy (sensible and latent heat) flux on the TC intensity: Montgomery et al. (2009, 2015) reported that the effect of a capped flux is rather slight on the TC intensity and thus they questioned about WISHE as a major process of TC intensification. By contrast, results of recent studies have demonstrated that the capped exchange coefficient reduces evaporation and suppresses deep convection in the eyewall, suggesting that the results support the importance of WISHE in feedback to TC intensification (Zhang and Emanuel 2016; Chavas 2017). As a result, an open question remains about the effects of the wind-evaporation feedback on the TC intensity.
Some studies have examined the role of surface flux or convection in the outer region on the TC intensity and structure (e.g., Bister and Emanuel 1997; Bister 2001; Xu and Wang 2010; Miyamoto and Takemi 2010; Sun et al. 2013; Lee and Chen 2014; Sun et al. 2014; Lin et al. 2015; Rai et al. 2016; Kowaleski and Evans 2016). Bister and Emanuel (1997) and Bister (2001) demonstrated that the surface flux in the outer region of a TC delays the timing of rapid intensification by around 14 hr. Sun et al. (2014) showed that when the sea surface temperature is increased in the outer (inner) region, the intensity decreases (increases). Xu and Wang (2010) studied the sensitivity of TC intensity to the radial distribution of surface entropy flux. They showed that the entropy flux outside of 60 km from the TC center had a negative effect on TC intensity. Lee and Chen (2014) described that when the outer convection is active, the inflow in the lower troposphere is blocked by the outer convection, which reduces the angular momentum transport. They confirmed that evaporation in the outer region of a TC reduces the TC intensity. Nevertheless, these studies did not specifically examine the wind-evaporation feedback in the outer region.
We study the role of the wind-evaporation feedback in the TC intensification by modifying the wind-dependent surface enthalpy exchange coefficient. As described above, many authors have examined the effects of surface enthalpy flux. Here, we then introduce the lower limit to the surface wind speed in the weak wind area. We expect that this reduces the wind dependence of surface evaporation and enhances water vapor content in the outer region. For this reason, to do so probably weakens the radial gradient of water vapor. As a result, the lower limit helps us to consider the importance of the wind-evaporation feedback in the outer region to TC intensification.
2. Method
We used a nonhydrostatic model (NHM) developed by the Japan Meteorological Agency (Saito et al. 2006). The computational domain covered 2000 km × 2000 km with the open lateral boundary condition. The horizontal grid spacing was set as 2 km. The 51 stretching vertical layers extended from 20 m to 26.52 km height. The sponge layers were placed at over 17.22 km height to suppress wave reflection at the top of the model. The domain was on an f-plane at 15°N without topography. The sea surface temperature was fixed at 302 K. The time step was 10 s. We used hourly output data for the analysis from each simulation.
The sea surface roughness was estimated using an empirical formula reported by Kondo (1975). The model cloud microphysics was an explicit three-ice bulk microphysics scheme based on the Lin scheme (Lin et al. 1983; Saito et al. 2006). The boundary layer scheme used here was reported by Klemp and Wilhelmson (1978) and Deardorff (1980) with the nonlocal effect (Sun and Chang 1986). No convective parameterization was used. The turbulent surface fluxes of the momentum, heat, and water vapor were calculated using the bulk formulae. The bulk coefficients for the momentum flux were calculated following Kondo (1975) but were fixed at 1.2 × 10⁻³ for other fluxes.
We replaced the bulk formula of the water vapor flux in NHM as
where
C = 1.2 × 10
−3,
qv stands for the water vapor mixing ratio, and subscripts
a and
s represent the values at the lowest atmospheric model layer and surface, respectively. In addition,
V′ is
where
Va stands for the model calculated wind speed at the lowest atmospheric model level and
Vq denotes an imposed minimum wind speed for surface evaporation calculation. Under those conditions,
CV′, the surface water vapor flux, is controlled largely by the value of
V′ (Fig. S1). Four parameters were used, namely,
Vq = 0, 5, 10, and 15 m s
−1, which are designated as control (CTL), Vq05, Vq10, and Vq15, respectively (Fig. S1). Although the surface water vapor flux in the eye is also changed under the present experimental design, we infer that the impact from the eye can be negligible because the surface entropy flux has a minor positive role for the mature TC intensity (
Bryan and Rotunno 2009a).
The initial dynamic and thermodynamic conditions were given as described below. First, we calculated the environmental relative humidity (RH) and potential temperature by averaging ERA-Interim (Dee et al. 2011) data over the western North Pacific (130–170°E, 5–25°N) in August during 2011–2015 for an initial condition. Second, an idealized surface vortex was reported by Kurihara and Tuleya (1974) as
where
r represents the radius from the TC center,
V0 = 15 m s
−1, and
r0 = 120 km. The tangential wind speed was set linearly decreasing in the vertical direction to 0 m s
−1 at 15 km height. Finally, the temperature was adapted to the vortex following the thermal wind balance (
Smith 2006).
3. Results
Time evolutions of the maximum surface wind speed, minimum pressure, kinetic energy, and wind speed radius at 17 m s−1 for each simulation are presented in Fig. 1. In CTL, the maximum wind speed increases rapidly during 30–60 hr. It gradually increases thereafter. With increasing Vq, the timing of rapid intensification is delayed compared to CTL. The wind speed in the mature stage (T = 150 hr) is weaker for larger Vq. Values of the maximum surface wind speed at 150 hr are 44.8 m s−1 in CTL, 42.5 m s−1 in Vq05, 40.3 m s−1 in Vq10, and 38.4 m s−1 in Vq15. These results imply that the TC did not intensify due to the enhanced evaporation in the outer region. The area (within a 300 km radius) averaged kinetic energy clearly differs depending on the lower limit. In CTL, the kinetic energy gradually increases for more than 150 hr. However, when the lower limit is introduced, the area-averaged kinetic energy reaches a steady state, with times of 60 hr for Vq05, 75 hr for Vq10, and 80 hr for Vq15. The radius of 17 m s−1 tangential wind at 420 m height also continuously increases for a long period of integration in CTL but reaches a steady state in cases with lower limits.

We show the time evolutions of azimuthally averaged precipitation (Fig. 2). Here, we regard the rainband as the precipitation system within a 300 km radius from the TC center. Eyewall convection occurs near a 24 km radius from the TC center as outwardly propagating rainband after 60 hr in CTL. The radius of 5 m s−1 tangential wind at 10 m height increases gradually with time. The Vq experiments (Vq05, Vq10, and Vq15) show that precipitation widely spreads in the outer region of the simulated TC. That wide distribution might reflect enhanced evaporation from the sea surface because of the lower limit of the surface water vapor flux. Nevertheless, the rainband is not readily visible. Furthermore, the strong wind radius is in a steady state depending on the lower limit. The eyewall precipitation is smaller in Vq10 and Vq15 than that in CTL. These results suggest that the eyewall more slowly develops under the influence of enhanced evaporation in the outer region.
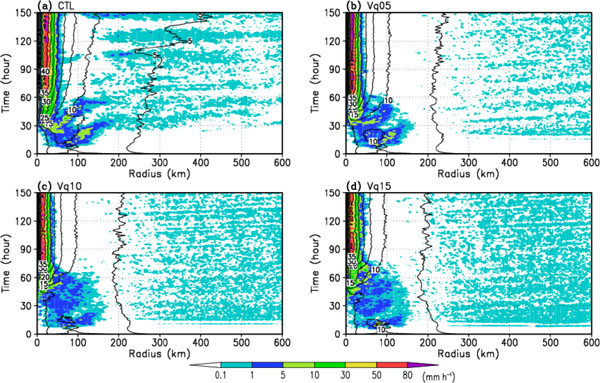
Figure 3 shows the radial, vertical, and tangential wind structure in the mature stage (T = 90–150 hr). In CTL, the inflow develops in the lower troposphere. The outflow has a peak value stronger than 16.0 m s−1 at around 13 km height. The vertical wind peak is located at around 25 km distance from the TC center, which corresponds well to the eyewall convection. By contrast, increasing Vq makes the inflow shallower and the outflow weaker than those in CTL. The tangential wind structure becomes weaker along with increasing Vq. It is consistent with the kinetic energy change (Fig. 1c).

We present the temperature anomaly (difference from average over all domains) in the inner core using the difference between the inner core temperature and the area-averaged temperature (Fig. 4). The warm core temperature is high in CTL (+11°C) at 8–12 km height. The warm core becomes smaller and weaker with increasing Vq, which is consistent with the fact that the outflow in the upper troposphere is weaker than that in CTL. The peak position of the temperature anomaly gradually becomes higher up to around 11–12 km with increasing the lower limit from Vq05 to Vq15. The result shows that the cloud top height becomes taller in larger Vq experiment.

Figure 5 shows the equivalent potential temperature (EPT) averaged over the height of 0–100 m. In the outer region, distant from the TC center, EPT significantly and concomitantly increases with the increase of the lower limit of the surface water vapor flux. In this region, the lower limit might strongly affect EPT in the lower troposphere. Only CTL has a negative radial gradient of near-surface EPT from the eyewall to the outer region of the TC. Actually, WISHE might explain the radial gradient of EPT. In CTL, the surface water vapor flux concomitantly decreases with increasing distance from the TC center as the wind speed decreases. In the case of Vq05, however, the surface water vapor flux loses wind speed dependence outside of 200 km from the TC center. Then this change suppresses the radial gradient of EPT.

Secondary circulation, which is necessary for the TC development, can be diagnosed using the mass streamfunction (Schubert and Hack 1983; Sawada and Iwasaki 2007, 2010), which is defined as
where the overbar denotes an azimuthally averaged value and where
ρ, vr, and
z represent the density, radial wind speed, and height, respectively.
Figure 6 shows the mass streamfunction and RH. In the developing stage (
T = 30–60 hr) in CTL, two positive circulations exist in the lower and middle troposphere. A high RH region exists within 30 km from the TC center in the middle troposphere. In the mature stage, the mass streamfunction has a large value (around 4.0 × 10
8 kg s
−1) within a 600 km radius from the TC center. It is more concentrated in the lower troposphere, indicating strong inflow near the surface. In cases with lower limits
Vq, the secondary circulation becomes weaker; moreover, outer region convection causes a negative (backward) circulation in about 600 km radius from the TC center in the mature stage. It corresponds to weak inflow in the lower troposphere. The descending motion causes a low RH region at about 8 km height in both developing and mature stages.
4. Discussion
Results of sensitivity experiments demonstrate that introduction of the lower limit to the surface wind speed in the outer region of a TC strongly affects the TC intensity and structure. The results are not intuitive. This section includes in-depth discussion of the change in intensity and size associated with enhanced evaporation in the outer region of the simulated TC.
4.1 TC Intensity
Figure 1a suggests that enhanced evaporation in the outer region of the TC suppresses intensity. According to the CISK theory (Charney and Eliassen 1964; Ooyama 1969, 1982), cumulus ensembles organized by frictional convergence near the surface release much latent heat energy of moisture and convert that energy into kinetic energy. In this sense, the water vapor content can be regarded as a fuel. However, as depicted in Fig. 6, convergence in the low-level inflow layer (see Fig. 3) becomes weak with increasing Vq in both stages: in CTL, the value of the mass stream-function was greater than 2.0 × 10⁸ kg s−1 within a 600 km radius from the TC center; in contrast, in the Vq experiments, it was half of that in CTL or less. Results show that the TC intensity in CTL was markedly higher than that in the Vq experiments, although sea surface evaporation was suppressed in the outer region of the TC because of weak surface winds. Therefore, the distribution of sea surface evaporation is important for TC intensification (Miyamoto and Takemi 2010; Xu and Wang 2010). Bryan and Rottuno (2009b) also showed the importance of the local radial gradient of EPT at the radius of the maximum wind for TC intensity. Compared to the results of Xu and Wang's (2010) experiments (OE60, OE75, OE90, and OE120), the surface water vapor flux are altered, at least outside of 200 km from the TC center in Vq05, 100 km in Vq10, and 70 km in Vq15 in the mature stage (Fig. 2). It is noteworthy that the surface exchange in the eye is also altered, but as mentioned earlier, the effect can be negligible. From the results of the present study, we infer that EPT outside of 200 km from the TC center can affect the TC development. As a result, the gradient of EPT between the eyewall and outside of TC is apparently more favorable than the water vapor content for the TC intensification. In fact, Figs. 1 and 5 show that the TC intensity is clearly suppressed along with the decreasing radial contrast. The conventional wind-evaporation feedback, WISHE, is constructed for the inner core region based on the positive feedback that the more water vapor content is induced by strong winds, the more TCs intensify. In this sense, the WISHE framework can be coexistent with the CISK framework. In the outer region of a TC, in contrast, the present sensitivity experiments suggest that different feedback intensifies TC. This feedback consists of the process in which the weaker winds induce less water vapor (evaporation) from the underlying ocean.
The lower limit of evaporation in the weak wind area not only suppresses the TC intensity but also delays the timing of rapid intensification. Bister and Emanuel (1997) and Bister (2001) reported that the timing of intensification is delayed if the sea surface evaporation is allowed everywhere. Results suggest that the enhanced evaporation increases the lower tropospheric water vapor and that it activates cumulus convections in the outer region. That convection reduces the radial atmospheric pressure gradient in the whole troposphere and reduces the inward gradient in the lower troposphere. It is apparently unfavorable for the organization of secondary circulation of a TC. The radial water vapor contrast plays an important role in TC intensification.
Figure 3 portrays another interesting feature of the higher outflow layer and the warm core center in the larger Vq experiment. The high total EPT in the lower troposphere in the Vq experiments (Fig. 5) altered the environmental thermodynamic stability. Under the altered condition, the moist air in the eyewall might be lifted up to the higher convective neutrality level. The scenario is similar to the increase of the TC cloud top height estimated from the global warming experiment (Yamada et al. 2010).
A phase change associated with a continuous increase of domain-integrated kinetic energy between CTL and Vq05 is apparent. In CTL, the kinetic energy grows throughout the simulation, but in Vq05, it reaches a steady state. To find the threshold, two additional experiments (Vq01 and Vq03) were conducted (Fig. S2). The results demonstrate that the intensity change in Vq01 (Vq03) is similar to that in CTL (Vq05), which suggests that a threshold exists between Vq01 and Vq03. The reason for the threshold remains unknown.
4.2 TC Size
The TC size is also important information, suggesting a disastrous area of strong winds and heavy precipitation. Furthermore, the size sometimes strongly affects the TC tracks (e.g., Iwasaki et al. 1987). The size grows with time in CTL but approaches their steady states in Vq experiments, which suggests that sea surface evaporation in the outer region of TC suppresses the size (Figs. 1b, c). Rainbands also influence the TC size (Hill and Lackmann 2009; Wang 2009; Sawada and Iwasaki 2010; Xu and Wang 2010). Hill and Lackmann (2009) demonstrated that the environmental RH affects the TC size through the activity of rainbands. Sawada and Iwasaki (2010) revealed that evaporation from rain drops forms rainbands and increases the TC size. Fudeyasu and Wang (2011) explained that diabatic heating in the middle–upper troposphere drives secondary circulation and forms inflow in the middle troposphere. The inflow transports the angular momentum into the outer core region and thereby develops the size. In fact, the inflow in the middle troposphere clearly forms in CTL (Fig. 6). The Vq experiments suggest that the dry air flows into the outer core (100–200 km radius) in the middle-upper troposphere because the dry air path is formed by the backward circulation as a result of outer region convection. The backward circulation impedes the inflow layer development and bends the secondary circulation. As a result, it suppresses the TC size.
5. Conclusions
We investigated the wind-evaporation feedback in the TC intensification by modification of the surface water vapor flux in the outer region of a TC in idealized cloud-resolving numerical experiments. A lower limit of the surface wind speed was introduced to switch off the wind-evaporation feedback in the outer region of the TC. The lower limit increases the water vapor content but reduces its radial gradient. The change attributable to the lower limit might be favorable for CISK based on moist unstable stratification. However, when increasing the lower limit of the surface wind speed, the TC intensification is slower and the final TC intensity becomes weaker; the TC size becomes smaller. The convection attributable to enhanced surface evaporation in the outer region suppresses the development of secondary circulation. The narrower secondary circulation inefficiently transports water vapor and angular momentum to the TC core. The lower limit of surface wind speed also suppresses the rainband activity and then reduces the TC size. Results suggest that the radial gradient of water vapor content strongly controls the TC structure and intensity change. The implication explained above is consistent with results of earlier works showing that deep cumulus convections in the outer region adversely affect the TC intensity (e.g., Bister and Emanuel 1997; Bister 2001; Miyamoto and Takemi 2010; Lee and Chen 2014; Sun et al. 2014; Lin et al. 2015; Rai et al. 2016). Unlike these studies, the process suggested herein is that the weaker winds induce the less water vapor (evaporation) from the underlying ocean. This feedback in the outer region of a TC conflicts with the CISK framework and differs from the WISHE framework. Here, we emphasize that suppression of sea surface evaporation attributable to weak surface winds is another important aspect of the wind-evaporation feedback, which enlarges the radial gradient of water vapor content in the boundary layer. Therefore, this is a potential mechanism as a new kind of the wind-evaporation feedback. In the TC forecasts, particular attention should be devoted to moisture exchange in the outer region of a TC. Further study should also be undertaken to elucidate wind-evaporation feedback in a realistic case.
Supplements
Figure S1 displays the surface water vapor exchange coefficient to wind speed in each simulation. Figure S2 shows a time series of minimum pressure and the area-averaged kinetic energy in additional experiments.
Figure S1: Values of the surface water vapor exchange coefficient under the value of Vq. Four lines show CTL (solid), Vq05 (broken), Vq10 (dotted), and Vq15 (chain).
Figure S2: Temporal variations in maximum surface wind speed (a) and area-averaged kinetic energy within a 300 km radius from the TC center (b). Results are derived from CTL (solid line), Vq01 (broken line), and Vq03 (dotted line). The horizontal axis shows the TC development from the initial state.
Acknowledgments
We thank the Japan Meteorological Agency for permitting our use of NHM. The experiments were performed using supercomputing resources at the Cyberscience Center, Tohoku University. Our sincere appreciation is extended to Dr. Kosuke Ito for valuable discussions related to CISK vs. WISHE, and to two anonymous reviewers for their constructive comments. This work was supported by activity of the Core Research Cluster of Disaster Science in Tohoku University.
References
- Bister, M., 2001: Effect of peripheral convection on tropical cyclone formation. J. Atmos. Sci., 58, 3463-3476.
- Bister, M., and K. A. Emanuel, 1997: The genesis of Hurricane Guillermo: TEXMEX analysis and a modeling study. Mon. Wea. Rev., 125, 2662-2682.
- Bryan, G. H., and R. Rotunno, 2009a: The influence of near-surface, high-entropy air in hurricane eyes on maximum hurricane intensity. J. Atmos. Sci., 66, 148-158.
- Bryan, G. H., and R. Rotunno, 2009b: The maximum intensity of tropical cyclones in axisymmetric numerical model simulations. Mon. Wea. Rev., 137, 1770-1789.
- Charney, J. G., and A. Eliassen, 1964: On the growth of the hurricane depression. J. Atmos. Sci., 21, 68-75.
- Chavas, D. R., 2017: A simple derivation of tropical cyclone ventilation theory and its application to capped surface entropy fluxes. J. Atmos. Sci., 74, 2989-2996.
- Coronel, R., M. Sawada, and T. Iwasaki, 2016: Impacts of surface drag coefficient and planetary boundary layer schemes on the structure and energetics of Typhoon Megi (2010) during intensification. J. Meteor. Soc. Japan, 94, 55-73.
- Deardorff, J. W., 1980: Stratocumulus-capped mixed layers derived from a three-dimensional model. Bound.- Layer Meteor., 18, 495-527.
- Dee, D. P., S. M. Uppala, A. J. Simmons, P. Berrisford, P. Poli, S. Kobayashi, U. Andrae, M. A. Balmaseda, G. Balsamo, P. Bauer, P. Bechtold, A. C. M. Beljaars, L. van de Berg, J. Bidlot, N. Bormann, C. Delsol, R. Dragani, M. Fuentes, A. J. Geer, L. Haimberger, S. B. Healy, H. Hersbach, E. V. Hólm, L. Isaksen, P. Kållberg, M. Köhler, M. Matricardi, A. P. McNally, B. M. Monge-Sanz, J.-J. Morcrette, B.-K. Park, C. Peubey, P. de Rosnay, C. Tavolato, J.-N. Thépaut, and F. Vitart, 2011: The ERA-Interim reanalysis: Configuration and performance of the data assimilation system. Quart. J. Roy. Meteor. Soc., 137, 553-597.
- Emanuel, K. A., 1986: An air-sea interaction theory for tropical cyclones. Part I: Steady-state maintenance. J. Atmos. Sci., 43, 585-604.
- Fudeyasu, H., and Y. Wang, 2011: Balanced contribution to the intensification of a tropical cyclone simulated in TCM4: Outer-core spinup process. J. Atmos. Sci., 68, 430-449.
- Hill, K. A., and G. M. Lackmann, 2009: Influence of environmental humidity on tropical cyclone size. Mon. Wea. Rev., 137, 3294-3315.
- Iwasaki, T., H. Nakano, and M. Sugi, 1987: The performance of a typhoon track prediction model with cumulus parameterization. J. Meteor. Soc. Japan, 65, 555-570.
- Klemp, J. B., and R. B. Wilhelmson, 1978: The simulation of three-dimensional convective storm dynamics. J. Atmos. Sci., 35, 1070-1096.
- Kondo, J., 1975: Air-sea bulk transfer coefficients in diabatic conditions. Bound.-Layer Meteor., 9, 91-112.
- Kowaleski, A. M., and J. L. Evans, 2016: A reformulation of tropical cyclone potential intensity theory incorporating energy production along a radial trajectory. Mon. Wea. Rev., 144, 3569-3578.
- Kurihara, Y., and R. E. Tuleya, 1974: Structure of a tropical cyclone developed in a three-dimensional numerical simulation model. J. Atmos. Sci., 31, 893-919.
- Lee, C.-Y., and S. S. Chen, 2014: Stable boundary layer and its impact on tropical cyclone structure in a coupled atmosphere-ocean model. Mon. Wea. Rev., 142, 1927-1944.
- Lin, Y., M. Zhao, and M. Zhang, 2015: Tropical cyclone rainfall area controlled by relative sea surface temperature. Nat. Commun., 6, 6591, doi:10.1038/ncomms7591.
- Lin, Y-L., R. D. Farley, and H. D. Orville, 1983: Bulk parameterization of the snow field in a cloud model. J. Climate Appl. Meteor., 22, 1065-1092.
- Miyamoto, Y., and T. Takemi, 2010: An effective radius of the sea surface enthalpy flux for the maintenance of a tropical cyclone. Atmos. Sci. Lett., 11, 278-282.
- Montgomery, M. T., N. V. Sang, R. K. Smith, and J. Persing, 2009: Do tropical cyclones intensify by WISHE? Quart. J. Roy. Meteor. Soc., 135, 1697-1714.
- Montgomery, M. T., R. K. Smith, and S. V. Nguyen, 2010: Sensitivity of tropical-cyclone models to the surface drag coefficient. Quart. J. Roy. Meteor. Soc., 136, 1945-1953.
- Montgomery, M. T., J. Persing, and R. K. Smith, 2015: Putting to rest WISHE-ful misconceptions for tropical cyclone intensification. J. Adv. Model. Earth Syst., 7, 92-109.
- Ooyama, K. V., 1969: Numerical simulation of the life cycle of tropical cyclones. J. Atmos. Sci., 26, 3-40.
- Ooyama, K. V., 1982: Conceptual evolution of the theory and modeling of the tropical cyclone. J. Meteor. Soc. Japan, 60, 369-379.
- Rai, D., S. Pattnaik, and P. V. Rajesh, 2016: Sensitivity of tropical cyclone characteristics to the radial distribution of sea surface temperature. J. Earth Syst. Sci., 125, 691-708.
- Saito, K., T. Fujita, Y. Yamada, J. Ishida, Y. Kumagai, K. Aranami, S. Ohmori, R. Nagasawa, S. Kumagai, C. Muroi, T. Kato, H. Eito, and Y. Yamazaki, 2006: The operational JMA nonhydrostatic mesoscale model. Mon. Wea. Rev., 134, 1266-1298.
- Sawada, M., and T. Iwasaki, 2007: Impacts of ice phase processes on tropical cyclone development. J. Meteor. Soc. Japan, 85, 479-494.
- Sawada, M., and T. Iwasaki, 2010: Impacts of evaporation from raindrops on tropical cyclones. Part I: Evolution and axisymmetric structure. J. Atmos. Sci., 67, 71-83.
- Schubert, W. H., and J. J. Hack, 1983: Transformed Eliassen balanced vortex model. J. Atmos. Sci., 40, 1571-1583.
- Smith, R. K., 2006: Accurate determination of a balanced axisymmetric vortex in a compressible atmosphere. Tellus A, 58, 98-103.
- Sun, W.-Y., and C.-Z. Chang, 1986: Diffusion model for a convective layer. Part I: Numerical simulation of convective boundary layer. J. Climate Appl. Meteor., 25, 1445-1453.
- Sun, Y., Z. Zhong, Y. Ha, Y. Wang, and X. Wang, 2013: The dynamic and thermodynamic effects of relative and absolute sea surface temperature on tropical cyclone intensity. Acta Meteor. Sin., 27, 40-49.
- Sun, Y., Z. Zhong, L. Yi, Y. Ha, and Y. Sun, 2014: The opposite effects of inner and outer sea surface temperature on tropical cyclone intensity. J. Geophys. Res., 119, 2193-2208.
- Wang, Y., 2009: How do outer spiral rainbands affect tropical cyclone structure and intensity? J. Atmos. Sci., 66, 1250-1273.
- Xu, J., and Y. Wang, 2010: Sensitivity of tropical cyclone inner-core size and intensity to the radial distribution of surface entropy flux. J. Atmos. Sci., 67, 1831-1852.
- Yamada, Y., K. Oouchi, M. Satoh, H. Tomita, and W. Yanase, 2010: Projection of changes in tropical cyclone activity and cloud height due to greenhouse warming: Global cloud-system-resolving approach. Geophys. Res. Lett., 37, L07709, doi:10.1029/2010GL042518.
- Zhang, F., and K. Emanuel, 2016: On the role of surface fluxes and WISHE in tropical cyclone intensification. J. Atmos. Sci., 73, 2011-2019.


