Abstract
Based on observations, the number of tropical cyclones (TCs) approaching the southern coast of Japan, including Tokyo, has increased over the last 40 years, and these TCs are increasing in strength when they approach land. The environmental conditions for TC development have become more favorable, with warmer sea surface temperature, less vertical wind shear, and more moisture in the atmosphere. In addition, the translation speed of TCs has decreased, which indicates a longer influence time. Comparison of the synoptic environment during July–October between the first (1980–1999, P1) and second (2000–2019, P2) 20 years shows that the sub-tropical high is strengthened in P2, where the western and northern edge of the high extends further into the west and north, respectively. Also, the westerly jet is weakened in P2 over and south of Japan in the middle-to-upper troposphere. These changes in the synoptic environment are considered to play a role in the increase in the number of TCs approaching Tokyo and also in the creation of more favorable conditions for TC development. The relationship between the changes in TC characteristics over the last 40 years and global warming is unclear. As the Pacific Decadal Oscillation is in a positive phase in P1 and in a negative phase in many years of P2, decadal oscillations may have played some role in the increase in the number of approaching TCs and in the changes in the synoptic environment.
1. Introduction
Tropical cyclones (TCs) are one of the most intense weather systems in the world; they can cause great losses of life and property and have large social and economic impacts. When TCs make landfall or approach urban areas, the damage and impacts can be enormous. Typhoon Hagibis over Tokyo and its surrounding areas in 2019 (Normile 2019) and Hurricane Sandy over New York in 2012 (Blake et al. 2013) are typical examples of such TCs that have caused devastating damage over high-density population areas. Given that more than half of the world's population lives in urban areas and that two-thirds of the global population will live in such areas by 2050 (United Nations 2019), it is of great importance to understand whether there exists any change in the number of TCs affecting large cities in recent years.
The western North Pacific (WNP) basin is the most favorable area for TC genesis in the world, and approximately 30 % of the world's TCs occur in this basin, although there is large year-to-year variability (Gray 1968). Japan is one of the countries in this region that is most affected by TCs or typhoons. According to the Japan Meteorological Agency (JMA 2019), an average of 25.6 typhoons (TCs reaching tropical storm intensity or stronger) are generated in the WNP basin in a year based on statistics from 1981 to 2010. Among these TCs, 2.7 and 11.4 typhoons on average make landfall and approach Japan in a year, respectively. When a typhoon makes landfall or approaches a region of Japan, the typhoon is counted as a landfalling or approaching typhoon.
When considering disaster prevention and mitigation in a certain location, however, the number of TCs that affect that location is important. In other words, whether the number of TCs affecting a given location has increased with time is essential for decision makers and disaster-risk-mitigation communities. The number of landfalling or approaching TCs in Japan alone cannot answer such a question. Furthermore, it is possible that recent TCs have followed paths that affect various areas of Japan with no or little change in the number of landfalling or approaching TCs in a historical period. Thus, it is necessary to assess whether there is any change in the influence of TCs with time at a given location.
Tokyo is one of the largest cities in the world. According to the United Nations (2019), Tokyo is ranked as the largest mega-city in the world, with a population of more than 37 million in the city and its surrounding areas. Typhoons Faxai (T1915) and Hagibis (T1919) hit Tokyo and its surrounding areas sequentially in 2019, causing catastrophic damage and having tremendous impacts, including the collapse of river dikes in many cities, power and water outages for several weeks, and issues with the transportation system in the metropolitan region. As will be shown in Section 3, there were three TCs per year within 300 km of Tokyo during the last five years (2015 to 2019) on average. These recent TC events in and around Tokyo raise questions as to whether the number of TCs affecting Tokyo has recently increased and whether they approach Tokyo in stronger states than before.
This study investigates whether TCs approaching Tokyo have changed since 1980 in terms of number and environmental conditions. The environmental conditions include the sea surface temperature (SST), vertical wind shear (VWS), and relative humidity at 500 hPa (RH500), which are associated with TC development (e.g., Kepert 2010; Shay 2010). In addition, changes in the translation speed of TCs and the relationship with changes in the synoptic environment are investigated. As previous studies have noted, there are inhomogeneities and large quality uncertainties in the observational data of TCs (known as best-track data) during the pre-satellite era (Schreck et al. 2014; Moon et al. 2019; Lanzante 2019). For 40 years from 1980 to 2019, however, geostationary satellites have been available in the WNP basin. Thus, it is relatively unlikely that any TC would go undetected in this period, and the best-track data have almost certainly become more homogeneous and increased reliability over the last 40 years.
Here, the methods and data are described in Section 2, the results are outlined in Section 3, some discussions are described in Section 4, and the summary of this study is given in Section 5.
2. Methods and data
The number of TCs that approached Tokyo (35.65°N and 139.73°E) is counted every year over the last 40 years (1980–2019) with JMA best-track data (https://www.jma.go.jp/jma/jma-eng/jma-center/rsmc-hp-pubeg/besttrack.html). For 2019, Typhoons Pabuk (T1901) through Halong (T1923) are considered in this study. As the best-track data for Typhoons Nakri (T1924) through Phanfone (T1929) have yet to be created, those TCs are not considered in this study. The definition of the approach in this study is that the central positions of the TCs are within 300 km of Tokyo and that their latitudes are south of Tokyo. The definition of the approach operationally used in JMA is that the central positions of TCs with tropical storm intensity or stronger are within 300 km. The reason why the latitudinal restriction is adopted in this study is that we think it would be more meaningful to examine changes in the number of approaching TCs from a viewpoint of disaster risk rather than just geographical distance as the intensity of TCs is in general stronger when they are in the south of a verifying point than in the north. However, as it is important to evaluate the impact of different definitions on the results; therefore, the effects of differences in definitions are evaluated in Section 3.3. The distances between locations are calculated along a great-circle arc.
This study uses the central positions and intensities analyzed every 6 hours at 00, 06, 12, and 18 UTC from the best-track data. They are analyzed every hour or every 3 hours when they have some influence on Japan; however, these additional data are not used in this study. TCs that reached a tropical storm intensity, whose maximum sustained winds are 35 knots or more are analyzed with the JMA best-track data. When such TCs are in a tropical depression or extratropical cyclone stage, those times are also analyzed with the JMA best-track. In this study, all 6-hourly analyzed TC information, including intensity classifications of tropical depressions and extratropical cyclones, is used.
The Japanese 55-year reanalysis (JRA-55; Kobayashi et al. 2015) is used for calculating TC environmental conditions, such as SST, VWS, and RH500, and synoptic-scale atmospheric fields such as the sub-tropical high in the North Pacific at 500 hPa. The SSTs used in JRA-55 are the Centennial Observation-Based Estimates of Sea Surface Temperature (Ishii et al. 2005). The TC environmental conditions are retrieved from a model diagnostic code used in the Statistical Hurricane Intensity Prediction Scheme (SHIPS; DeMaria and Kaplan 1994; Yamaguchi et al. 2018). The VWS is the vertical wind shear between 850 hPa and 200 hPa, and the winds are averaged over 500 km from the central positions of the TCs.
The TC environmental conditions are calculated when the TCs are over the ocean to understand how the favorable conditions for the development of TCs have changed over the 40 years from 1980 to 2019. When the land coverage in a 100-km-radius circle centered over the central positions of the TCs is 5 % or less, TCs are defined as being over the ocean.
3. Results
3.1 Observational evidence
Figures 1a and 1b show all tracks of TCs that approached Tokyo in 1980–1999 and in 2000–2019, respectively. Hereafter, the first 20 years (i.e., 1980–1999) are referred to as P1, and the second 20 years (i.e., 2000–2019) are referred to as P2. An annual average of 1.55 and 2.35 TCs approached Tokyo in P1 and P2, respectively. The difference between them is statistically significant at the 95 % level. Figure 2a shows the time series of the annual number of TCs that approached Tokyo from 1980 to 2019. As the regression line shows, the number of TCs approaching Tokyo has been increasing. The increasing tread (+0.3 per decade) is statistically significant at the 95 % level. There are years when no TC approached Tokyo in P1 (i.e., 1982, 1984, 1992, 1994, and 1999), but there is at least one TC that approached Tokyo in P2, with an average of 3 TCs over the last 5 years from 2015 to 2019.


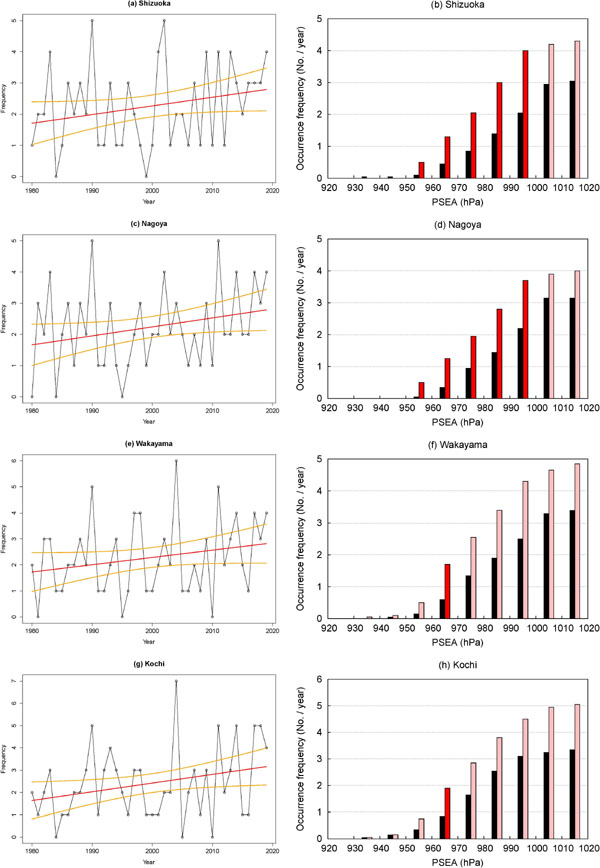
Figure 3 shows the accumulated occurrence frequency of TCs approaching Tokyo as a function of their minimum central pressures at the time of the approach. Note that the occurrence frequency does not represent the number of TCs. The occurrence frequency indicates the number of TC central positions that meet the conditions of the approach used in this study (see Methods and data for the definition of the approach). The boxes indicate the occurrence frequency accumulated from the smallest central pressure among the bins. For example, the red box between 970 hPa and 980 hPa indicates that there are 1.75 TC central points per year that meet the conditions of the approach, with their minimum central pressures less than 980 hPa in P2. The numbers of accumulated occurrence frequencies in P1 and P2 in the 1010–1020 hPa bin are 2.5 and 3.9, respectively. This implies that TCs have more than 1.5 times the chance of affecting Tokyo in P2 compared to P1. Figure 3 also shows that the frequency of strong TCs close to Tokyo increased in P2 compared to P1. For example, the frequency of Tokyo-approaching TCs with a central pressure lower than 980 hPa increased 2.5 times. These characteristics are seen not only in Tokyo but also in other large cities located in the southern coast of Japan, such as Shizuoka, Nagoya, Wakayama, and Kochi (Fig. 4).

Table 1 shows differences in the TC environmental conditions, such as SST, VWS, and RH500, and in the translation speeds of TCs between P1 and P2. The statistics are based on TCs from July to October. Note that SST, VWS, and RH500 are calculated over the ocean at each central TC position as it approached Tokyo, and the results are averaged by the number of these points in P1 and P2. The translation speed at time T is calculated with the TC central positions at T and T – 6 hours. TCs that approached Tokyo in P2 experienced more favorable environments for TC development than those in P1; warmer SSTs, weaker VWSs, and higher RH500. The differences in SST and RH500 between P1 and P2 are statistically significant at the 95 % level. The change in the translation speed of TCs is also significant; the speed in P2 is 36 % slower than that in P1. This result indicates that the duration of TC influence is longer in P2 than in P1.
3.3 Geographical characteristics
The number of approaching TCs is calculated in P1 and P2 at each grid point from 120° to 150° E and 20° to 40°N with a 0.5° interval (Figs. 5a, b). The ratio of approaching TCs, i.e., the number of TCs in P2 to the number of TCs in P1, is shown in Fig. 5c. As Fig. 5c shows, there are some geographical features in areas where the number of approaching TCs has changed. One is that the number of TCs approaching Japan, especially on its Pacific side, has increased. On the other hand, the number of approaching TCs has decreased over the sea south of Japan (around 130–150°E, 25–30°N). Another remarkable feature is an increase over the East China Sea.

Figure 6 is the same as Fig. 5c, but the definition of the approach is slightly different from the original definition at each plot. Also, only the points where the p-value of the significant test is 0.1 or less are drawn. First, the distance threshold is reduced from 300 to 200 km. Second, the latitudinal restriction, which is that the latitudes of the central positions of the verifying TCs have to be south of the latitude of a verifying point, is removed. Third, verification samples are limited to TC stages where the intensity classification is tropical storm or higher. Even after changing the definition of the approach, the increase in the number of TCs approaching Tokyo and over the East China Sea is clearly seen. Figure 6g corresponds to the result based on the JMA's operational definition of TC approach. It would be worthwhile to mention that the ratios tend to be larger in the verifications with a distance threshold of 200 km than 300 km. This means that the number of TCs getting much closer to Tokyo and its surrounding areas and over the East China Sea has been increasing. When we see the top-right corner box in each plot (around 145–150°E, 35–40°N), the significant increase in the number of approaching TCs is observed in Figs. 6a–d. What is common to those plots is that the intensity classifications of tropical depressions and extratropical cyclones are included. Thus, the increased ratios in this region can be explained by the increased number of tropical depressions and extratropical cyclones over the region, though the physical mechanisms for this need further investigation.

4. Discussion
4.1 Effects of low-frequency climate variability
The purpose of this study is to show the observational evidence that, based on best-track and reanalysis data, there have been significant changes in TC characteristics such as the number of approaching TCs and TC intensities at the time of approach over the last 40 years as shown in Results section. It is unclear whether these changes are simply caused by global warming and further investigations will be needed in the future to clarify this. In particular, it is of great importance to assess the effect of decadal oscillations. It is known that there are significant interdecadal variabilities in TC activities in the WNP basin (e.g., Chan 2016; Li and Zhou 2018), and some climate variabilities such as the Pacific Decadal Oscillation (PDO, Mantua et al. 1997) are thought to be responsible for such variabilities in the TC activities. When we look at the 40 years examined in this study, the 5-year running mean PDO index is positive in P1 except in 1999 and negative in many years during the P2 period1. Urabe and Maeda (2014) showed that the La Niña-like conditions in the negative phase of PDO during 1999–2012 modulated the general atmospheric circulation pattern near Japan, leading to the increased temperature contrast between summer/autumn and winter/spring. As Fig. 7 shows, the PDO index has positive regression coefficients with the zonal wind at 200 hPa over Japan, which means that the westerly jet becomes stronger (weaker) when the PDO index is positive (negative). This is consistent with Imada et al. (2017), which showed that the wind speed at 200 hPa is reduced in a negative phase of the Interdecadal Pacific Oscillation (Power et al. 1999). These results indicate that the decadal oscillation may have played some role in the decrease in the westerly jet and other changes in the synoptic environment seen in the Results section. Thus, future research is needed to quantitatively evaluate the contribution of global warming and decadal oscillations using numerical simulation results such as Database for Policy Decision-Making for Future Climate Change (Mizuta et al. 2017; Yoshida et al. 2017).

In addition, it should be noted that we cannot see an increasing trend in the number of TCs approaching Tokyo at a statistically significant level when the trend analysis is conducted for the data including the pre-satellite era (e.g., 1951–2019; Fig. 2b). JMA keeps statistics on the TC genesis number in the WNP basin and the number of TCs approaching Japan since 1951 (Japan Meteorological Agency 2019). TCs are relatively active in the basin in the 1960s, where the TC genesis number and the number of TCs approaching Japan are relatively large (Figs. 2.4-1 and 2.4-2 of Japan Meteorological Agency 2019). The SST and VWS in the southeast area of the WNP basin provide more favorable conditions for TC genesis in the El Niño-like years, including the 1960s, which results in more TC genesis events than normal (Yumoto and Matsuura 2001; Matsuura et al. 2003; Liu and Chan 2008; Liu et al. 2019). Thus, a long-term trend analysis and its relationship with global warming and decadal oscillations can also be important topics for a future study.
4.2 Changes in the synoptic environment
Here, we infer the reasons for the increase in the number of approaching TCs shown in the Results section through analyzing the difference in the synoptic environment between P1 and P2. Figure 8a shows the sub-tropical high with the 5880-m geopotential height lines averaged over July-October at 500 hPa in P1 and P2, and changes in the averaged wind speeds at 500 hPa (P2–P1). Note that the areas where the geopotential height at 500 hPa is 5880 m or larger are often regarded as an indicator of the range of the sub-tropical high (Fujikawa 2013). As Fig 8a shows, the sub-tropical high is strengthened in P2 compared to P1, where the western and northern edge of the high extends further into the west and the north, respectively. It also shows a decrease in the wind speeds, or weakening of the westerly jet, over and south of Japan. A similar wind speed reduction is also seen at the upper troposphere (200 hPa; Fig. 8b).

It is indicated in Fig. 5c that the locations where the number of approaching TCs has increased are not random. It can be seen from Figs. 5c and 8a that the number of approaching TCs has increased in line with the strengthened sub-tropical high. The increase in the number of approaching TCs over the East China Sea is consistent with the westward extension of the sub-tropical high while the increase in the number of approaching TCs over the Pacific side of Japan including Tokyo is consistent with the northward extension of the sub-tropical high. Thus, the authors infer that the strengthened sub-tropical high plays a role in increasing the number of TCs approaching Japan and also over the East China Sea.
The authors infer that the weakening of the westerly jet also plays some role in increasing the number of TCs approaching Tokyo. First, with weakening of the westerly jet, the VWS, which is detrimental to TC, is reduced. This would allow more TCs to travel in to the middle latitude as TCs are less influenced by the VWS and thus could maintain their structure and intensity. Second, the weakening of the westerly flows in the middle-to-upper troposphere would make the moving direction of TCs more northward. Reduction in the moving vector of TCs in a zonal direction makes the moving vector of TCs more northward under the condition that the moving vector of TCs in a meridional direction is unchanged. Indeed, the July-October averaged moving vector of TCs over southern Japan (120–145°E, 27–33°N) has become more northward in P2 compared to P1. The average zonal and meridional moving speed during the P2 (P1) period are 2.1 (3.3) km h−1 and 15.6 (14.8) km h−1, respectively.
4.3 Comparison with previous studies
The strengthening of the sub-tropical high shown in Fig. 8a is consistent with Ho et al. (2004) and Wu et al. (2005), who showed the strengthening of the high from 1951–1979 to 1980–2001 and from 1965–1983 to 1984–2003, respectively. The changes in SST, VWS, and RH500 shown in Table 1 are consistent with the results of Daloz and Camargo (2017), who presented geographical distributions of changes in the environmental conditions related to TC development between 1980–1996 and 1997–2013 with reanalysis data. Wu et al. (2012) demonstrated that the surface ocean warming rate within the path of sub-tropical western boundary currents, such as the Kuroshio current, which passes south of Tokyo, is two to three times higher than the global mean surface ocean warming rate. Kossin et al. (2014) showed a poleward shift in the lifetime maximum intensity of TCs. These observations support the results of this study, where more TCs approach Tokyo while maintaining their intensities.
Regarding the translation speed of TCs, Kossin (2018) showed that observational data since the midtwentieth century indicate a slowdown of the translation speed of TCs due to the weakening of the general atmosphere circulation. However, Moon et al. (2019) and Lanzante (2019) pointed out that the slowdown may not be a real climate signal and could be due to the inhomogeneity in the observational data used. Although Yamaguchi et al. (2020) showed that according to numerical simulations for the current climate, there is no decreasing trend in the translation speed of TCs, they evaluated the basin-wide- and annual-mean translation speed. Thus, it might happen that the TC translation speed has decreased when it is evaluated at some local areas or locations and in a certain season or month. As a matter of fact, as shown in Fig. 8, the westerly jet has significantly decreased over and south of Japan during July to October, which is thought to be the cause of the slowdown of the translation speed of TCs shown in Table 1. Furthermore, when we analyze the longitudinal distribution (0–360°) of the change in the wind speed at 200 hPa, the weakening of the westerly jet is not zonally uniform and it is relatively large over Japan. Therefore, assessment of the change in the TC translation speed in more detail in time and space and exploring its relationship with global warming and decadal oscillations should be done in a future study.
5. Summary
This study investigated whether TCs approaching Tokyo have changed since 1980 in terms of number and environmental conditions. We show that, based on observational data, the number of TCs approaching the southern coast of Japan, including Tokyo, has increased over the last 40 years, from 1980 to 2019, and that TCs are increasing in strength when they approach land. The environmental conditions for TC development have become more favorable, with warmer SST, less VWS, and more moisture in the atmosphere. In addition, the translation speed of TCs has decreased, which indicates a longer influence time.
When we analyze the synoptic environment during the first (1980–1999, P1) and second (2000–2019, P2) 20 years, the sub-tropical high in the North Pacific is found to be strengthened in P2, where the western and northern edge of the high extends further into the west and the north, respectively. In addition, the westerly jet is weakened over and south of Japan in the middle-to-upper troposphere. The authors infer that these changes in the synoptic environment play a role in increasing the number of Japan-approaching TCs and also in producing more favorable conditions for TC intensification. The slowdown of the translation speed of TCs is thought to be due to the significant decrease in the westerly flows in the middle-to-upper troposphere.
Regarding the effect of global warming, the authors' view is that it is unclear whether these changes are caused by global warming and that further investigations will be needed in the future to address this subject. Of particular importance is to assess the effect of decadal oscillations. TCs in the WNP basin exhibit significant interdecadal variabilities. As the 5-year running mean PDO index is positive from 1980–1998 and negative in many years during the P2 period, decadal oscillations may have played a role in the changes in the TC characteristics shown in the Results section. Thus, a future study should include quantitative evaluation of the contribution of global warming and decadal oscillations using numerical simulation results.
Acknowledgments
The study was supported by the Integrated Research Program for Advancing Climate Models (TOUGOU) and Data Integration and Analysis System (DIAS), both of which are sponsored by the Ministry of Education, Culture, Sports, Science and Technology of Japan (JPMXD0717935561).
References
- Blake, E. S., T. B. Kimberlain, R. J. Berg, J. P. Cangialosi, and J. L. Beven, 2013: Tropical cyclone report: Hurricane Sandy (AL182012) 22–29 October 2012. National Hurricane Center, 157 pp.
- Chan, J. C. L., 2016: Observed variations of western North Pacific tropical cyclone activity on decadal time scales and longer. Climate Change: Multidecadal and Beyond. Chang, C.-P., M. Ghil, M. Latif, and J. M. Wallace (eds.), World Scientific Publishing, 303-313.
- Daloz, A. S., and S. J. Camargo, 2017: Is the poleward migration of tropical cyclone maximum intensity associated with a poleward migration of tropical cyclone genesis? Climate Dyn., 50, 705-715.
- DeMaria, M., and J. Kaplan, 1994: A Statistical Hurricane Intensity Prediction Scheme (SHIPS) for the Atlantic basin. Wea Forecasting, 9, 209-220.
- Fujikawa, N., 2013: Glossary of seasonal forecasts. Seasonal forecasting training report. No. 25, 319-361 (in Japanese). [Available at https://www.jma.go.jp/jma/kishou/books/kisetutext/25/chapter6.pdf.]
- Gray, W. M., 1968: Global view of the origin of tropical disturbances and storms. Mon. Wea. Rev., 96, 669-700.
- Ho, C.-H., J.-J. Baik, J.-H. Kim, D.-Y. Gong, and C.-H. Sui, 2004: Interdecadal changes in summertime typhoon tracks. J. Climate, 17, 1767-1776.
- Imada, Y., S. Maeda, M. Watanabe, H. Shiogama, R. Mizuta, M. Ishii, and M. Kimoto, 2017: Recent enhanced seasonal temperature contrast in Japan from large ensemble high-resolution climate simulations. Atmosphere, 8, 57, doi:10.3390/atmos8030057.
- Ishii, M., A. Shouji, S. Sugimoto, and T. Matsumoto, 2005: Objective analyses of sea-surface temperature and marine meteorological variables for the 20th century using ICOADS and the Kobe Collection. Int. J. Climatol., 25, 865-879.
- Japan Meteorological Agency, 2019: Climate change monitoring report. Japan Meteorological Agency, 92 pp.
- Kepert, J. D., 2010: Tropical cyclone structure and dynamics. Global Perspectives on Tropical Cyclones. Chan, J. C. L., and J. D. Kepert (eds.), World Scientific Publishing, 3-53.
- Kobayashi, S., Y. Ota, Y. Harada, A. Ebita, M. Moriya, H. Onoda, K. Onogi, H. Kamahori, C. Kobayashi, H. Endo, K. Miyaoka, and K. Takahashi, 2015: The JRA-55 reanalysis: General specifications and basic characteristics. J. Meteor. Soc. Japan, 93, 5-48.
- Kossin, J. P., 2018: A global slowdown of tropical-cyclone translation speed. Nature, 558, 104-107.
- Kossin, J. P., K. A. Emanuel, and G. A. Vecchi, 2014: The poleward migration of the location of tropical cyclone maximum intensity. Nature, 509, 349-352.
- Lanzante, J. R., 2019: Uncertainties in tropical-cyclone translation speed. Nature, 570, E6-E15.
- Li, R. C. Y., and W. Zhou, 2018: Revisiting the intraseasonal, interannual, and interdecadal variability of tropical cyclones in the western North Pacific. Atmos. Oceanic Sci. Lett., 11, 198-208.
- Liu, K. S., and J. C. L. Chan, 2008: Interdecadal variability of western North Pacific tropical cyclone tracks. J. Climate, 21, 4464-4476.
- Liu, C., W. Zhang, X. Geng, M. F. Stuecker, and F.-F. Jin, 2019: Modulation of tropical cyclones in the southeastern part of western North Pacific by tropical Pacific decadal variability. Climate Dyn., 53, 4475-4488.
- Mantua, N. J., S. R. Hare, Y. Zhang, J. M. Wallace, and R. C. Francis, 1997: A Pacific interdecadal climate oscillation with impacts on salmon production. Bull. Amer. Meteor. Soc., 78, 1069-1080.
- Matsuura, T., M. Yumoto, and S. Iizuka, 2003: A mechanism of interdecadal variability of tropical cyclone activity over the western North Pacific. Climate Dyn., 21, 105-117.
- Mizuta, R., A. Murata, M. Ishii, H. Shiogama, K. Hibino, N. Mori, O. Arakawa, Y. Imada, K. Yoshida, T. Aoyagi, H. Kawase, M. Mori, Y. Okada, T. Shimura, T. Nagatomo, M. Ikeda, H. Endo, M. Nosaka, M. Arai, C. Takahashi, K. Tanaka, T. Takemi, Y. Tachikawa, K. Temur, Y. Kamae, M. Watanabe, H. Sasaki, A. Kitoh, I. Takayabu, E. Nakakita, and M. Kimoto, 2017: Over 5,000 years of ensemble future climate simulations by 60 km global and 20 km regional atmospheric models. Bull. Amer. Meteor. Soc., 98, 1383-1398.
- Moon, I.-J., S.-H. Kim, and J. C. L. Chan, 2019: Climate change and tropical cyclone trend. Nature, 570, E3-E5.
- Normile, D., 2019: Deadly typhoon forces Japan to face its vulnerability to increasingly powerful storms. Science, doi:10.1126/science.aaz9495.
- Power, S., T. Casey, C. Folland, A. Colman, and V. Mehta, 1999: Inter-decadal modulation of the impact of ENSO on Australia. Climate Dyn., 15, 319-324.
- Schreck, C. J., K. R. Knapp, and J. P. Kossin, 2014: The impact of best track discrepancies on global tropical cyclone climatologies using IBTrACS. Mon. Wea. Rev., 142, 3881-3899.
- Shay, L. K., 2010: Air-sea interactions in tropical cyclones. Global Perspectives on Tropical Cyclones. Chan, J. C. L., and J. D. Kepert (eds.), World Scientific Publishing, 93-131.
- United Nations, 2019: World urbanization prospects: The 2018 revision (ST/ESA/SER.A/420). United Nations, Department of Economic and Social Affairs, Population Division, 103 pp.
- Urabe, Y., and S. Maeda, 2014: The relationship between Japan's recent temperature and decadal variability. SOLA, 10, 176-179.
- Wu, L., B. Wang, and S. Geng, 2005: Growing typhoon influence on East Asia. Geophys. Res. Lett., 32, L18703, doi:10.1029/2005GL022937.
- Wu, L., W. Cai, L. Zhang, H. Nakamura, A. Timmermann, T. Joyce, M. J. McPhaden, M. Alexander, B. Qiu, M. Visbeck, P. Chang, and B. Giese, 2012: Enhanced warming over the global subtropical western boundary currents. Nat. Climate Change, 2, 161-166.
- Yamaguchi, M., H. Owada, U. Shimada, M. Sawada, T. Iriguchi, K. D. Musgrave, and M. DeMaria, 2018: Tropical cyclone intensity prediction in the western North Pacific basin using SHIPS and JMA/GSM. SOLA, 14, 138-143.
- Yamaguchi, M., J. C. L. Chan, I.-J. Moon, K. Yoshida, and R. Mizuta, 2020: Global warming changes tropical cyclone translation speed. Nat. Commun., 11, 47, doi: 10.1038/s41467-019-13902-y.
- Yoshida, K., M. Sugi, R. Mizuta, H. Murakami, and M. Ishii, 2017: Future changes in tropical cyclone activity in high-resolution large-ensemble simulations. Geophys. Res. Lett., 44, 9910-9917.
- Yumoto, M., and T. Matsuura, 2001: Interdecadal variability of tropical cyclone activity in the western North Pacific. J. Meteor. Soc. Japan, 79, 23-35.